linalg 서브모듈 사용하여 선형대수 연산하기
np.linalg.inv
- 역행렬을 구할 때 사용
- 모든 차원의 값이 같아야 함
x = np.random.rand(3, 3, 3)
print(x)
>>> [[[0.03885733 0.93111384 0.81419661]
      [0.59288538 0.00131531 0.53366806]
      [0.87468239 0.41978832 0.95209541]]

     [[0.75040613 0.33173045 0.52141919]
      [0.21707044 0.97768132 0.01741108]
      [0.60254256 0.41022149 0.7488423 ]]

     [[0.13405114 0.54190123 0.97170188]
      [0.64393351 0.12307939 0.48009673]
      [0.04833928 0.57043462 0.13256568]]]
x @ np.linalg.inv(x) # np.matmul(x, np.linalg.inv(x))
>>> array([[[ 1.00000000e+00, -4.26194733e-16,  4.58306791e-16],
            [-5.16532656e-18,  1.00000000e+00,  5.87022837e-16],
            [ 1.08666310e-16, -1.60943495e-16,  1.00000000e+00]],

           [[ 1.00000000e+00, -1.16405664e-17, -8.32493154e-17],
            [-6.80372627e-18,  1.00000000e+00, -3.96627988e-17],
            [-2.15327499e-16, -8.77731344e-17,  1.00000000e+00]],

           [[ 1.00000000e+00,  1.92899546e-17, -6.33254945e-17],
            [ 3.93289011e-17,  1.00000000e+00, -3.59576072e-17],
            [ 1.22598225e-18,  1.21088974e-18,  1.00000000e+00]]])
np.linalg.solve
A = np.array([[1, 1], [2, 4]])
B = np.array([25, 64])

x = np.linalg.solve(A, B)
print(x)
>>> [18.  7.]

np.allclose(A@x, B)
>>> True
matplotlib 모듈 이용하여 그래프 표현하기
그래프 데이터 생성
import numpy as np
import matplotlib.pyplot as plt
%matplotlib inline

x = np.linspace(0, 10, 11)
y = x ** 2 + x + 2 + np.random.randn(11)

print(x)
>>> [ 0.  1.  2.  3.  4.  5.  6.  7.  8.  9. 10.]

print(y)
>>> [  1.92944201   3.55252642   8.05356822  14.99323997  24.06317443
      33.26957931  44.76942364  58.22092059  75.07266526  91.62653078
     110.73356151]
그래프 출력하기
- plot함수 (선 그래프), scatter(점 그래프), hist(히스토그램) 등 사용
- 함수의 parameter 혹은 plt의 다른 함수로 그래프 형태 및 설정을 변경 가능
- 기본적으로, x, y에 해당하는 값이 필요
plt.plot(x, y)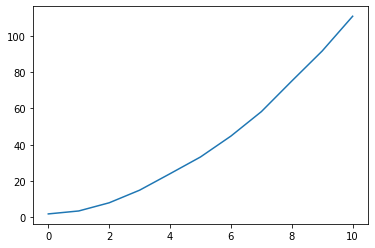
plt.scatter(x, y)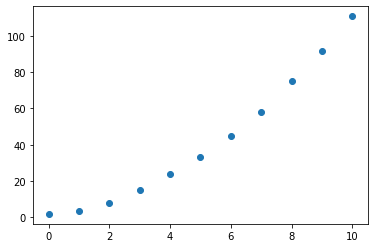
그래프에 주석 추가
- x, y 축 및 타이틀
plt.xlabel('X values')
plt.ylabel('Y values')
plt.title('X-Y relation')
plt.plot(x, y)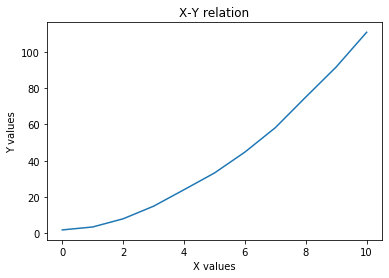
- grid 추가
plt.xlabel('X values')
plt.ylabel('Y values')
plt.title('X-Y relation')
plt.grid(True)
plt.plot(x, y)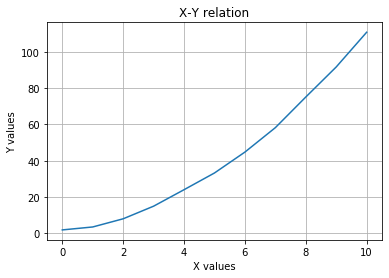
x, y축 범위 지정
plt.xlabel('X values')
plt.ylabel('Y values')
plt.title('X-Y relation')
plt.grid(True)

plt.xlim(0, 20)
plt.ylim(0, 200)

plt.plot(x, y)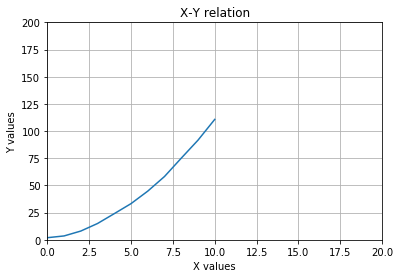
plot 함수 parameters
-
그래프의 형태에 대한 제어 가능
-
그래프의 색상 변경
plt.plot(x, y, '#ff00ff')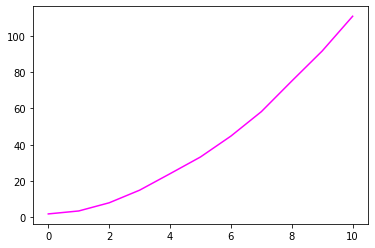
- 그래프 선스타일 변경
plt.plot(x, y, '-.')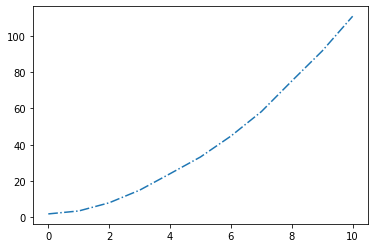
plt.plot(x, y, 'g^')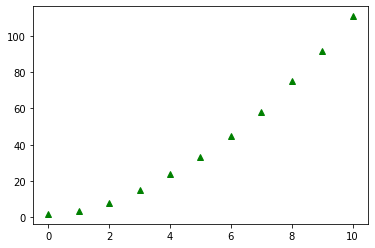
plt.plot(x, y, 'm:')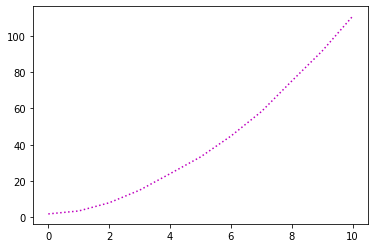
- 그래프 두께 변경
- linewidth 명시
plt.plot(x, y, 'm:', linewidth=9)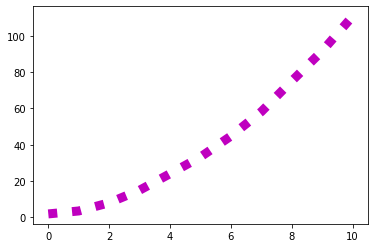
- keyword parameter 이용하여 모든 속성 설정
plt.plot(x, y, color='black',
          linestyle='--', marker='^',
         markerfacecolor='blue', markersize=6)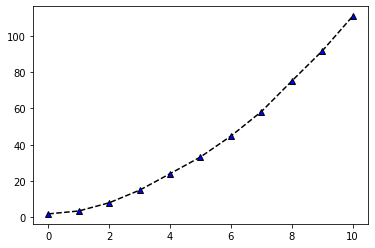
subplot으로 여러 그래프 출력하기
- subplot함수로 구획을 구별하여 각각의 subplot에 그래프 출력
plt.subplot(2, 2, 1)
plt.plot(x, y, 'r')

plt.subplot(2, 2, 2)
plt.plot(x, y, 'g')

plt.subplot(2, 2, 3)
plt.plot(y, x, 'k')

plt.subplot(2, 2, 4)
plt.plot(x, np.exp(x), 'b')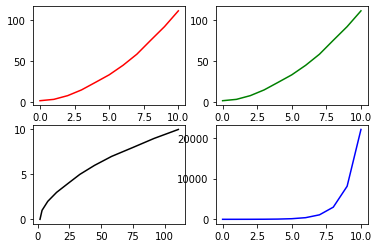
hist함수 사용
- histogram 생성
- bins로 historgram bar 개수 설정
data = np.random.randint(1, 100, size=200)
print(data)
>>> [14 35 75 26 26  5 30 28 23  2 59 60 92 17 27 76  3 88 99 52 73 86 18 28
     28 55 90 33 92 85 95 89 46 86  4 31 50 33 10 99 70 73 25 25 33 50  5 47
     50 28 79 25 67 43 33 20 13 61 23 48 91 64  3 59 54 30 13 26 70 20 12 51
      7  5 95 30 18  7 37 24 32 57 92 90 82  8 20 79 35 58 45 93 44 37 22  3
     68 62 39 61 28 66 31 77 54 69 47 14 78 93 76 10 68 72 64 20 58 65 73 26
      1 32 93 39 99 89 97 34 11 61 45 50 24 17  4 62 69 83 27 71 46 79 77 92
     39 34 72 76 62 77 48 25 38 74 15 68 47 39 83 86 16 85 94 32 59 58 63 15
     10  1  6 47 13 93 54 69 49 12 53  6 39 53 38 55 59 79 88 71 23 81 36 78
49 30 93 5 26 53 75 17]plt.hist(data, bins=20, alpha=0.3)
plt.xlabel('값')
plt.ylabel('개수')
plt.grid(True)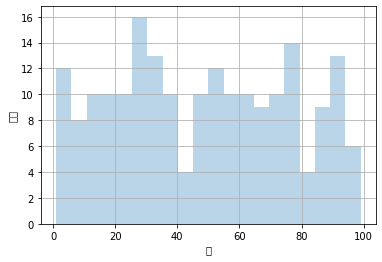
머신러닝과 데이터 분석 A-Z 올인원 패키지 Online. 👉 https://bit.ly/3cB3C8y