-
Visualization에서 가장 큰 비중을 차지하는 속성이 위치(area)와 색상(Color)이다.
-
위치는 데이터 정보에 따라 달라지지만 색상은 직접 설정해주어야 하는 요소로 알맞게 사용할수록 큰 효과를 줄 수 있다.
-
심미적인 효과도 있지만 독자에게 전달해주고 싶은 포인트를 강조하여 가독성을 증대시킬수 있다.
Color Palette
Categorical

-
discrete, qualitative라고도 불림
-
독립된 색상으로 구성되며 범주형 변수에 사용
-
색의 차이를 구분하는 것이 목적
Sequential

-
정렬된 값을 가진 연속형, 순서형 변수에 사용
-
색상은 단일 색조로 표현하는 것이 적합하다.
-
균일한 색상의 변화가 중요하다.
Divergence

-
연속형과 유사하지만 중앙을 기준으로 발산(상반된 값이나 지지율과 같은 변수에 적합)
-
양 끝으로 갈수록 진해지는 구조
-
중앙의 색은 어느 한쪽으로도 편향되면 안된다.
ETC
데이터에서 다름을 보이기 위해 색상 대비(color contrast)를 사용할 수 있다.
-
명도 대비 : 밝은색과 어두운색을 배치 (회색,검정)
-
색상 대비 : 가까운색은 차이가 더 크게 보임 (파랑,보라 / 빨강,보라)
-
채도 대비 : 채도의 차이 (회색,주황)
-
보색 대비 : 정반대의 색상 사용 (빨강,초록)
색 인지가 중요한 분야에는 색각 이상을 고려해야 한다.
-
삼원색 중 특정 색을 감지 못하면 색맹
-
부분적 인지 이상이 있다면 색약
-
Scientific color map 사용
실습
Data : 학생 데이터
색상 이해하기
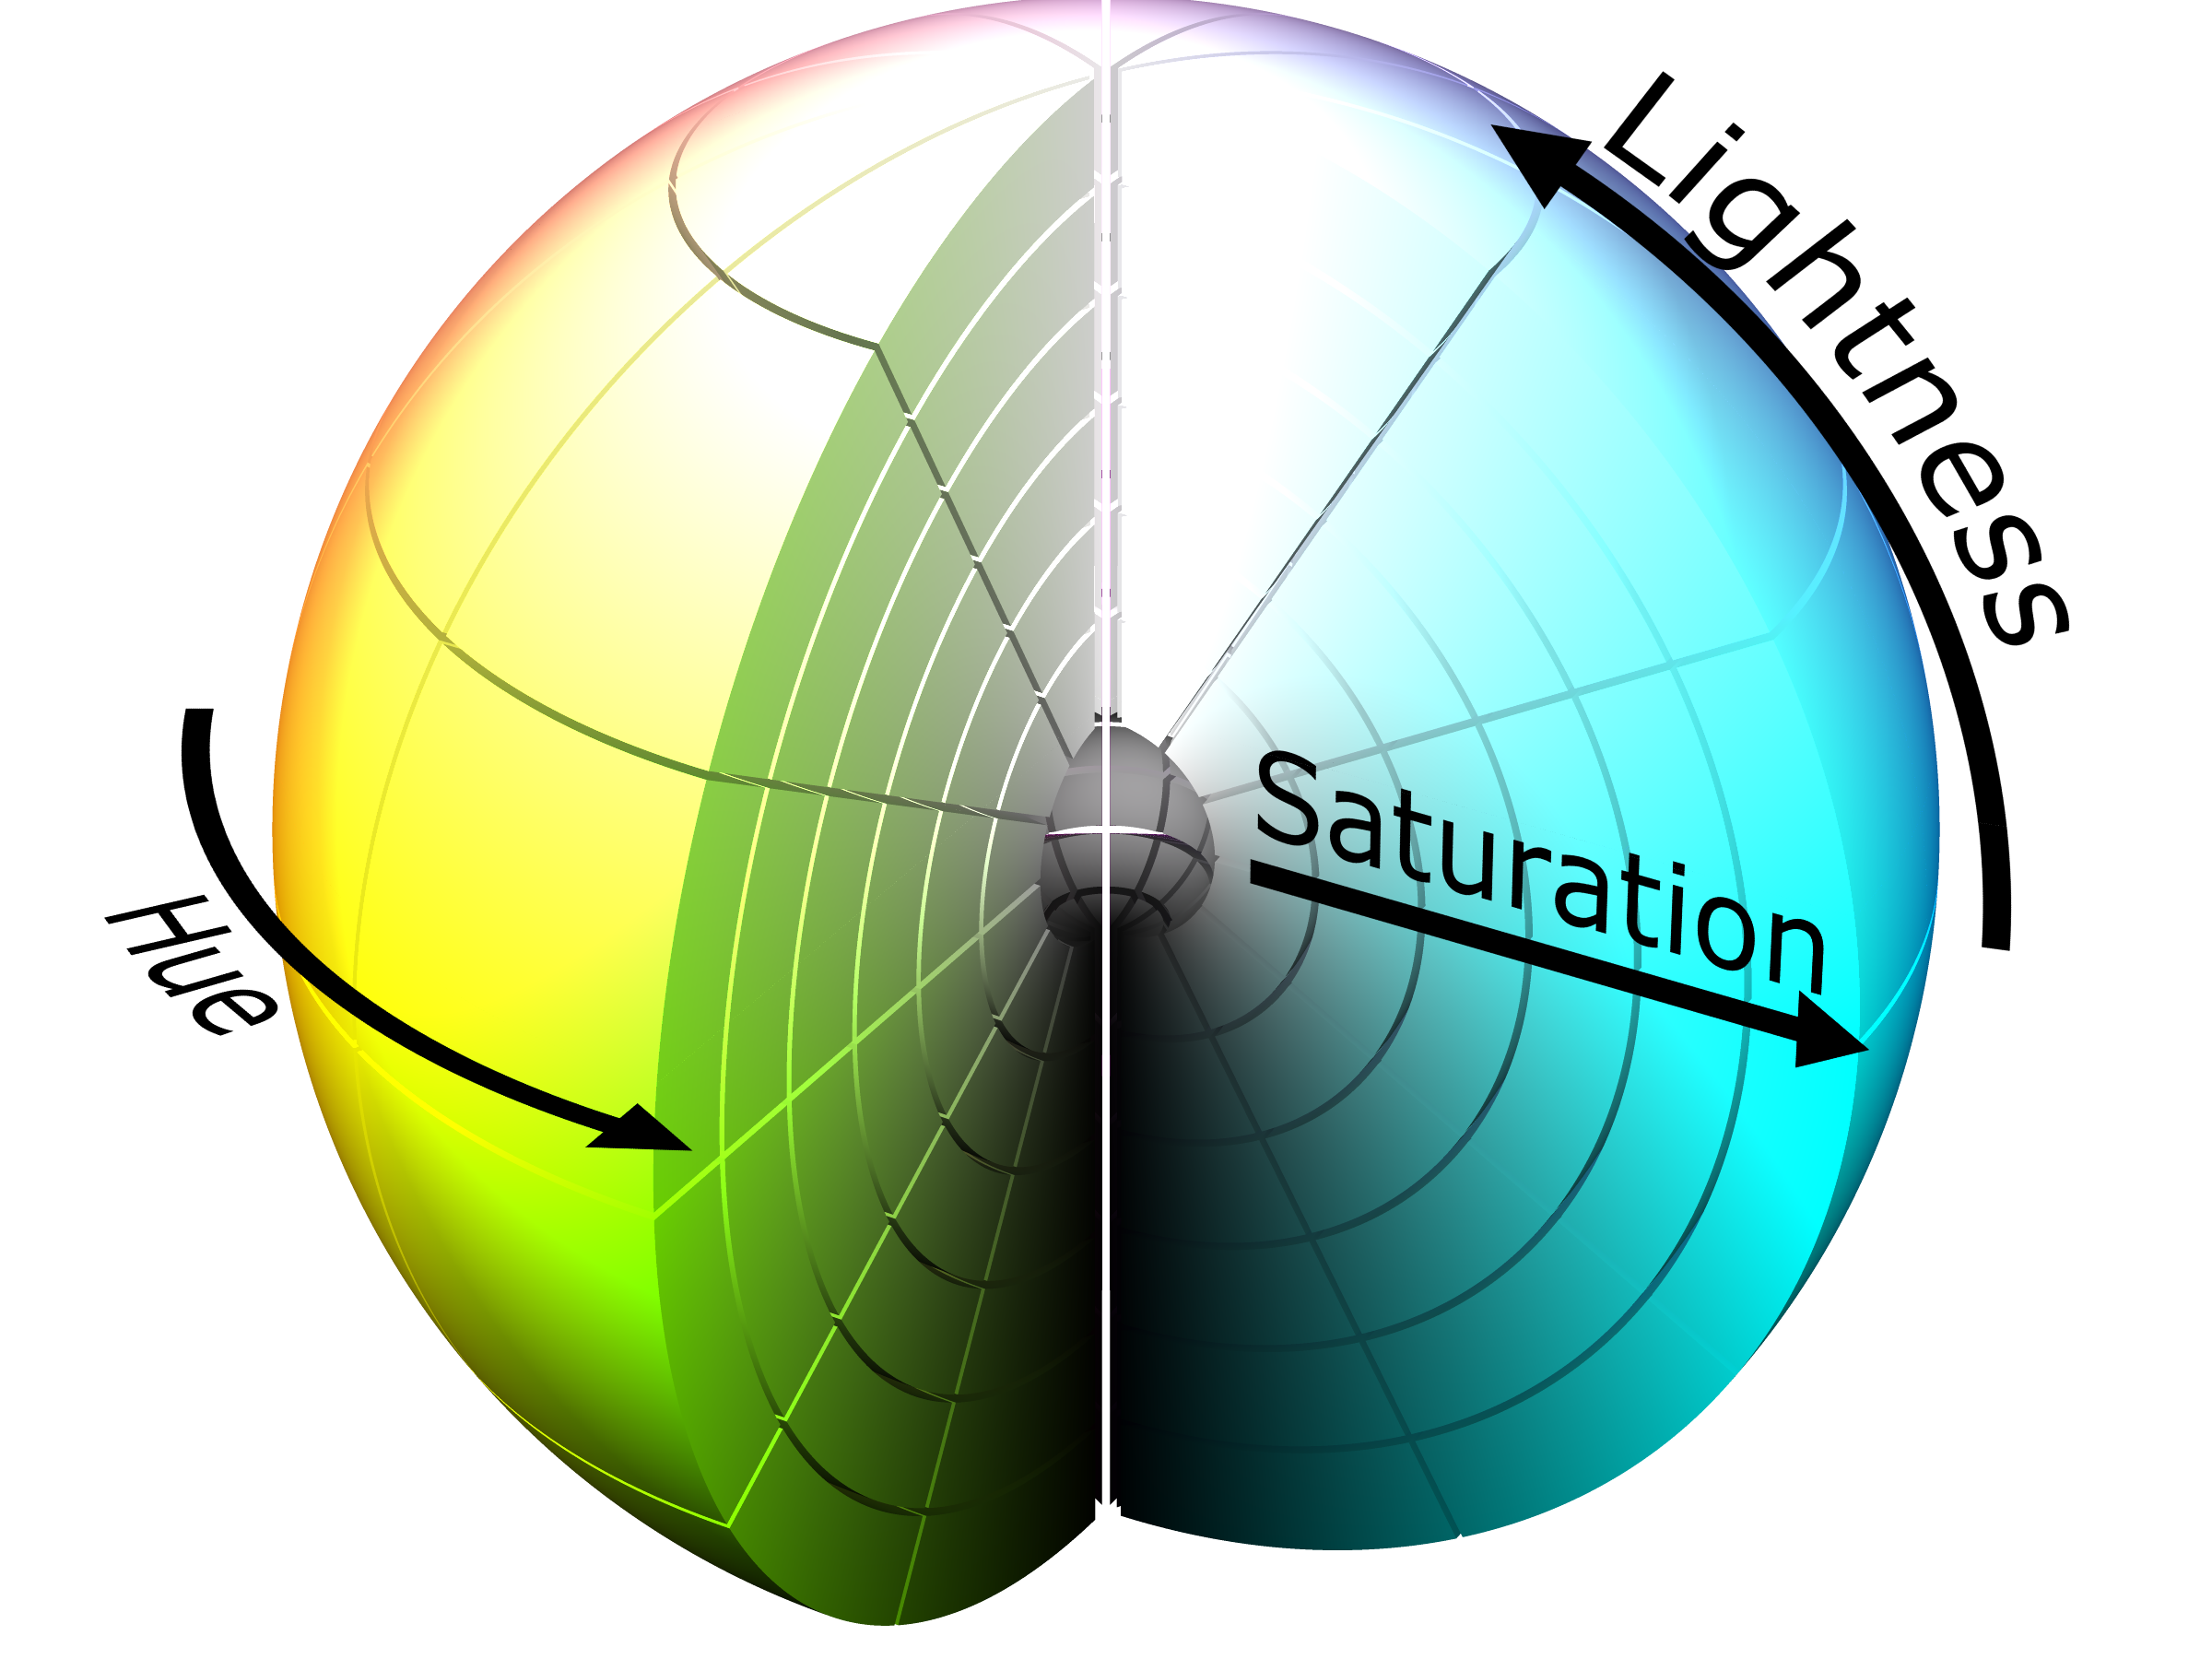
색을 이해하기 위해서는 rgb보다 hsl을 이해하는 것이 중요하다.
- Hue(색조) : 빨강, 파랑, 초록 등 색상으로 생각하는 부분
- 빨강에서 보라색까지 있는 스펙트럼에서 0-360으로 표현
- Saturate(채도) : 무채색과의 차이
- 선명도라고 볼 수 있음 (선명하다와 탁하다.)
- Lightness(광도) : 색상의 밝기

Categorical (Qualitative)
# 리스트로 전달하면 cm으로 변환해주는 클래스
from matplotlib.colors import ListedColormap

qualitative_cm_list = ['Pastel1', 'Pastel2', 'Accent', 'Dark2', 'Set1', 'Set2', 'Set3', 'tab10']

fig, axes = plt.subplots(2, 4, figsize=(20, 8))
axes = axes.flatten()

student_sub = student.sample(100)

for idx, cm in enumerate(qualitative_cm_list):
    pcm = axes[idx].scatter(student_sub['math score'], student_sub['reading score'],
                     c=student_sub['color'], cmap=ListedColormap(plt.cm.get_cmap(cm).colors[:5])
                     )
    cbar = fig.colorbar(pcm, ax=axes[idx], ticks=range(5))
    cbar.ax.set_yticklabels(groups)
    axes[idx].set_title(cm)

plt.show()
-
ListedColormap: List를 cm으로 변환 -
c와cmap파라미터를 이용하여 색을 지정해줄 수 있다. -
Set2,tab10이 일반적으로 사용되며 R color map의 사이트에서 다양한 색조합을 찾아 전달해줄 수 있다.
Sequential
-
Heatmap, Contour Plot등 사용
-
지리, 계층형 데이터에도 적합하다.
-
색조는 유지하되 색의 밝기를 조정
sequential_cm_list = ['Greys', 'Purples', 'Blues', 'Greens', 'Oranges', 'Reds',
            'YlOrBr', 'YlOrRd', 'OrRd', 'PuRd', 'RdPu', 'BuPu',
            'GnBu', 'PuBu', 'YlGnBu', 'PuBuGn', 'BuGn', 'YlGn']

fig, axes = plt.subplots(3, 6, figsize=(25, 10))
axes = axes.flatten()

student_sub = student.sample(100)

for idx, cm in enumerate(sequential_cm_list):
    pcm = axes[idx].scatter(student['math score'], student['reading score'],
                            c=student['reading score'],
                            cmap=cm,
                            vmin=0, vmax=100

                     )
    fig.colorbar(pcm, ax=axes[idx])
    axes[idx].set_title(cm)

plt.show()
-
vmin,vmax: value의 최소, 최대값을 지정하고 이 최소값보다 작은 값은 최소값의 색상으로, 최대값보다 큰 값을 최대값의 색상으로 나타난다. -
c에 sequential map에 적용시킬 인자를 넘겨주어 그 값으로 색이 지정된다. -
Maplotlib에서 Heatmap은
im.show()를 사용해 그릴 수 있다.
Divergence
-
중심을 어디로 삼을지 중요하다.
-
상관관계를 나타낼 때 좋다.
from matplotlib.colors import TwoSlopeNorm

diverging_cm_list = ['PiYG', 'PRGn', 'BrBG', 'PuOr', 'RdGy', 'RdBu',
            'RdYlBu', 'RdYlGn', 'Spectral', 'coolwarm', 'bwr', 'seismic']

fig, axes = plt.subplots(3, 4, figsize=(20, 15))
axes = axes.flatten()

offset = TwoSlopeNorm(vmin=0, vcenter=student['reading score'].mean(), vmax=100)

student_sub = student.sample(100)

for idx, cm in enumerate(diverging_cm_list):
    pcm = axes[idx].scatter(student['math score'], student['reading score'],
                            c=offset(student['math score']),
                            cmap=cm,
                     )
    cbar = fig.colorbar(pcm, ax=axes[idx],
                        ticks=[0, 0.5, 1],
                        orientation='horizontal'
                       )
    cbar.ax.set_xticklabels([0, student['math score'].mean(), 100])
    axes[idx].set_title(cm)

plt.show()
TwoSlopeNorm을 전달 받은 인자를 최소값과 중간값, 최대값을 각각0.,0.5,1.0기준으로 알맞게 변환해준다.