아래는 2008~2021년 의 기간 동안 수집한 넷플리스의 메타데이터를 분석해 A회사가 컨텐츠 제작 및 구매 전략을 만들기 위해 사용자의 선호도와 시청패턴에 대해 이해하고 인사이트를 도출하기 위한 데이터 분석 프로젝트이다.
문제 상황은 이렇다:
🔖
A사는 넷플릭스 플랫폼에서 제공하는 컨텐츠에 대한 사용자 선호도와 관련된 데이터 분석 작업을 통해 시청자 행동과 선호를 이해하고자 한다.
⛳ 문제정의
▶ 넷플릭스 사용자들의 대량의 컨텐츠에 대한 선호도를 분석하고, 이를 통해 컨텐츠 제작 및 구매 전략에 필요한 인사이트를 도출해야 함
⛳ 기대효과
▶ 데이터 분석을 통해 사용자의 선호와 시청 패턴에 대한 정확한 이해를 바탕으로 전략적인 컨텐츠 관리 및 마케팅 계획을 수립할 수 있음
▶ 시청자 데이터를 기반으로 한 인사이트 도출을 통해 넷플릭스의 컨텐츠 포트폴리오를 최적화할 수 있음
⛳ 해결방안
▶ 메타데이터를 활용한 다차원적인 데이터 분석 수행
▶ 사용자의 시청 기록과 프로파일 데이터를 분석하여 선호도 패턴 이해
▶ 인구통계학적 데이터와 결합하여 시청자 기반의 시장 분석 수행
⛳ 성과측정
▶ 분석 결과의 인사이트가 컨텐츠 관련 의사결정에 얼마나 영향을 미치는지 평가
▶ 데이터 기반 결정의 성과를 측정하기 위한 KPI 설정(예: 컨텐츠 관람수, 사용자 확보 수, 구독 전환율 등)
⛳ 운영
▶ 정기적인 데이터 분석을 통한 시장 동향 및 사용자 선호의 변화 모니터링
▶ 분석 결과를 컨텐츠 구매, 제작, 마케팅 전략에 실질적으로 적용
데이터셋 정의
# ▶ Data read
import pandas as pd
df = pd.read_csv('S_PJT13_DATA.csv')
df.head()

  show_id     type  title           director                                               cast        country        date_added  release_year rating  duration                                        listed_in                                       description
0      s1  TV Show     3%               None  João Miguel, Bianca Comparato, Michel Gomes, R...         Brazil    August 14, 2020          2020  TV-MA  4 Seasons  International TV Shows, TV Dramas, TV Sci-Fi &...  In a future where the elite inhabit an island ...
1      s2    Movie   7:19  Jorge Michel Grau  Demián Bichir, Héctor Bonilla, Oscar Serrano, ...         Mexico  December 23, 2016          2016  TV-MA     93 min                       Dramas, International Movies  After a devastating earthquake hits Mexico Cit...
2      s3    Movie  23:59      Gilbert Chan  Tedd Chan, Stella Chung, Henley Hii, Lawrence ...      Singapore  December 20, 2018          2011      R     78 min                        Horror Movies, International Movies  When an army recruit is found dead, his fellow...
3      s4    Movie      9        Shane Acker  Elijah Wood, John C. Reilly, Jennifer Connelly...  United States  November 16, 2017          2009  PG-13     80 min  Action & Adventure, Independent Movies, Sci-Fi...  In a postapocalyptic world, rag-doll robots hi...
4      s5    Movie     21   Robert Luketic  Jim Sturgess, Kevin Spacey, Kate Bosworth, Aar...  United States   January 1, 2020          2008  PG-13    123 min                                              Dramas  A brilliant group of students become card-coun...
- 컬럼 정보
show_id: 각 영화/TV 쇼의 고유 ID
type: 식별자 - 영화 또는 TV 쇼
title: 영화 / TV 쇼의 제목
director: 영화의 감독
cast: 영화/쇼에 참여한 배우들
country: 영화/쇼가 제작된 국가
date_added: Netflix에 추가된 날짜
release_year: 영화/쇼의 실제 출시 연도
rating: 영화/쇼의 TV 평점
duration: 총 시간 - 분 또는 시즌 수
데이터 전처리 및 EDA
(1) Data shape(형태) 확인
# ▶ Data 형태 확인
# ▶ 7,787 row, 12 col로 구성됨
print('df', df.shape)

> df (7787, 12)- 7787 개의 데이터가 있으며 12개의 컬럼으로 이루어져 있음.
(2) Data type 확인
# ▶ Data type 확인
df.info()

<class 'pandas.core.frame.DataFrame'>
RangeIndex: 7787 entries, 0 to 7786
Data columns (total 12 columns):
 #   Column        Non-Null Count  Dtype
---  ------        --------------  -----
 0   show_id       7787 non-null   object
 1   type          7787 non-null   object
 2   title         7787 non-null   object
 3   director      5398 non-null   object
 4   cast          7069 non-null   object
 5   country       7280 non-null   object
 6   date_added    7777 non-null   object
 7   release_year  7787 non-null   int64
 8   rating        7780 non-null   object
 9   duration      7787 non-null   object
 10  listed_in     7787 non-null   object
 11  description   7787 non-null   object
dtypes: int64(1), object(11)
memory usage: 730.2+ KB
총 11개의 열 데이터가 있으며 duration, date_added 등 숫자형이나 날짜형 타입의 데이터들이 object 문자형 데이터로 선언이 돼있다.
필요에 따라 데이터 분석 진행 시 int나 date 타입으로 변경시키는게 좋을 거 같다.
(3) Null값 확인 (※ 빈 값의 Data)
show_id            0
type               0
title              0
director        2389
cast             718
country          507
date_added        10
release_year       0
rating             7
duration           0
listed_in          0
description        0
dtype: int64director,cast,country, 등의 데이터는 컨텐츠 분석을 위해 크게 중요한 변수는 아니기에 null값 처리를 따로 해주지는 않았다.
null 값 처리
(4) Outlier 확인 (이상치, 정상적인 범주를 벗어난 Data)
# ▶ Outlier 확인
df.describe()
release_year는 출시년도를 의미하는 데이터로 이상치가 있다해도 크게 의미 없는 데이터라 이상치가 존재하지 않는다고 할 수 있다.
음수값 제거
(5) 데이터 EDA
중요 변수 시각화 및 탐색
사용자들의 컨텐츠 선호도를 분석하기 위해 중요한 변수들인 type, release_year, rating, country, duration 변수들의 분포를 시각적으로 확인해보았다.
import matplotlib.pyplot as plt
import seaborn as sns
plt.style.use('dark_background')

# ▶ 설정: Seaborn
sns.set(style="whitegrid")

# ▶ 데이터 프레임에서 'duration'의 숫자만 추출하기 위해 필요한 작업
df['duration_num'] = df['duration'].str.extract('(\d+)').astype(float)

#  ▶ 시각화를 위한 그래프 크기 설정
plt.figure(figsize=(20, 15))

# ▶ type 분포
plt.subplot(3, 2, 1)
sns.countplot(data=df, x='type')
plt.title('Distribution of Content Types')

# ▶ release_year 분포
plt.subplot(3, 2, 2)
sns.countplot(data=df, y='release_year', order=df['release_year'].value_counts().index[:20])
plt.title('Distribution of Release Years')

# ▶ rating 분포
plt.subplot(3, 2, 3)
sns.countplot(data=df, x='rating', order=df['rating'].value_counts().index)
plt.title('Distribution of Ratings')

# ▶ country 분포 (상위 20개)
plt.subplot(3, 2, 4)
top_countries = df['country'].value_counts().index[:20]
sns.countplot(data=df, y='country', order=top_countries)
plt.title('Top 20 Countries with Most Content')

# ▶ duration 분포 (영화만)
plt.subplot(3, 2, 5)
sns.histplot(data=df[df['type'] == 'Movie'], x='duration_num', bins=30, kde=True)
plt.title('Distribution of Movie Durations')


# ▶ 그래프 보여주기
plt.tight_layout()
plt.show()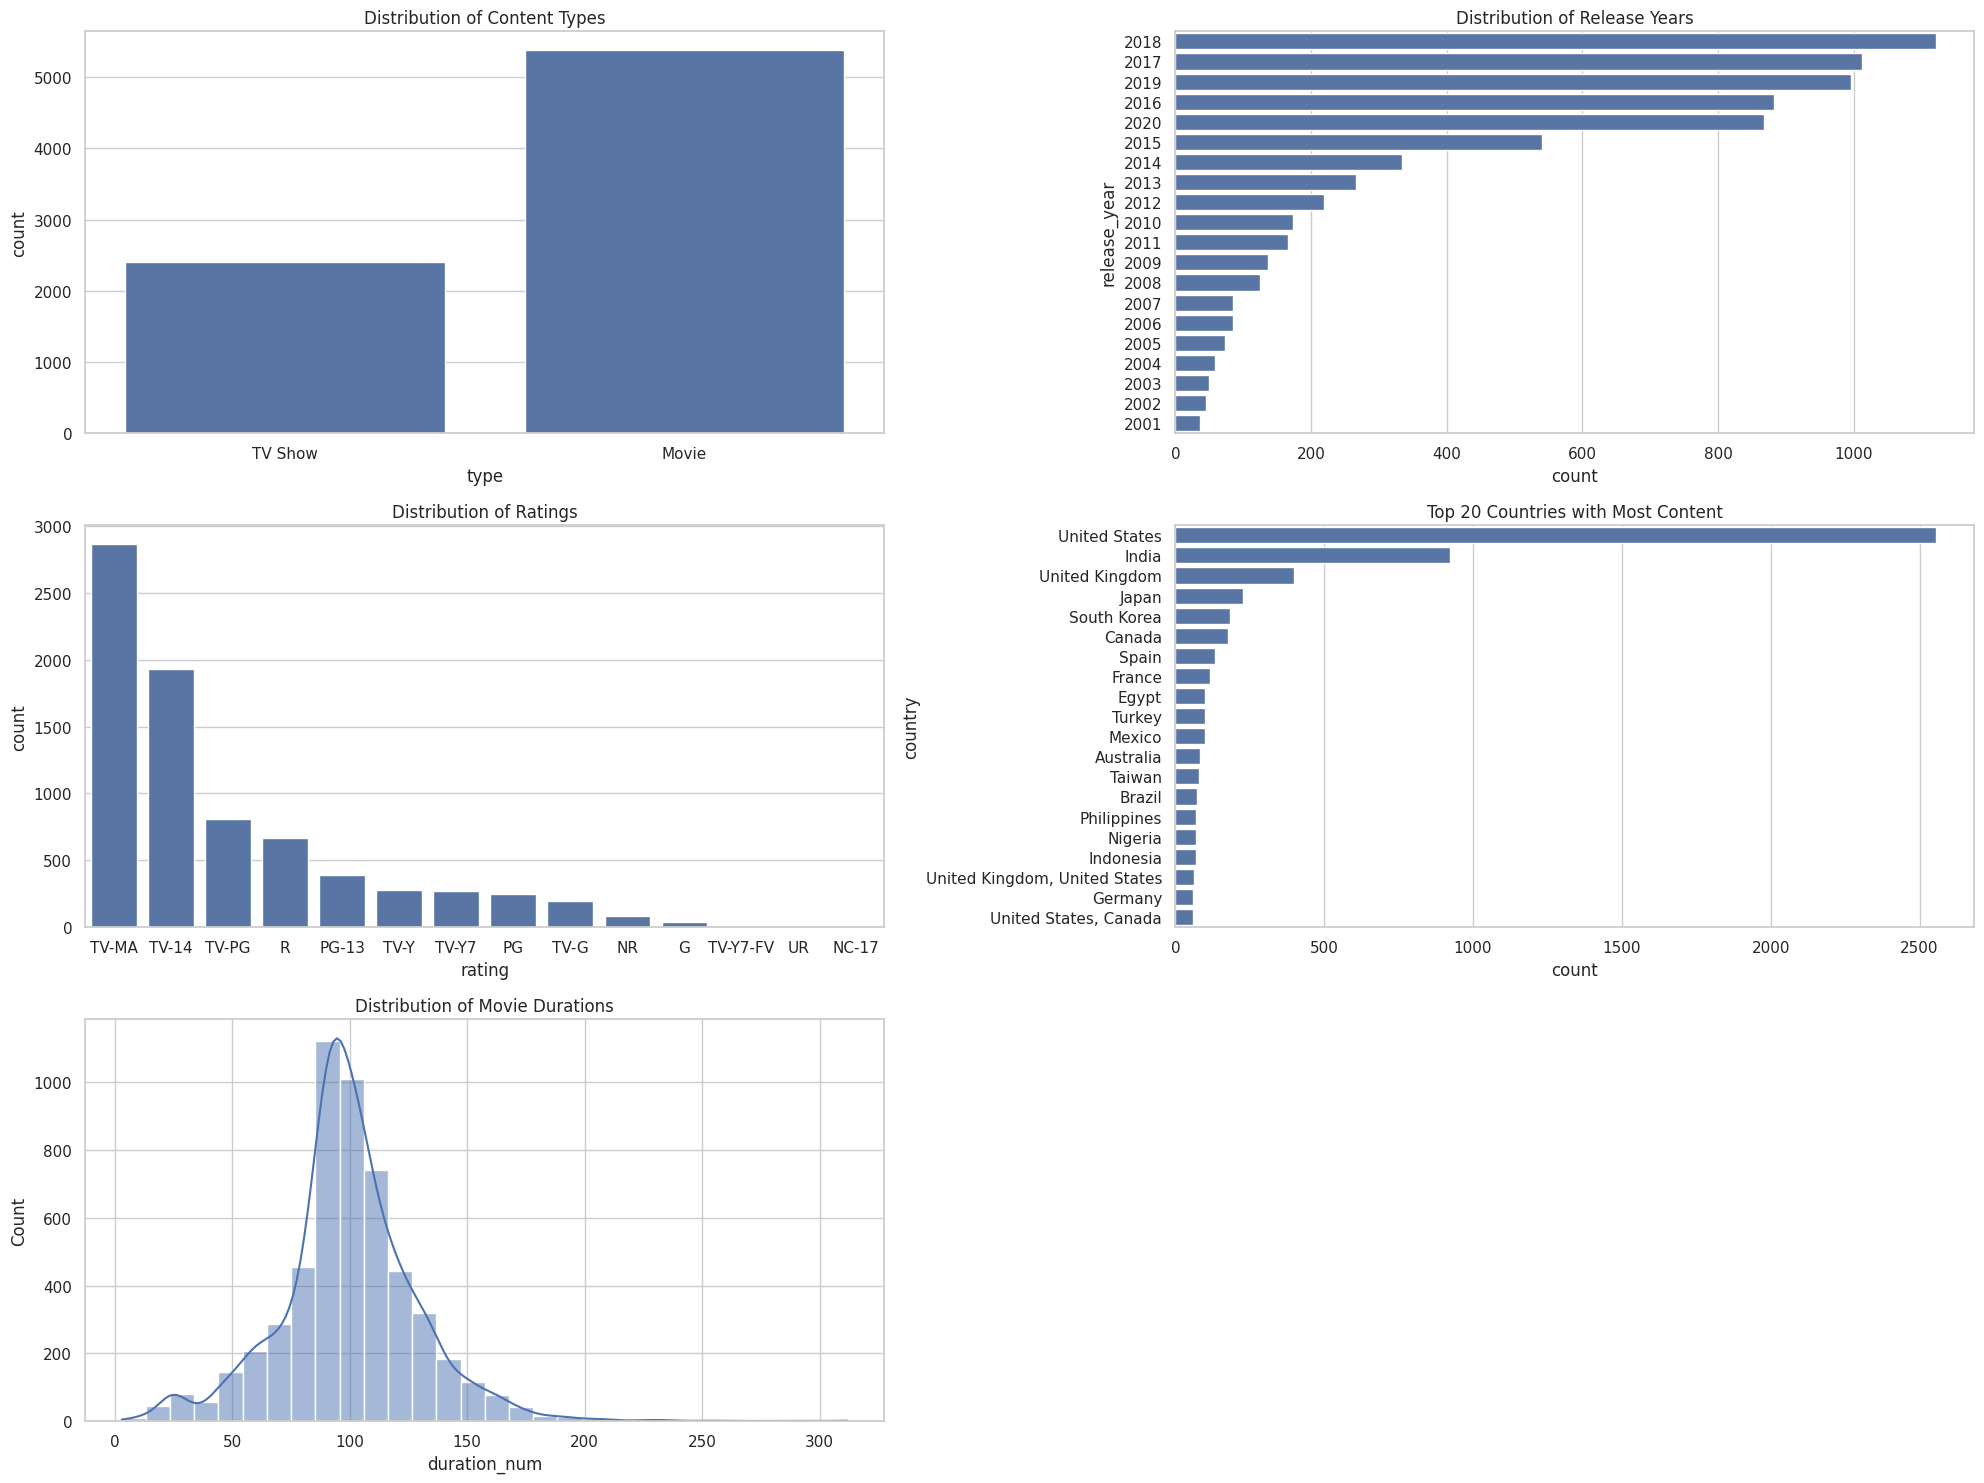
중요 변수 시각화 후 분석 결과는 다음과 같다:
- 컨텐츠 유형 분포 (Distribution of Content Types): 'Movie'가 'TV Show'보다 훨씬 많은 것으로 나타난다.
-
출시 연도 분포 (Distribution of Release Years): 최근 몇 년 동안 출시된 컨텐츠의 수가 많으며, 특히 2018년과 2019년에 많은 컨텐츠가 출시된 것으로 보인다.
-
평점 분포 (Distribution of Ratings): 'TV-MA' (성인 대상) 등급의 컨텐츠가 가장 많고, 그 다음으로 'TV-14' (14세 이상 대상) 등급의 컨텐츠가 많다.
-
콘텐츠 제작 국가 분포 (Top 20 Countries with Most Content): 미국이 압도적으로 많은 컨텐츠를 제작한 것으로 나타나며, 그 다음으로는 인도, 영국, 일본 순이다.
-
영화 시간 분포 (Distribution of Movie Durations): 대부분의 영화는 80분에서 120분 사이의 길이를 가지고 있으며, 특히 100분 주변에 많은 영화가 분포하고 있다.
컨텐츠 제작 전략 수립을 위한 컨텐츠 분석
컨텐츠 제작 전략 수립을 위한 컨텐츠 분석을 위해 아래의 항목들을 분석 및 시각화해보았다.
- 장르별 컨텐츠
- 국가별 컨텐츠
- 시청자 컨텐츠별 선호도
- 넷플릭스의 컨텐츠 업데이트 추세 패턴
(1) 장르별 컨텐츠 분석
일단 'reservation_status' 즉 전체적인 예약의 현황을 살펴보았다.
from collections import Counter
plt.style.use('dark_background')
# ▶ 장르별 컨텐츠 분석을 위해 'listed_in' 열에서 각 장르를 분리하고 카운트합니다.
genre_counts = Counter()
df['listed_in'].str.split(', ').apply(genre_counts.update)
# 1. df['listed_in'].str.split(', '): 'listed_in' 열의 각 항목을 ', ' 기준으로 분리한다.
# 2. .apply(genre_counts.update): 분리된 각 장르를 Counter 객체인 genre_counts에 업데이트하여 카운트한다.


# ▶ 가장 많이 등장하는 장르 상위 10개를 추출합니다.
top_genres = genre_counts.most_common(10)

# ▶ 장르별 컨텐츠 시각화
plt.figure(figsize=(10, 5))
genres = pd.DataFrame(top_genres, columns=['Genre', 'Count'])
sns.barplot(data=genres, x='Count', y='Genre')
plt.title('Top Genres on Netflix')
plt.xlabel('Number of Contents')
plt.ylabel('Genre')
plt.show()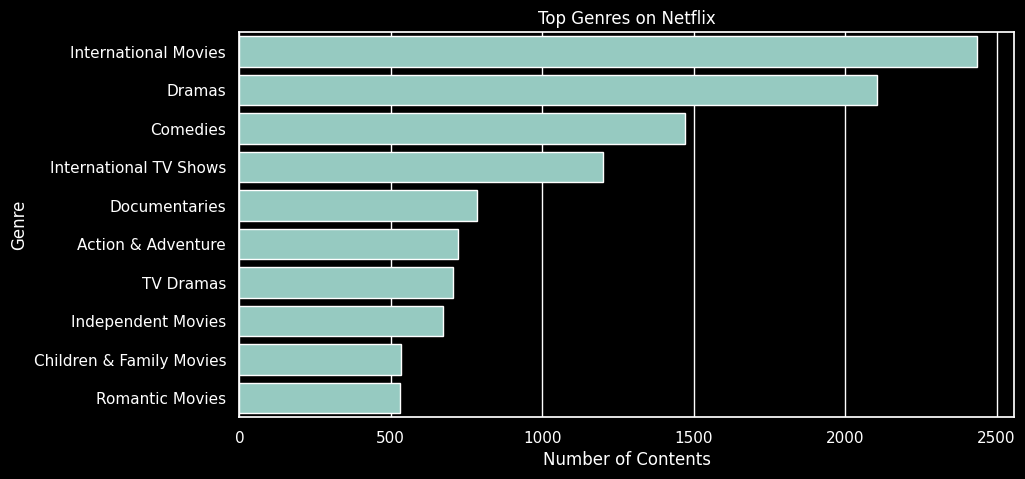
- 장르별 컨텐츠의 분포를 확인해보니 가장 인기 있는 장르는
'International Movies'국제 영화와'Dramas'드라마로 나타났디. 이는 넷플릭스가 국제적인 시청자를 대상으로 다양한 영화를 제공하고 있음을 시사한다.
(2) 국가별 컨텐츠 분석
# ▶ 국가별 컨텐츠 분석을 위한 준비: 'country' 열을 분리하고 카운트한다.
country_counts = Counter()
df['country'].dropna().str.split(', ').apply(country_counts.update)  # 결측치 제거 후 진행

# ▶ 가장 많은 컨텐츠를 생산한 국가 상위 10개를 추출한다.
top_countries = country_counts.most_common(10)

# ▶ 국가별 컨텐츠 시각화
plt.figure(figsize=(10, 5))
countries = pd.DataFrame(top_countries, columns=['Country', 'Count'])
sns.barplot(x='Count', y='Country', data=countries)
plt.title('Top Countries Producing Content on Netflix')
plt.xlabel('Number of Contents')
plt.ylabel('Country')
plt.show()
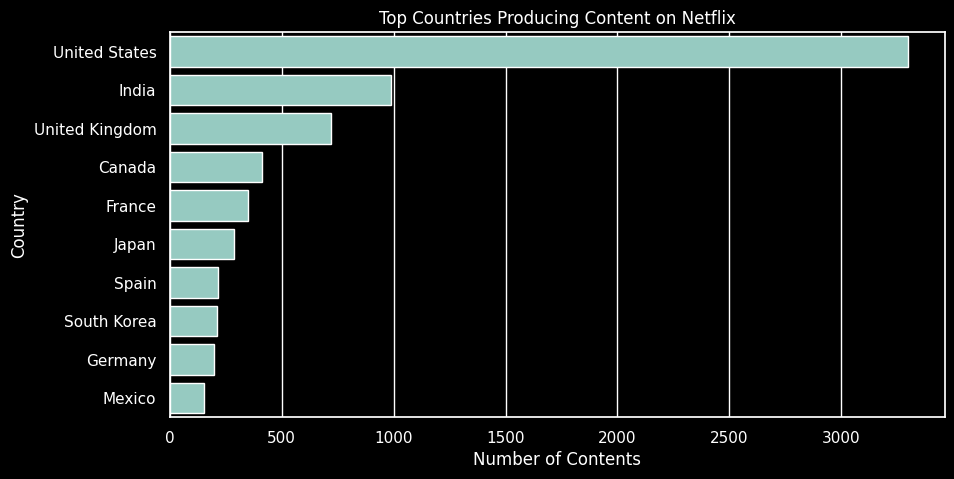
- 국가별로 제작된 컨텐츠의 비중을 확인해보니 미국이 가장 많은 컨텐츠를 생산한 국가로 나타나며, 인도와 영국이 그 뒤를 이었다. 이는 넷플릭스의 컨텐츠가 주로 이 세 국가에서 제작됐음을 확인할 수 있다.
(3) 시청자 컨텐츠 타입별 선호도 분석
# ▶ 시청자 선호도 분석을 위한 준비: 'rating' 열의 분포를 조사합니다.
rating_counts = df['rating'].value_counts()

# ▶ 출시 연도와 컨텐츠 인기도의 관계 분석을 위한 준비: 'release_year' 별 컨텐츠 수를 계산합니다.
release_year_counts = df['release_year'].value_counts().sort_index()

# ▶ 시청자 선호도(등급별) 시각화
plt.figure(figsize=(10, 5))
sns.barplot(x=rating_counts.values, y=rating_counts.index)
plt.title('Distribution of Content Ratings on Netflix')
plt.xlabel('Number of Contents')
plt.ylabel('Rating')
plt.show()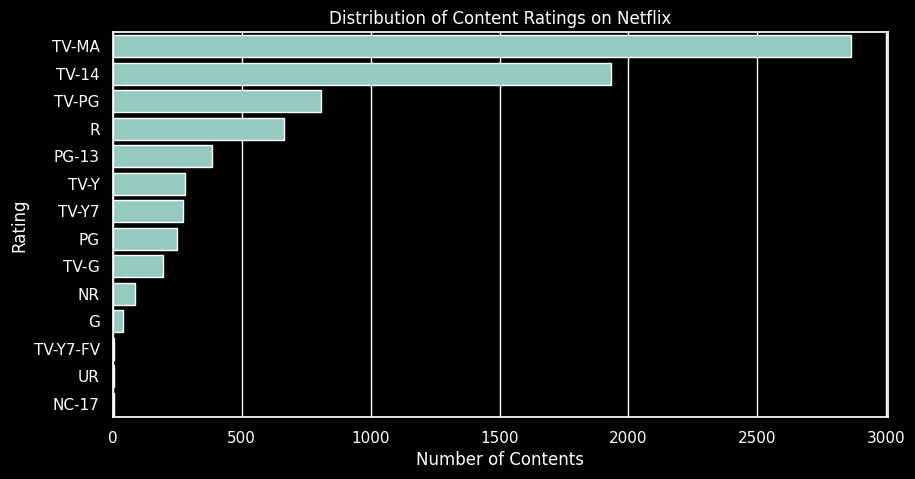
- 가장 많은 컨텐츠는
'TV-MA' (성인 대상)등급이며,'TV-14' (14세 이상 대상)등급이 그 뒤를 이어 두 번째 순서이다. 이는 넷플릭스가 성인 시청자를 주요 타겟으로 하고 있다고 해석할 수 있다.
(4) 넷플릭스의 컨텐츠 업데이트 추세 패턴
#▶  컨텐츠 업데이트 패턴 분석을 위한 준비: 'date_added' 열을 datetime으로 변환하고 연도별로 분석한다.
df['date_added'] = pd.to_datetime(df['date_added'], errors='coerce')
content_update_by_year = df['date_added'].dt.year.value_counts().sort_index()
content_update_by_year.index = content_update_by_year.index.astype(int)


# ▶ 출시 연도별 컨텐츠 시각화
# ▶ 연도별 컨텐츠 업데이트 패턴 시각화
plt.figure(figsize=(10, 5))
sns.barplot(x=content_update_by_year.index, y=content_update_by_year.values)
plt.title('Yearly Content Update Pattern on Netflix')
plt.xlabel('Year')
plt.ylabel('Number of Contents Added')
plt.xticks(rotation=45)
plt.show()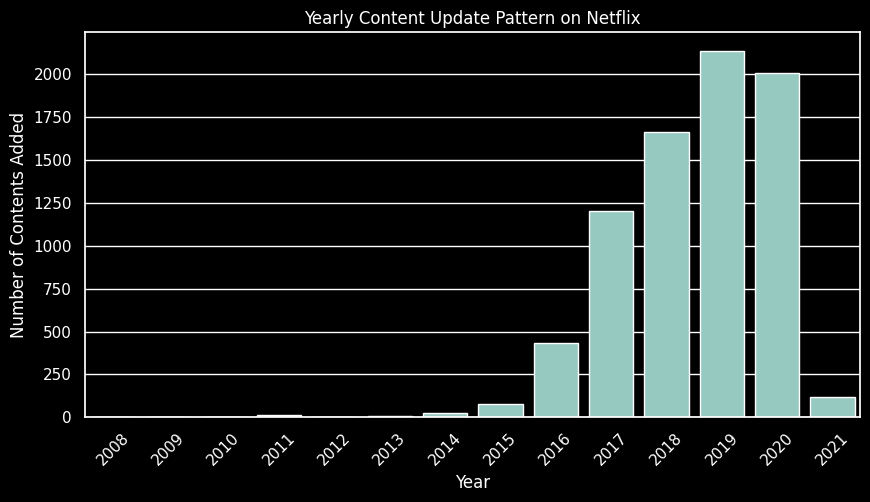
- 넷플릭스는 2016년 이후로 매년 더 많은 컨텐츠를 추가하고 있으며, 2019년에 가장 많은 컨텐츠를 제작했다.
- 그렇다면 2008~2021년의 기간동안 월별로는 컨텐츠가 몇 편이나 제작됐는지 알아보자.
넷플릭스 월별 컨텐츠 업데이트 분석
# ▶ 월별 컨텐츠 업데이트 패턴 시각화

df['date_added'] = pd.to_datetime(df['date_added'], errors='coerce')
content_update_by_month = df['date_added'].dt.month_name().value_counts()

plt.figure(figsize=(10, 5))
months_order = ['January', 'February', 'March', 'April', 'May', 'June', 'July',
                'August', 'September', 'October', 'November', 'December']
sns.barplot(x=content_update_by_month.index, y=content_update_by_month.values, order=months_order)
plt.title('Monthly Content Update Pattern on Netflix')
plt.xlabel('Month')
plt.ylabel('Number of Contents Added')
plt.xticks(rotation=45)
plt.show()
12월에 가장 많은 컨텐츠가 추가되었으며, 10월 1월에도 비슷한 수준이지만 상대적으로 다른 월에 비해 많은 컨텐츠가 추가된 것을 확인할 수 있다.
그래서 10월~내년도 1월까지 특히 연말에 컨텐츠 추가가 집중되는 경향이 있는 것으로 보인다. 이는 연말 시즌에 맞춘 콘텐츠 업데이트 전략을 반영할 수 있을 것으로 보인다.
결론
-
넷플릭스는 최근 몇 년 동안 급성장세를 보였으며 2016년을 시작으로 2020년까지 다수의 컨텐츠를 제작하고 있는 것을 확인했다.
-
12월에 가장 많은 컨텐츠가 추가되었으며, 10월 1월에도 비슷한 수준이지만 상대적으로 다른 월에 비해 많은 컨텐츠가 추가된 것을 확인할 수 있다.
-
그래서 10월~내년도 1월까지 특히 연말에 컨텐츠 추가가 집중되는 경향이 있는 것으로 보인다. 이는 연말 시즌에 맞춘 콘텐츠 업데이트 전략을 반영할 수 있을 것으로 보인다.
-
넷플릭스에서 제작된 컨텐츠들은 티비쇼보다는 영화 제작에 더 집중을 하고 있으며 컨텐츠는 대부분을 성인을 타깃으로 하는 컨텐츠를 제작한 것으로 보인다.
-
영화 컨텐츠의 제작 길이는 80분에서 120분 사이의 길이를 가지고 있어 극장 영화보다 짧은 시간의 길이를 가지고 있다.
-
아무래도 미국 회사다 보니 미국이 압도적으로 컨텐츠 제작이 많으며 그 다음은 영화산업이 발달 돼 있는 인도가 위치해 있으며 그 다음으로 영국, 일본이 뒤를 이었다. 이는 넷플릭스의 컨텐츠가 주로 이 세 국가에서 제작됐음을 확인할 수 있다.
- 장르별 컨텐츠의 분포를 확인해보니 가장 인기 있는 장르는
'International Movies'국제 영화와'Dramas'드라마로 나타났디. 이는 넷플릭스가 국제적인 시청자를 대상으로 다양한 영화를 제공하고 있음을 시사한다.