시계열 데이터 실전 분석
필요한 기본 코드
import pandas as pd
import pandas_datareader as web
import numpy as np
import matplotlib.pyplot as plt

from fbprophet import Prophet
from datetime import datetime

%matplotlib inline- pinkwink_web_Traffic.csv 파일이 있다는 기준이다.
pinkwink_web = pd.read_csv("../data/05_PinkWink_Web_Traffic.csv", encoding ="utf-8", thousands=",", names =["date","hit"], index_col=0)

pinkwink_web = pinkwink_web[pinkwink_web["hit"].notnull()]
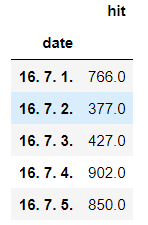
pinkwink_web.head()
다음과 같은 head를 볼 수 있다.
전체 데이터 그려보기
pinkwink_web["hit"].plot(figsize=(12, 4), grid=True);코드 뒤에 ; 표시가 있으면 정보를 보다 간략하게 표시해준다.
trend 분석을 시각화하기 위한 x축 값을 만들기
time= np.arange(0,len(pinkwink_web))
traffic = pinkwink_web["hit"].values
fx = np.linspace(0, time[-1], 1000)
에러를 계산할 함수
def error(f,x,y):
    return np.sqrt(np.mean((f(x)- y )**2))
에러와 trend를 이용한 지도
plt.figure(figsize =(12,4))
plt.scatter(time, traffic, s =10)
plt.plot(fx, f1(fx), lw=4, label ='f1')
plt.plot(fx, f2(fx), lw=4, label ='f2')
plt.plot(fx, f3(fx), lw=4, label ='f3')
plt.plot(fx, f15(fx), lw=4, label ='f15')

plt.grid(True, linestyle = "-", color ="0.75")
plt.legend(loc =2)
plt.show()
주식 데이터 fbprophet으로 분석하기
yahoo finance
필요한 기본 코드
from bs4 import BeautifulSoup
from urllib.request import urlopen, Request

url = "https://finance.yahoo.com/quote/035420.KS/history?p=035420.KS&guccounter=2"
req = Request(url, headers ={"User-Agent": "Chrome"})
page = urlopen(req).read()
soup = BeautifulSoup(page, "html.parser")
soup
table = soup.find("table")
df_raw = pd.read_html(str(table))[0] # str 형태로 가져와야함
df_raw.head()
fbprophet을 사용하는 형식에 맞춰준 뒤, 맨 마지막 NaN 값이 있어서 제외
df_tmp = pd.DataFrame({"ds":df_raw["Date"], "y": df_raw["Close*"]})
df_target = df_tmp[:-1]
df_target.head()
hardcopy 후, 날짜를 fbprophet이 요구하는 형태로 변형
df = df_target.copy()
df["ds"] = pd.to_datetime(df_target["ds"], format="%b %d, %Y")
df.head()
그래프 그리기
plt.figure(figsize=(12,6))
plt.plot(df["ds"], df["y"], label="real")
plt.grid(True)
plt.show()
m.plot_components(forecast);
위 함수를 통해 다양한 상황의 그래프를 표현할 수 있다.


