
지난번에는 MPAndroidChart 라이브러리의 CandleStickChart를 사용해서 기본적인 주식&코인 차트를 구현하는 방법에 대해 알아보았다.
오늘은 이전 포스팅에 이어서 CombinedChart를 활용하여 가격을 나타내는 캔들 차트와 이동평균선과 같은 메인 지표를 나타내는 라인 차트를 같이 그리는 방법에 대하여 이야기해보려고 한다.
이전 포스팅을 보지 않은 사람들은 먼저 보고 오는 것을 추천한다!
https://velog.io/@kimbsu00/Android-3
CombinedChart??
CombinedChart는 말그대로 여러개의 차트를 합친 차트이다.
CombinedChart를 사용해서 CandleStickChart와 LineChart를 합친 차트를 그리기 위해서는 다음과 같은 순서로 작업을 해주면 된다.
CombinedChart를 초기화 한다.CombinedChart에서 사용할 데이터CandleData와LineData를 만든다.CombinedData를 만들고, 이를 차트에 적용한다.
데이터 구조
CandleStickChart의 데이터 구조는 이전 포스팅에 자세히 나와있으니 참고하면 될 것 같다.
LineChart를 만드는데 필요한 데이터는 다음과 같다.
createdAt: x좌표
price: 가격
createdAt과 price는 모두 이전 포스팅의 Candle 데이터 클래스에 존재하는 데이터이므로, 추가로 데이터 클래스를 만들어줄 필요는 없다.
차트 그리기
xml
우선 Activity 또는 Fragment에 CombinedChart를 추가해준다
<?xml version="1.0" encoding="utf-8"?>
<LinearLayout xmlns:android="http://schemas.android.com/apk/res/android"
    xmlns:tools="http://schemas.android.com/tools"
    android:layout_width="match_parent"
    android:layout_height="match_parent"
    android:background="@color/main_background"
    android:orientation="vertical"
    tools:context=".FragmentChart">

    <com.github.mikephil.charting.charts.CombinedChart
        android:id="@+id/priceChart"
        android:layout_width="match_parent"
        android:layout_height="match_parent" />

</LinearLayout>
차트 초기화
그리고 차트를 초기화 해준다.
fun initChart() {
    binding.apply {
        priceChart.description.isEnabled = false
        priceChart.setMaxVisibleValueCount(200)
        priceChart.setPinchZoom(false)
        priceChart.setDrawGridBackground(false)
        // x축 설정
        priceChart.xAxis.apply {
            textColor = Color.TRANSPARENT
            position = XAxis.XAxisPosition.BOTTOM
            // 세로선 표시 여부 설정
            this.setDrawGridLines(true)
            axisLineColor = Color.rgb(50, 59, 76)
            gridColor = Color.rgb(50, 59, 76)
        }
        // 왼쪽 y축 설정
        priceChart.axisLeft.apply {
            textColor = Color.WHITE
            isEnabled = false
        }
        // 오른쪽 y축 설정
        priceChart.axisRight.apply {
            setLabelCount(7, false)
            textColor = Color.WHITE
            // 가로선 표시 여부 설정
            setDrawGridLines(true)
            // 차트의 오른쪽 테두리 라인 설정
            setDrawAxisLine(true)
            axisLineColor = Color.rgb(50, 59, 76)
            gridColor = Color.rgb(50, 59, 76)
        }
        setChartLegend(mainIndicatorType)
    }
}
여기까지 얼핏보면 이전 포스팅과 같아 보이지만, initChart()의 마지막 부분에 legend 구현하는 코드를 추가했다.
Legend 추가하기
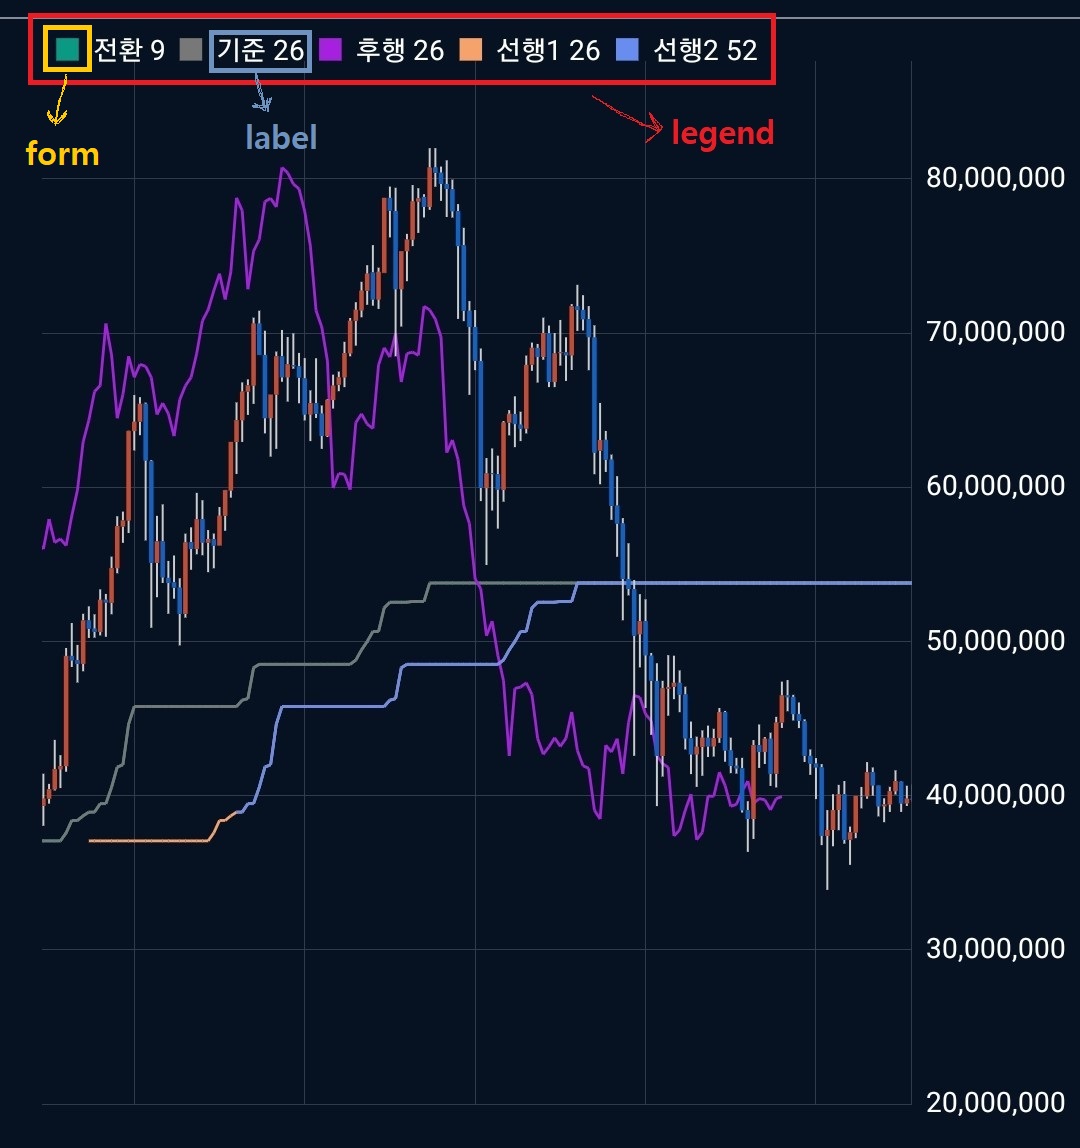
legend는 차트에 있는 지표들이 무엇을 의미하는지를 나타내는 것으로, 이번에는 메인 지표까지 함께 나타낼 예정이기에 legend도 추가하게 되었다.
setChartLegend() 함수는 사용자가 선택한 메인 지표에 따라 legend를 설정해주는 함수이다.
legend를 설정하는 방법은 다음과 같다.
fun setChartLegend(mainIndicatorType: Int) {
    val legendList: List<LegendEntry> = when (mainIndicatorType) {
        MainIndicator.MOVING_AVERAGE -> {
            binding.priceChart.legend.isEnabled = true
            val movingAverageLegend = LegendEntry()
            movingAverageLegend.label = "단순 MA"
            // form을 사용하지 않는 legend의 경우에는
            // form 값을 NONE으로 설정하면 된다.
            movingAverageLegend.form = Legend.LegendForm.NONE
            val averageN1Legend = LegendEntry()
            averageN1Legend.label = "5"
            averageN1Legend.formColor = Color.rgb(219, 17, 179)
            val averageN2Legend = LegendEntry()
            averageN2Legend.label = "10"
            averageN2Legend.formColor = Color.rgb(11, 41, 175)
            val averageN3Legend = LegendEntry()
            averageN3Legend.label = "20"
            averageN3Legend.formColor = Color.rgb(234, 153, 1)
            val averageN4Legend = LegendEntry()
            averageN4Legend.label = "60"
            averageN4Legend.formColor = Color.rgb(253, 52, 0)
            val averageN5Legend = LegendEntry()
            averageN5Legend.label = "120"
            averageN5Legend.formColor = Color.rgb(170, 170, 170)
            listOf(
                movingAverageLegend,
                averageN1Legend,
                averageN2Legend,
                averageN3Legend,
                averageN4Legend,
                averageN5Legend
            )
        }
    }
    binding.priceChart.legend.apply {
        // legend 데이터 설정
        setCustom(legendList)
        // legend 텍스트 컬러 설정
        textColor = Color.WHITE
        // legend의 위치를 좌측 상단으로 설정함
        verticalAlignment = Legend.LegendVerticalAlignment.TOP
        horizontalAlignment = Legend.LegendHorizontalAlignment.LEFT
        // 수평 방향으로 정렬함
        orientation = Legend.LegendOrientation.HORIZONTAL
        setDrawInside(true)
    }
}
데이터 추가
fun setChartData(candles: ArrayList<Candle>) {
    val priceEntries = ArrayList<CandleEntry>()
    for (candle in candles) {
        // 캔들 차트 entry 생성
        priceEntries.add(
            CandleEntry(
                candle.createdAt.toFloat(),
                candle.shadowHigh,
                candle.shadowLow,
                candle.open,
                candle.close
            )
        )
    }

    val priceDataSet = CandleDataSet(priceEntries, "").apply {
        axisDependency = YAxis.AxisDependency.LEFT
        // 심지 부분 설정
        shadowColor = Color.LTGRAY
        shadowWidth = 0.7F
        // 음봉 설정
        decreasingColor = Color.rgb(18, 98, 197)
        decreasingPaintStyle = Paint.Style.FILL
        // 양봉 설정
        increasingColor = Color.rgb(200, 74, 49)
        increasingPaintStyle = Paint.Style.FILL

        neutralColor = Color.rgb(6, 18, 34)
        setDrawValues(false)
        // 터치시 노란 선 제거
        highLightColor = Color.TRANSPARENT
    }

    binding.priceChart.apply {
        // CombinedData 만들어주고
        val combinedData = CombinedData()
        // CombinedData에 CandleData를 추가해주고
        combinedData.setData(CandleData(priceDataSet))
        // LineData 만들어주고
        val lineData = getMovingAverage(candles)
        // CombinedData에 LineData를 추가해주고
        combinedData.setData(lineData)
        // CombinedChart에 CombinedData를 적용시켜주면 된다.
        this.data = combinedData

        invalidate()
    }
}

// 이동평균선 데이터를 갖는 LineData를 리턴하는 함수
fun getMovingAverage(candles: ArrayList<Candle>): LineData {
    // 마지막에 리턴할 LineData 만들어주고
    val ret: LineData = LineData()

    val N1: Int = 5
    val N2: Int = 10
    val N3: Int = 20
    val N4: Int = 60
    val N5: Int = 120
    // LineChart에 추가할 데이터 == ArrayList<Entry> 생성해주고
    val averageN1Entries = ArrayList<Entry>()
    val averageN2Entries = ArrayList<Entry>()
    val averageN3Entries = ArrayList<Entry>()
    val averageN4Entries = ArrayList<Entry>()
    val averageN5Entries = ArrayList<Entry>()
    var count: Int = 0
    var sumN1: Float = 0.0f
    var sumN2: Float = 0.0f
    var sumN3: Float = 0.0f
    var sumN4: Float = 0.0f
    var sumN5: Float = 0.0f
    // 이동평균선 데이터를 계산하는 for loop
    // 데이터 생성은 Entry(createdAt, price) 로 하면 된다.
    for (candle in candles) {
        count++
        sumN1 += candle.close
        sumN2 += candle.close
        sumN3 += candle.close
        sumN4 += candle.close
        sumN5 += candle.close
        val now = candles.indexOf(candle)
        if (count >= N5) {
            averageN5Entries.add(
                Entry(
                    candle.createdAt.toFloat(),
                    sumN5 / N5.toFloat()
                )
            )
            sumN5 -= candles[now - (N5 - 1)].close
        }
        if (count >= N4) {
            averageN4Entries.add(
                Entry(
                    candle.createdAt.toFloat(),
                    sumN4 / N4.toFloat()
                )
            )
            sumN4 -= candles[now - (N4 - 1)].close
        }
        if (count >= N3) {
            averageN3Entries.add(
                Entry(
                    candle.createdAt.toFloat(),
                    sumN3 / N3.toFloat()
                )
            )
            sumN3 -= candles[now - (N3 - 1)].close
        }
        if (count >= N2) {
            averageN2Entries.add(
                Entry(
                    candle.createdAt.toFloat(),
                    sumN2 / N2.toFloat()
                )
            )
            sumN2 -= candles[now - (N2 - 1)].close
        }
        if (count >= N1) {
            averageN1Entries.add(Entry(candle.createdAt.toFloat(), sumN1 / N1.toFloat()))
            sumN1 -= candles[now - (N1 - 1)].close
        }
    }

    // for loop에서 만든 Entry들로 LineDataSet을 만들어준다.
    val averageN1DataSet = LineDataSet(averageN1Entries, "").apply {
        setDrawCircles(false)
        color = Color.rgb(219, 17, 179)
        highLightColor = Color.TRANSPARENT
        valueTextSize = 0f
        lineWidth = 1.0f
    }
    val averageN2DataSet = LineDataSet(averageN2Entries, "").apply {
        setDrawCircles(false)
        color = Color.rgb(11, 41, 175)
        highLightColor = Color.TRANSPARENT
        valueTextSize = 0f
        lineWidth = 1.0f
    }
    val averageN3DataSet = LineDataSet(averageN3Entries, "").apply {
        setDrawCircles(false)
        color = Color.rgb(234, 153, 1)
        highLightColor = Color.TRANSPARENT
        valueTextSize = 0f
        lineWidth = 1.0f
    }
    val averageN4DataSet = LineDataSet(averageN4Entries, "").apply {
        setDrawCircles(false)
        color = Color.rgb(253, 52, 0)
        highLightColor = Color.TRANSPARENT
        valueTextSize = 0f
        lineWidth = 1.0f
    }
    val averageN5DataSet = LineDataSet(averageN5Entries, "").apply {
        setDrawCircles(false)
        color = Color.rgb(170, 170, 170)
        highLightColor = Color.TRANSPARENT
        valueTextSize = 0f
        lineWidth = 1.0f
    }
    // LineData에 LineDataSet을 추가해준다.
    ret.addDataSet(averageN1DataSet)
    ret.addDataSet(averageN2DataSet)
    ret.addDataSet(averageN3DataSet)
    ret.addDataSet(averageN4DataSet)
    ret.addDataSet(averageN5DataSet)

    return ret
}
이동평균선 데이터를 계산하는 코드까지 포함하고 있어서 그런지 코드의 양이 생각보다 많아진 것 같다.
여기서 중요한건 CombinedData에 CandleData와 LineData를 setData()로 추가해주고, 이를 차트에 적용시키는 부분이므로, 그 부분만 잘 확인하면 될 것 같다.
마무리
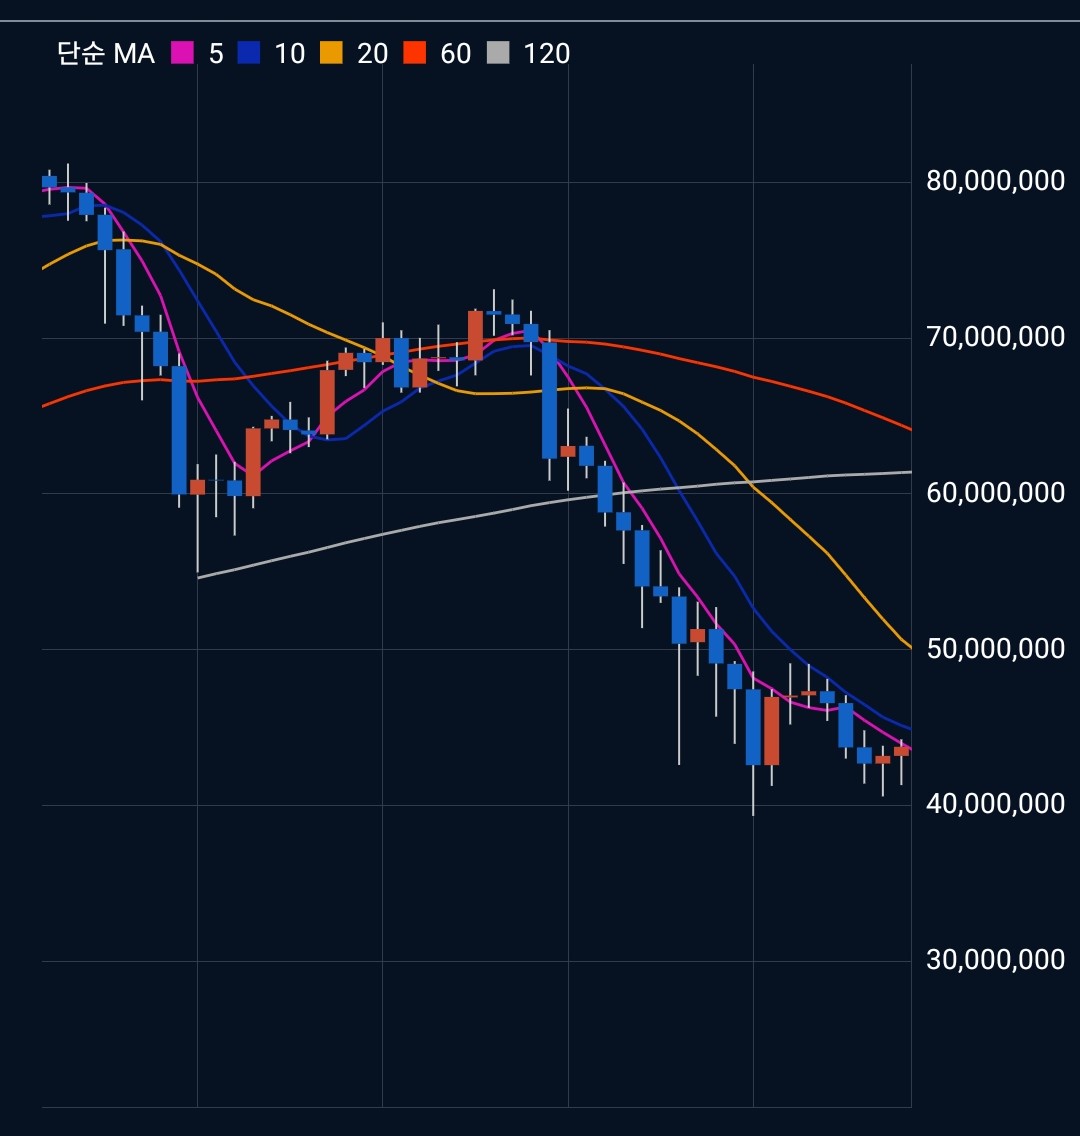
이렇게 하면 위의 이미지처럼 가격과 메인 지표가 잘 나타남을 확인할 수 있다.
또한 좌측 상단의 Legend도 의도한대로 적용됨을 확인할 수 있다.