모니터링의 중요성
- 어플리케이션을 개발 후, 안정적이고 효율적인 운영을 위한 모니터링은 필수적이다.
- 중요한 점은 시스템의 성능, 가용성, 안정성을 지속적으로 감시하면서, 잠재적인 문제를 발견해 이상 징후를 조기에 발견해 심각한 문제가 생기기전 해결하는 것이다.
모니터링의 범위
- 서버 모니터링: CPU, 메모리, 디스크 사용량, 네트워크 트래픽 등 서버 자원 사용을 모니터링
- 애플리케이션 모니터링: 애플리케이션의 상태, 성능, 로그 등을 모니터링
- 네트워크 모니터링: 네트워크 트래픽, 대역폭 사용량, 네트워크 지연 등을 모니터링
- 데이터베이스 모니터링: 쿼리 성능, 연결 수, 데이터베이스 사용량 등을 모니터링
- 보안 모니터링: 보안 이벤트, 침입 시도, 취약점 등을 모니터링
Spring Boot Actuator
- Spring Boot 애플리케이션의 상태와 성능을 모니터링하고 관리할 수 있도록 다양한 엔트포인트를 제공하는 기능이다.
Actuator 엔드포인트
- Actuator는 기본적으로 여러 엔드포인트를 제공합니다. 이러한 엔드포인트는 /actuator 경로 하위에 위치하며, 각각의 엔드포인트는 다양한 정보를 제공한다.
- /actuator/health: 애플리케이션의 상태를 확인
- /actuator/metrics: 애플리케이션의 메트릭 정보를 제공
- /actuator/loggers: 로깅 설정을 조회하고 변경
- /actuator/env: 환경 변수와 설정 정보를 확인
- /actuator/beans: 애플리케이션 컨텍스트에 있는 빈 목록을 확인
- /actuator/threaddump: 스레드 덤프를 확인
- /actuator/httptrace: 최근 HTTP 요청 및 응답을 추적
spring:
  application:
    name: practice

server:
  port: 8080

#모든 엔드포인트 노출 설정
management:
  endpoints:
    web:
      exposure:
        include: *
  endpoint:
    #헬스 체크 엔드포인트 상세 정보 표시 설정
    health:
      show-details: always # 기본값은 never
주의 사항
- 운영 환경에서는 필요한 엔트포인트만 노출시켜야 한다.
show-details설정을when_authorized옵션을 통해서 인증된 사용자에게만 제공하는 옵션을 사용하는 것이 좋다.- 또는 acutuator 접근 포트만 다른 포트로 설정해 보호할 수 있다.
# 애플리케이션의 기본 포트를 8080으로 설정
server.port=8080

# Actuator 엔드포인트를 19090 포트에서 서비스하도록 설정
management.server.port=19090- 아니면 Spring Security 에서 엔드포인트 접근 제어를 사용해도 괜찮을 것 같다.
Prometheus
- Prometheus 서버:
- 메트릭 데이터를 수집하고 저장하는 핵심 컴포넌트로 각 타겟으로부터 데이터를 주기적으로 스크랩(scrape)하여 시계열 데이터베이스에 저장한다.
- 시계열 데이터베이스(Time Series Database, TSDB)는 시간에 따라 변화하는 데이터를 효율적으로 저장하고 조회할 수 있도록 최적화된 데이터베이스
- 메트릭 데이터를 수집하고 저장하는 핵심 컴포넌트로 각 타겟으로부터 데이터를 주기적으로 스크랩(scrape)하여 시계열 데이터베이스에 저장한다.
- Exporters:
- Prometheus는 기본적으로 애플리케이션에서 메트릭 데이터를 수집한다.
- Exporter는 특정 애플리케이션이나 시스템의 메트릭 데이터를 Prometheus가 이해할 수 있는 형식으로 변환해주는 도구이다.
- 예시: Node Exporter (서버의 시스템 메트릭 수집), PostgreSQL Exporter (PostgreSQL 메트릭 수집), Spring boot의 micrometer-registry-prometheus 디펜던시
- Pushgateway:
- 짧은 수명의 작업(job)에서 메트릭을 수집하여 Prometheus 서버에 푸시(push)할 수 있다.
- 일반적으로 지속적으로 실행되지 않는 작업에서 사용된다. 예를 들어 배치 작업, 스크립트 실행, 크론 작업 등이 있다.
- Alertmanager:
- Prometheus 서버에서 발생하는 경고(alert)를 처리하고, 이메일, PagerDuty, Slack 등 다양한 방법으로 알림을 보낼 수 있다.
- Grafana:
- Prometheus 데이터를 시각화하기 위해 자주 사용되는 대시보드 도구
- Grafana를 사용하면 Prometheus에서 수집한 메트릭 데이터를 대시보드 형태로 시각화할 수 있다.
management:
  endpoints:
    web:
      exposure:
        include: *
  endpoint:
    #헬스 체크 엔드포인트 상세 정보 표시 설정
    health:
      show-details: always
    # 이 설정은 /actuator/health 엔드포인트에서 헬스 체크 정보를 항상 상세히 보여주도록 설정합니다. 기본적으로, 헬스 체크 엔드포인트는 요약된 상태 정보만 제공하며, 상세 정보는 노출되지 않습니다.
    prometheus:
      enabled: true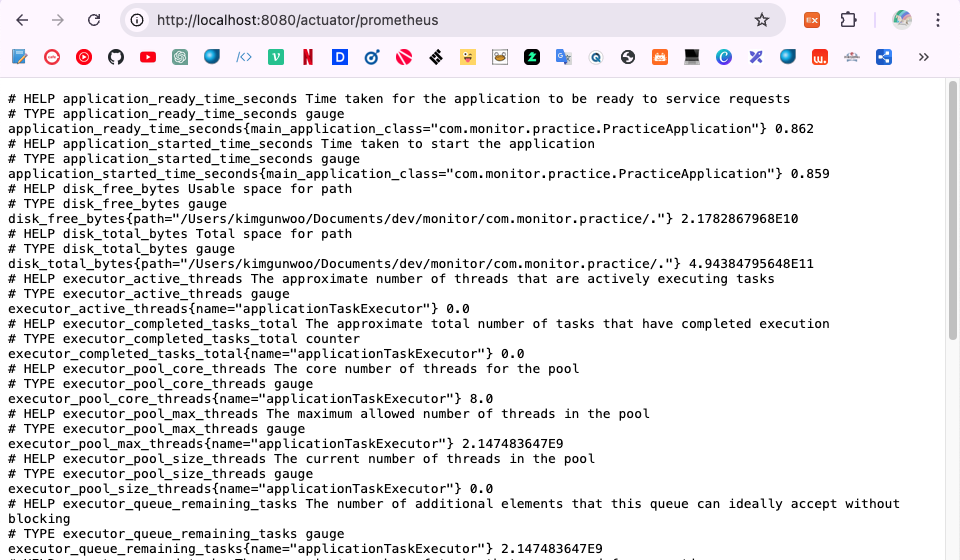
해당 엔드포인트로 접근하면 매트릭스를 확인할 수 있다.
prometheus.yml
global:
  scrape_interval: 15s # 메트릭 수집 간격

scrape_configs:
  - job_name: 'spring-boot'
    metrics_path: '/actuator/prometheus'
    static_configs:
      - targets: ['host.docker.internal:8080']
15초 간격으로 /actuator/premetheus 엔트포인트에서 메트릭을 수집하는 옵션입니다.
targets 에서 host.docker.internal 는 Docker 에서 제공하는 특수한 DNS 이름으로, Docker 컨테이너가 호스트 머신(즉, Docker 를 실행하는 컴퓨터)의 네트워크 서비스에 접근할 수 있게 한다.
이를 통해 컨테이너 내부에서 호스트 머신의 네트워크 주소를 참조할 수 있다.
docker-compose.yml
version: '3.8'

services:
  prometheus:
    image: prom/prometheus
    container_name: prometheus
    ports:
      - "9090:9090"
    volumes:
      - ./prometheus.yml:/etc/prometheus/prometheus.yml
추후 다른 설정도 추가하기 위해 docker-compose 파일로 작성했다.
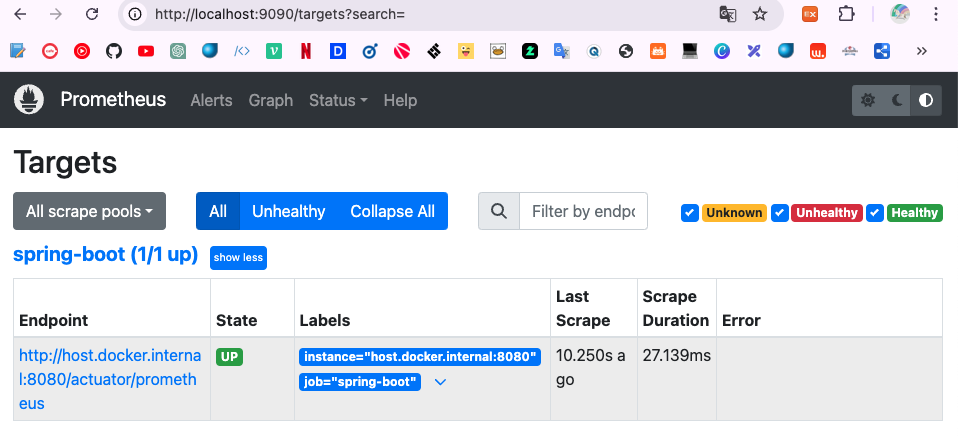
다음처럼 localhost:9090 으로 접속하면 프로메테우스 서버에 접속할 수 있다.
Status -> Target 로 접속하면 스프링 애플리케이션 매트릭스를 수집하고 있는 것을 확인할 수 있다.
Grafana
- 오픈소스 데이터 시각화 및 모니터링 도구이다.
- 다양한 데이터 소스를 지원하여 데이터를 시각화하고 분석할 수 있도록 돕는다.
- 대시보드를 생성하고, 데이터를 그래프나 차트 형태로 표현하며, 알림 기능을 제공해 모니터링을 강화할 수 있다.
주요기능
- 대시보드 생성:
- Grafana는 사용자가 데이터를 시각화할 수 있는 대시보드를 생성할 수 있도록 한다. 여러 가지 그래프, 차트, 게이지 등을 사용하여 데이터를 시각적으로 표현할 수 있다.
- 다양한 데이터 소스 지원:
- Prometheus, InfluxDB, Graphite, Elasticsearch, MySQL, PostgreSQL 등 다양한 데이터 소스를 지원한다. 이를 통해 여러 시스템과 애플리케이션의 데이터를 통합하여 시각화할 수 있다.
- 알림 기능:
- 조건을 설정하여 조건이 충족되면 이메일, Slack, PagerDuty 등 다양한 채널을 통해 알림을 보낼 수 있다. 이를 통해 시스템 상태를 실시간으로 모니터링하고 문제가 발생했을 때 즉시 대응할 수 있다.
- 플러그인 지원:
- Grafana는 플러그인 아키텍처를 지원하여, 다양한 플러그인을 통해 기능을 확장할 수 있다. 예를 들어, 새로운 데이터 소스나 시각화 유형을 추가할 수 있다.
- 사용자 관리:
- 사용자를 관리하고, 대시보드와 데이터 소스에 대한 접근 권한을 설정할 수 있다. 이를 통해 팀 내에서 협업을 강화하고 데이터 보안을 유지할 수 있다.
version: '3.8'

services:
  prometheus:
    image: prom/prometheus
    container_name: prometheus
    ports:
      - "9090:9090"
    volumes:
      - ./prometheus.yml:/etc/prometheus/prometheus.yml

  grafana:
    image: grafana/grafana
    container_name: grafana
    ports:
      - "3000:3000"
    depends_on:
      - prometheus
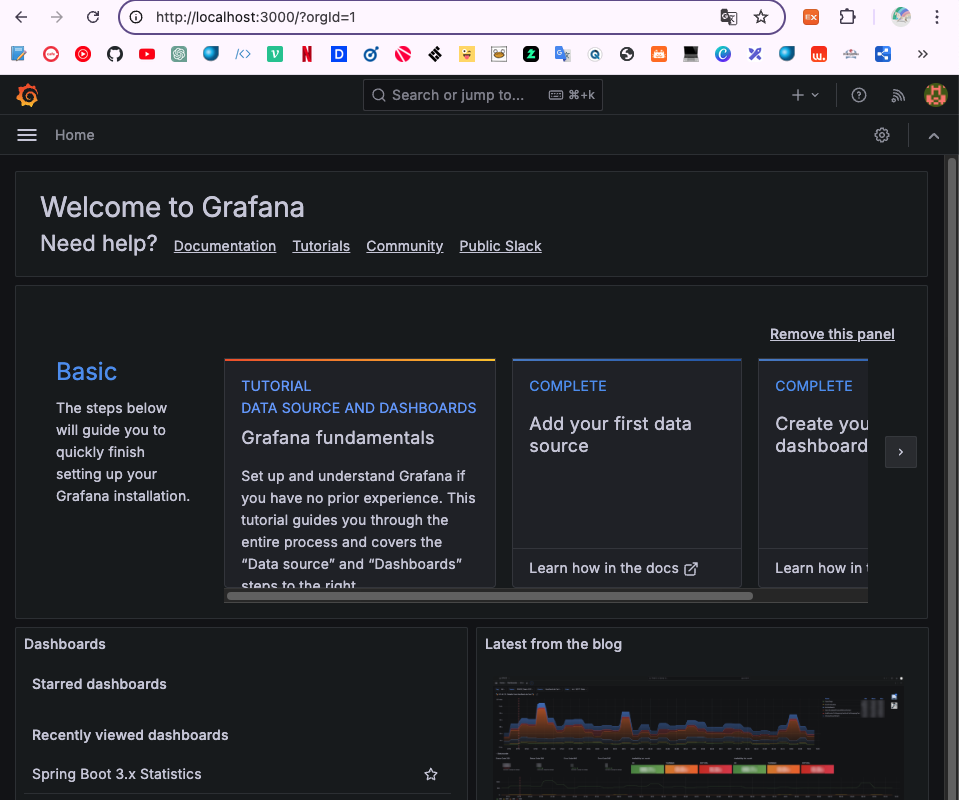
localhost:3000 으로 접속하면 기본 계정 admin/admin 으로 접속할 수 있다.
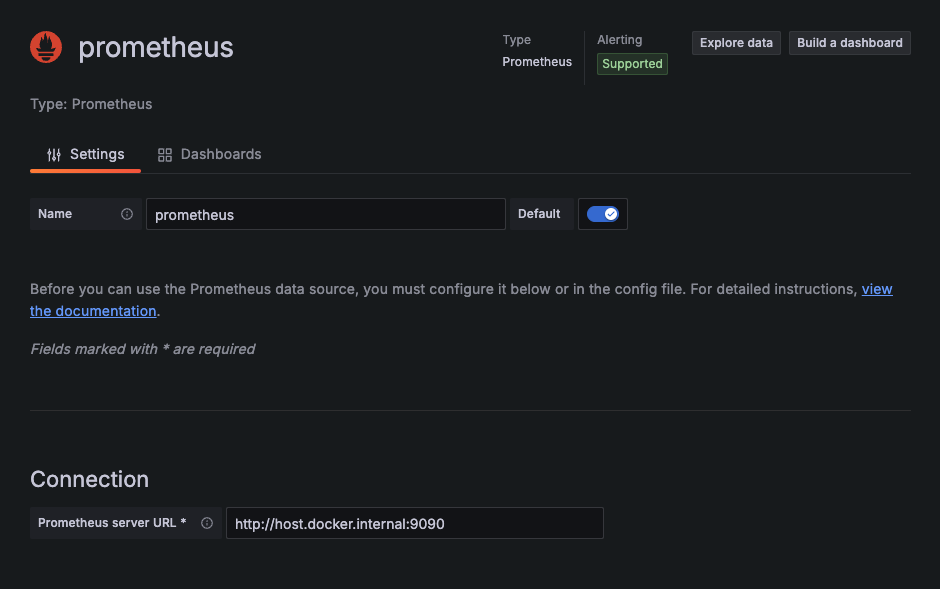
datasource 에서 prometheus 를 등록할 수 있고,
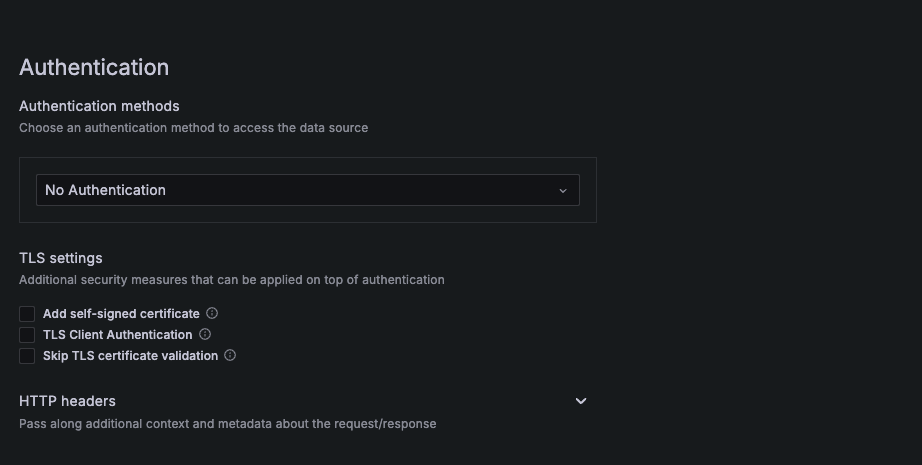
추후 운영상황에서 적용할 보안설정이나, 여러 추가 설정또한 존재한다. 현재는 연습용이기에 연결만 적용.
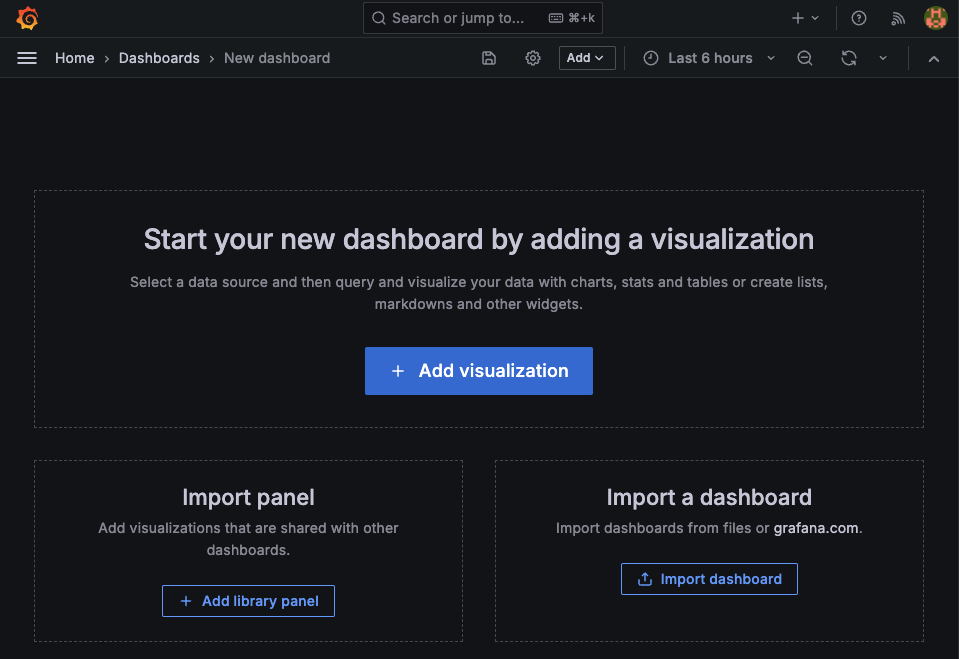
다음으론 그라파나의 대시보드 생성을 확인해보면, grafana.com 으로 접속해서 제공하고있는 여러 템플릿을 확인해볼 수 있다.
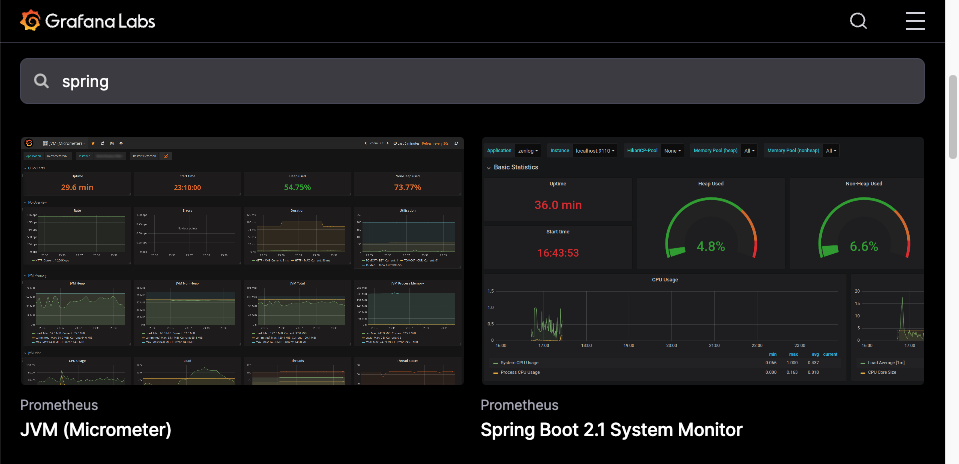
접속해서 확인해보면 이런식으로 이미 잘 구성해놓은 대시보드들이 존재한다.
JVM, spring, jdbc, kafka, rabbitMQ, mysql, ... 등등 여러 잘만들어진 대시보드들을 제공하고 있기에 잘 가져다 쓰기만 하면 된다!
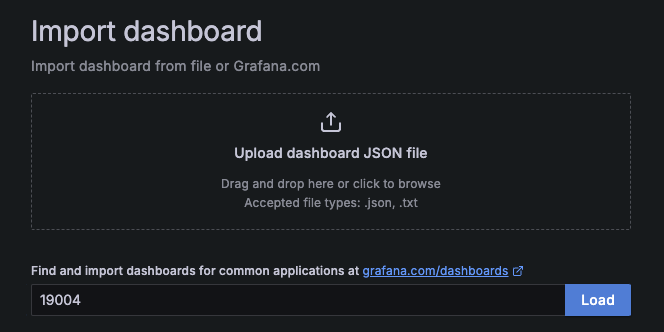
카피해서 붙여넣기하고, prometheus로 설정하면 대시보드가 잘 생성된다.
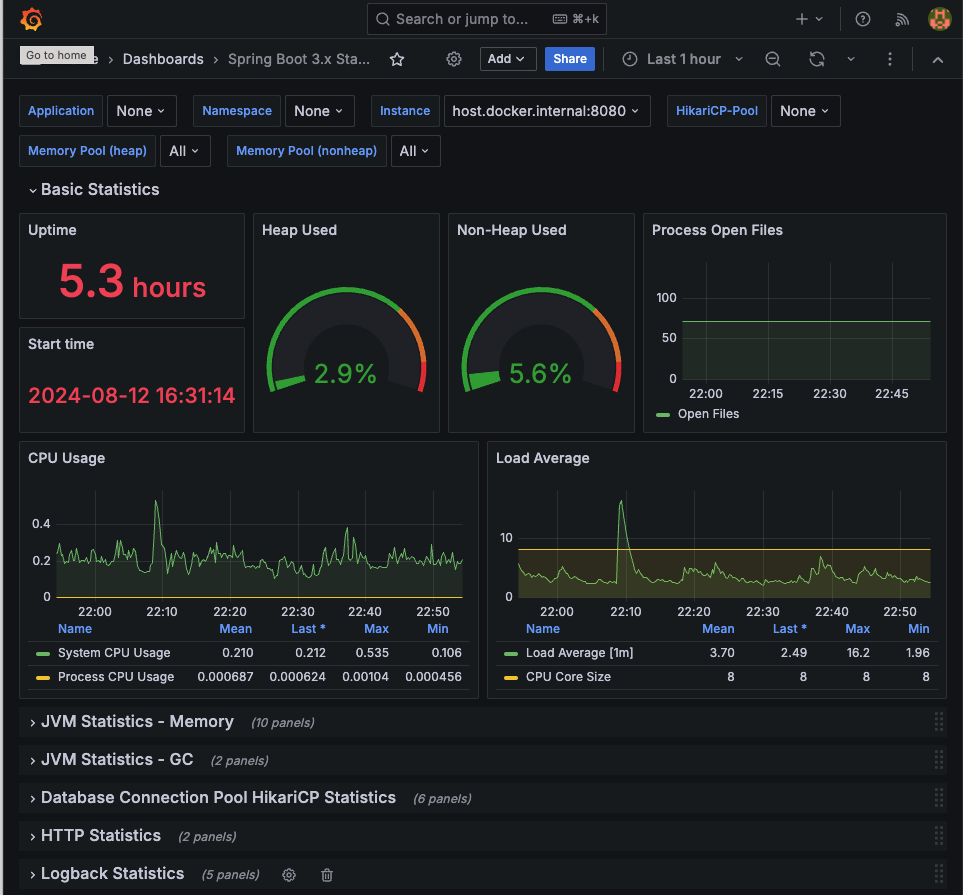
uptime, cpu 사용률, 메모리, GC, db connection, http, logback 등 엄청나게 다양한 메트릭을 대시보드로 제공해준다. 해당 값들을 확인해서 조정하는 부분은 아직 공부가 필요한 것 같다..
Slack api
이번엔 그라파나를 슬랙과 알림을 연동해보자.
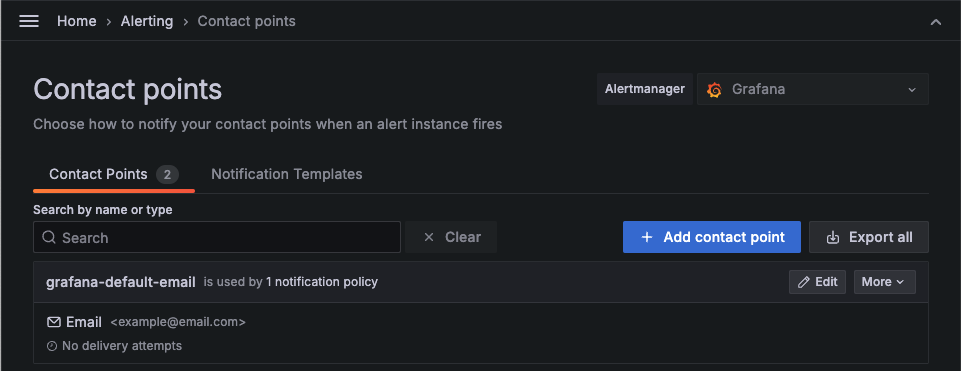
기본 Alerting -> Contact points 로 접속해면 기본 email로 알림이 설정되어있다.
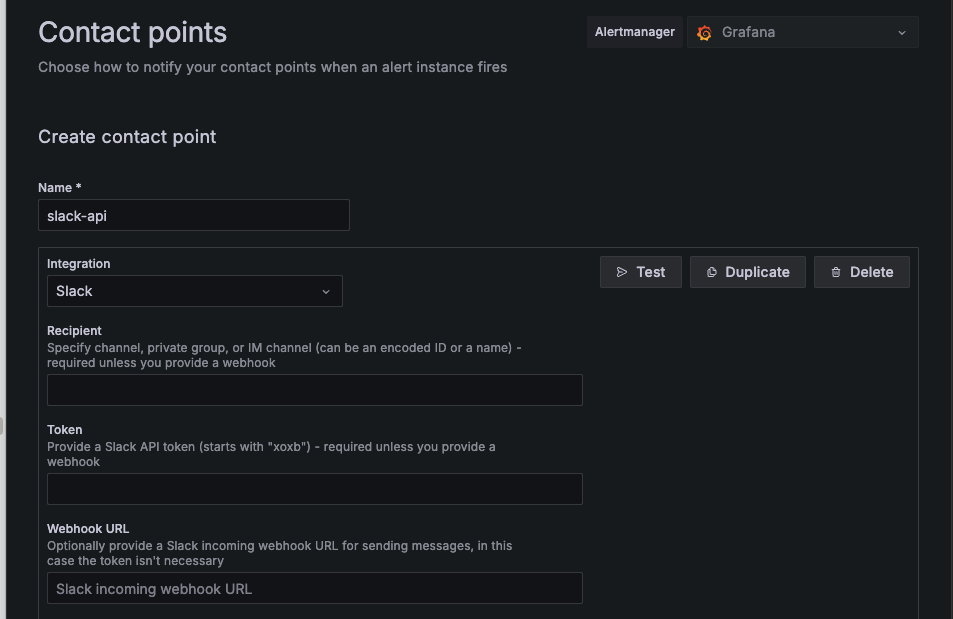
여기서 생성을 통해 slack을 설정하고, webhook을 등록해주면 된다.
(slack api webhook 생성은 생략)
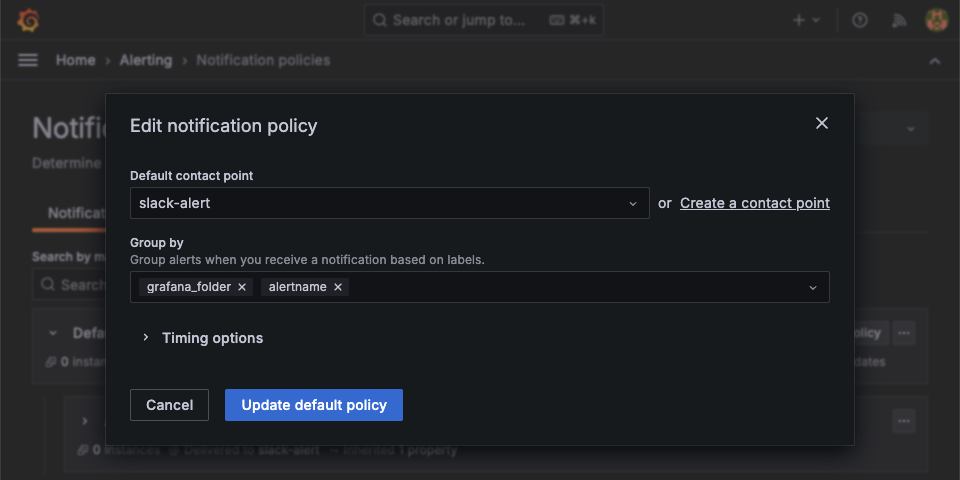
다음으로 Alerting > Notification policies 에서 Default policy의 edit 을 통해 기본 설정을 내가 만든 slack 알림으로 설정해준다.
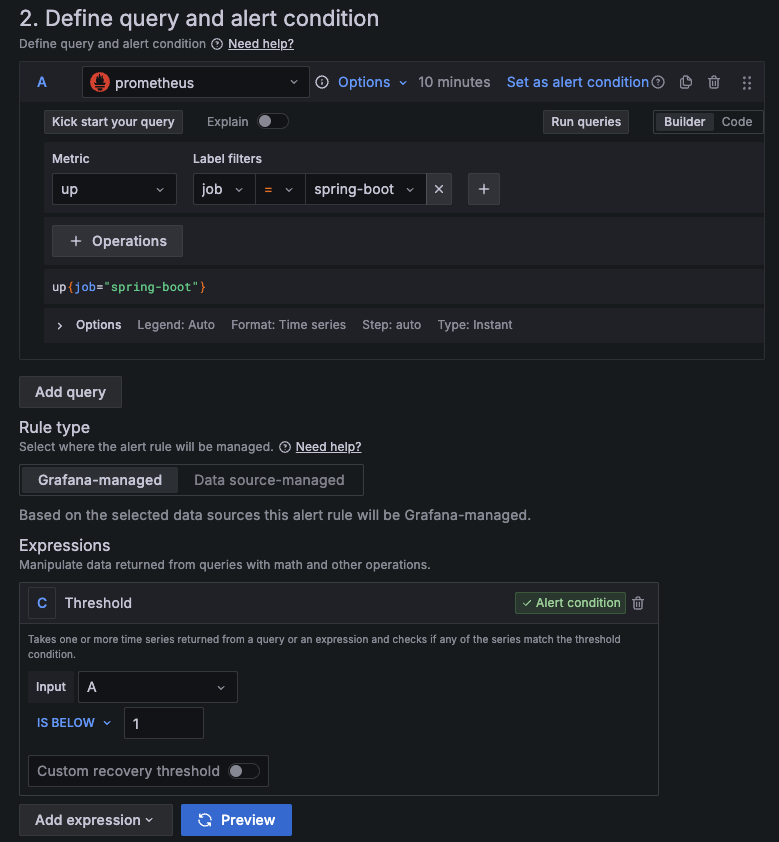
그다음 Alerting > Alert rules > New alert rule 에 들어가서 Metric은 up Label filters 는 job에 spring-boot 로 설정해준다. 그리고 Threshold Input 타입을 A로, IS BELOW 는 1로 설정해준다면, 스프링부트 어플리케이션이 정지되는 순간 알림을 보낼 수 있다.
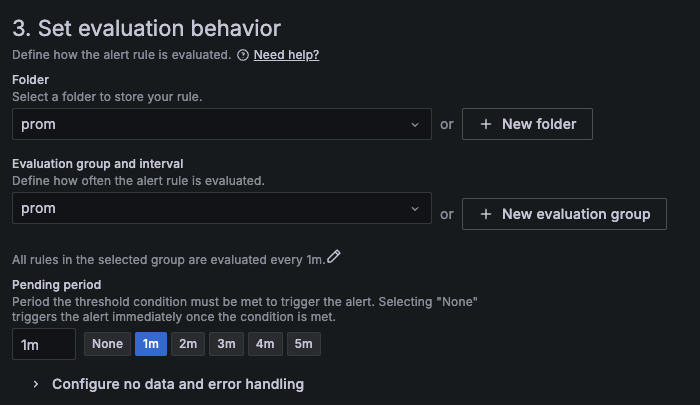
또한 다음 설정을 통해 1m 으로 설정해주면 springboot의 상태를 1분마다 확인하는 옵션을 설정한다.
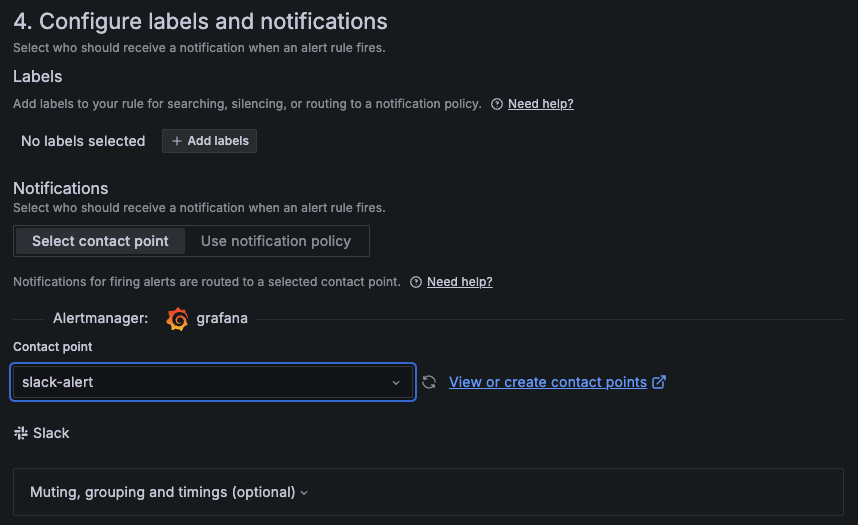
최종 알림을 내가 만든 slack-alert로 설정해주면 스프링부트 애플리케이션이 중지되고, 실행될 때 마다 알림을 발송하게 된다.
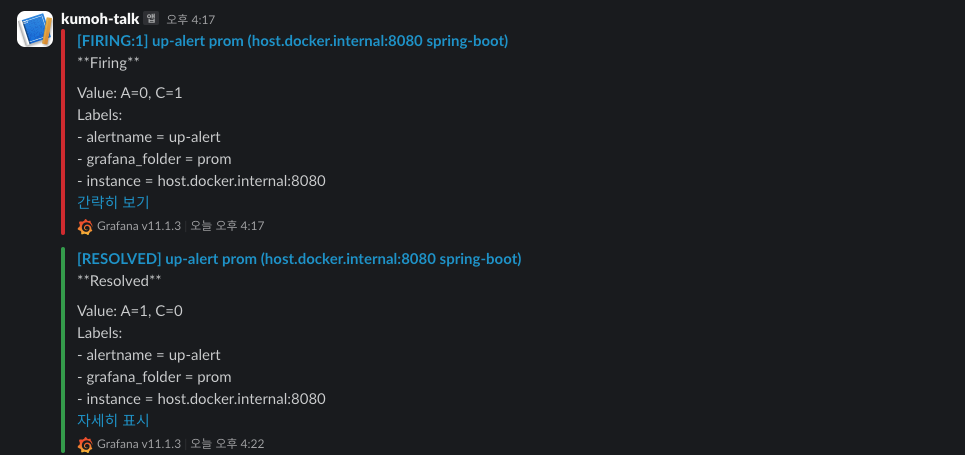
이처럼 알림을 확인해 볼 수 있다.
지금은 서버가 다운되었을 때를 확인해보았는데, 만약 운영 상태라면 서버가 죽었다면 이미 너무 늦은 알림이 아닐까 싶다.. 서버가 죽기전에 여러 메트릭에 대해 한계점을 설정해 해당 값이 넘게되면 경고 알림을 계속 보내도록 하는게 더 효율적일 것 같다.
Loki
- Garafana Labs 에서 개발한 로그 집계 시스템으로, Prometheus의 메트릭 수집 방식과 유사하게 로그 데이터를 수집하고 쿼리할 수 있도록 설계되었다.
- 주로 로그 데이터를 저장하고, 이를 Grafana를 통해 시각화하는 데 사용된다.
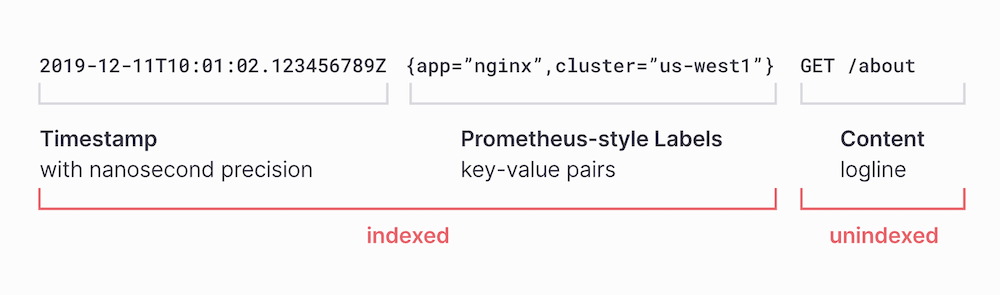
- Loki의 주요 특징 중 하나는 라벨 기반의 메타데이터를 사용해 로그를 효율적으로 검색할 수 있다는 점이다.
loki-logback-appender
- Logback을 사용하는 Java 애플리케이션에서 로그를 Loki로 직접 전송하기 위한 라이브러리이다.
- 이 라이브러리를 사용하면 별도의 Promtail 설정 없이도 로그를 Loki로 전송할 수 있다.
- Promtail : 모니터링이 필요한 로컬 머신에서 Loki instance 에 로컬 로그를 푸시하는 agent
여튼 별도의 agent 설정 필요없이 쉽게 로그를 Loki로 전송할 수 있게하는 라이브러리이다.
Spring boot 설정
dependency
implementation 'com.github.loki4j:loki-logback-appender:1.5.1'controller
    @GetMapping("/")
    public String hello(HttpServletResponse response) throws IOException {
        logger.info("Attempted access to / endpoint resulted in 403 Forbidden");
        response.sendError(HttpServletResponse.SC_FORBIDDEN, "Access Denied");
        return null;
    }
logback.xml
<configuration>
    <appender name="LOKI" class="com.github.loki4j.logback.Loki4jAppender">
        <http>
            <url>http://localhost:3100/loki/api/v1/push</url>
        </http>
        <format>
            <label>
                <pattern>app=my-app,host=${HOSTNAME}</pattern>
            </label>
            <message class="com.github.loki4j.logback.JsonLayout" />
        </format>
    </appender>

    <root level="DEBUG">
    <appender-ref ref="LOKI" />
    </root>
</configuration>
loki-config.yml
auth_enabled: false

server:
  http_listen_port: 3100
  grpc_listen_port: 9096

common:
  instance_addr: 127.0.0.1
  path_prefix: /tmp/loki
  storage:
    filesystem:
      chunks_directory: /tmp/loki/chunks
      rules_directory: /tmp/loki/rules
  replication_factor: 1
  ring:
    kvstore:
      store: inmemory

query_range:
  results_cache:
    cache:
      embedded_cache:
        enabled: true
        max_size_mb: 100

schema_config:
  configs:
    - from: 2020-10-24
      store: tsdb
      object_store: filesystem
      schema: v13
      index:
        prefix: index_
        period: 24h

ruler:
  alertmanager_url: http://localhost:9093

# By default, Loki will send anonymous, but uniquely-identifiable usage and configuration
# analytics to Grafana Labs. These statistics are sent to https://stats.grafana.org/
#
# Statistics help us better understand how Loki is used, and they show us performance
# levels for most users. This helps us prioritize features and documentation.
# For more information on what's sent, look at
# https://github.com/grafana/loki/blob/main/pkg/analytics/stats.go
# Refer to the buildReport method to see what goes into a report.
#
# If you would like to disable reporting, uncomment the following lines:
#analytics:
#  reporting_enabled: false
위 설정은 Loki 공식 페이지에서 제공하는 방법이다.
다음 링크로 접속하면 바로 복/붙 가능하다.
https://raw.githubusercontent.com/grafana/loki/v3.0.0/cmd/loki/loki-local-config.yaml
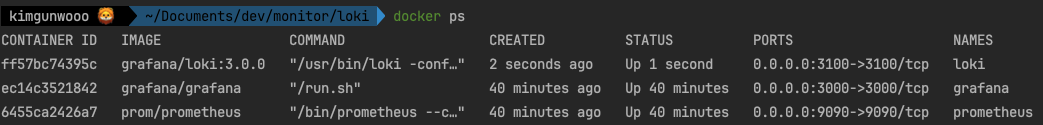
docker run --name loki -d -v ${loki-config.yml 이 저장된 폴더}:/mnt/config -p 3100:3100 grafana/loki:3.0.0 -config.file=/mnt/config/loki-config.ymlloki-config.yml 파일이 프로메테우스 설정 파일과 다른 폴더에 존재해서 그냥 docker run 명령어로 실행시켰다.
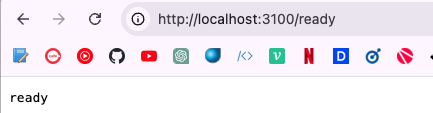
다음 엔트포인트로 접속하면 상태를 확인할 수 있다.
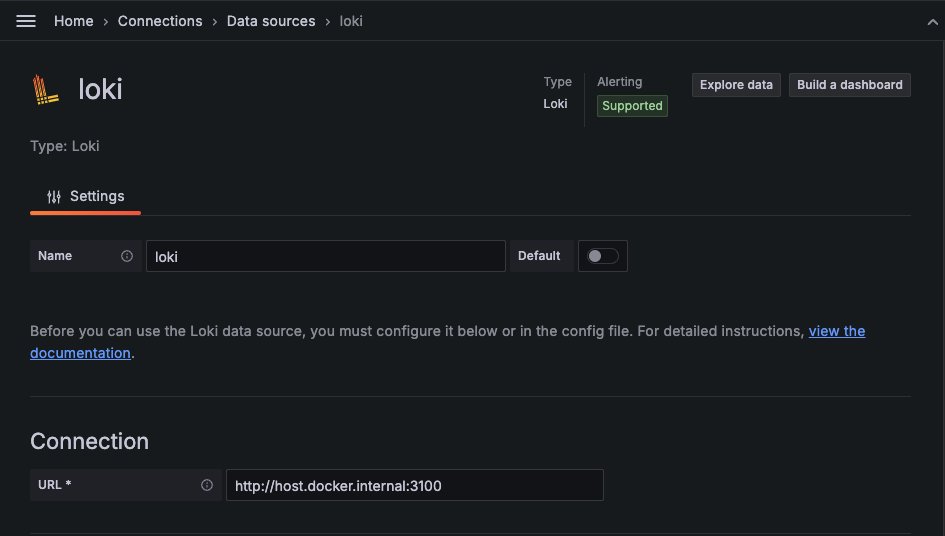
이번엔 그라파나에서 loki 를 연결시켜 보자.
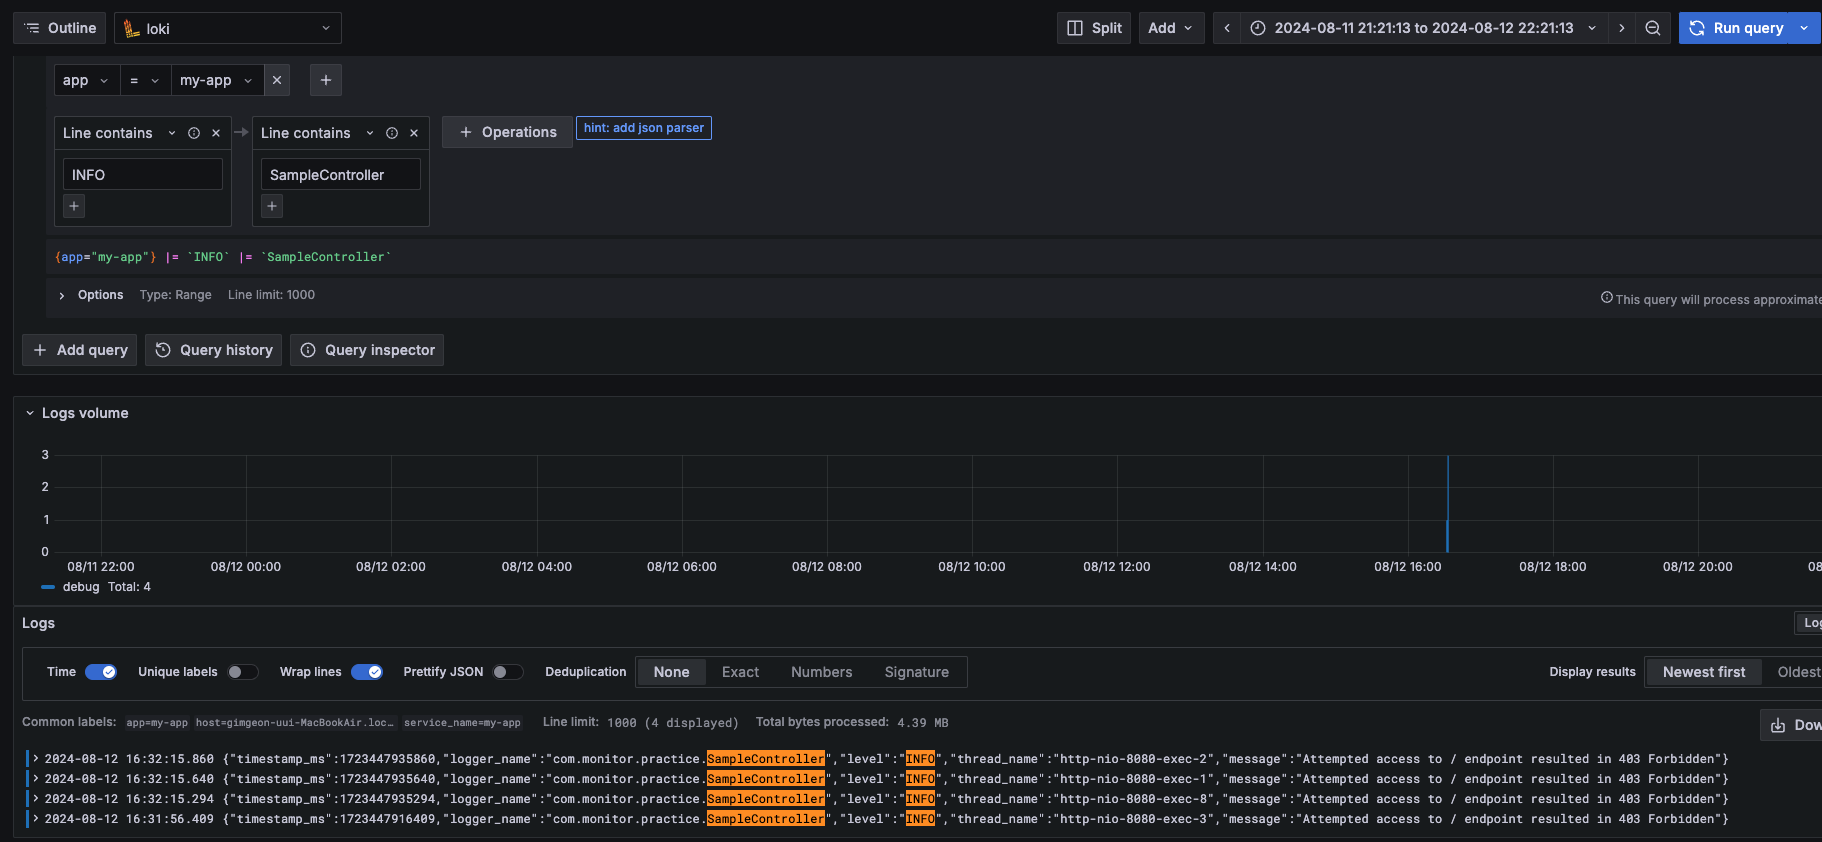
Explore 페이지에서 Loki 선택해서 app -> my-app Line filters에 Line Contains 를 통해서 로그의 필터를 적용할 수 있다.
위 그림에서처럼 controller 에서 발생한 로그를 필터링을 통해 확인할 수 있다.
마무리
Prometheus, Grafana 는 굉장히 많이 들어본 모니터링 툴이였는데, 이번에 써보니까 확실히 사람들이 많이 사용함에 있어서 자료도 많고, 대시보드 템플릿도 다양하게 제공하고 있었다.
오픈소스라 그런지 확실히 참고할 자료도 많고, 사용하기도 쉬웠다.
Loki는 이번에 처음 듣고, 사용해보았다.
일반적으로 로그를 수집하고 활용하는 시스템은 Elasticsearch를 중심으로 ELK(Elasticsearch, Logstash, Kibana) 가 일반적으로 사용된다.
하지만, Elasticsearch 를 사용하면 그만큼 시스템 요구사항과 관리가 필요하고, 클러스터의 크기가 증가할수록 관리 비용도 증가하게 된다.
그에비해 Grafana Labs에서 정의한 Loki의 특징은
- 수평 확장
- 고가용성 지원
- Muti-tenancy
- 쉽고 효율적인 운영
이러한 장점으로 k8s 상에 설치해서 사용하기에도 용이하다.
또한 메타정보만 인덱스하도록 강제되어 있기에, 전체 설정을 통해 구성하는 elasticsearch에 비해 빠르고 간결해 적은 저장소를 필요로 하는 장점이 있다.
(하지만, 전체 탐색에 있어서는 elasticsearch 보다 느리다.)
또한 이번에 사용한 것 처럼 Spring Boot에 좋은 라이브러리가 존재하기에 연동하기도 쉽다.
2023 년 글에 의하면 배민에서도 ELK Stack에서 Loki로 전환했다고 한다!!
확실히 요즘엔 k8s 가 유행하면서 해당 환경에서 적합한 기술들이 각광받고 있는 것 같다.
