[python/matplotlib] Pairwise Comparison 표시하기
Pairwise Comparision의 결과를 위와 같이 깔끔하게 보여주기 위해서 함수를 만들었다.
def pairwise_marker(x1, x2, y, h, s, ax=None, lw=1, color='black', fs=16, ha='center', va='bottom'):
'''Draw a marker of a significance of pairwise comparison
Args:
x1 (float): x where a indicating line starts (left side)
x2 (float): x where a indicating line ends (right side)
y (float) : y
h (float) : the length of feet
ax (AxesSubplot) : plot. `None` in default.
lw (float) : line width
color(str) : color
fs(float) : 16
ha(str) : 'center' is recommended.
va(str) : 'bottom' or 'baseline' is recommended.
'''
if not ax: ax = plt
ax.plot([x1, x1, x2, x2], [y-h, y, y, y-h], lw=lw, c=color)
ax.text((x1+x2)/2, y, s, fontsize=fs, ha=ha, va=va)
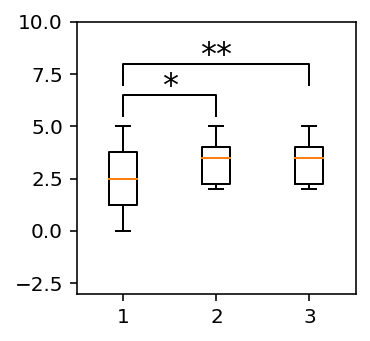
a = [0, 1, 2, 3, 4, 5]
b = [2, 2, 3, 4, 5, 4]
c = [2, 2, 3, 4, 5, 4]
plt.figure(figsize=(2.5, 2.5), dpi=144)
plt.boxplot([a, b, c])
pairwise_marker(1, 2, 6.5, 1, "*", va='baseline')
pairwise_marker(1, 3, 8, 1, "**", va='baseline')
plt.ylim(-3,10)
plt.show()