개요
Kaggle의 과거 대회 중 Prudential USA(?)가 Host로서 주최한 Prudential Life Assessment라는 것이 있다.
대회 링크
머신러닝을 본격적으로 배우기 앞서, K-Digital Training의 과제로 이 대회의 데이터에 대해 EDA를 해보고자 한다.
작업은 Google Colab에서 진행하였다.
목차
- Library Import and Setting
- Data Import
- Data Analysis
(1) 데이터 개요
(2) 결측 컬럼 처리
(3) Continuous Variables
(4) Categorical Variables - 결론
1. Library Import and Setting
# google drive를 colab에 마운트하기 위한 import
from google.colab import drive
# pandas, numpy, matplotlib.pyplot, seaborn은 기본으로 가지고 들어간다.
import pandas as pd
import numpy as np
import matplotlib as mpl  # 기본 설정 만지는 용도
import matplotlib.pyplot as plt  # 그래프 그리는 용도
import matplotlib.font_manager as fm  # 폰트 관련 용도
import seaborn as sns
2. Data Import
#코랩 한글폰트 지정, 사용후 안될시 런타임 다시 시작.
!sudo apt-get install -y fonts-nanum
!sudo fc-cache -f -v
!rm ~/.cache/matplotlib -rf

plt.style.use('Solarize_Light2')
plt.rcParams.update({'font.size':15})

mpl.rcParams['axes.unicode_minus'] = False
plt.rc('font', family='NanumBarunGothic')

# 데이터 임포트
train = pd.read_csv('/content/drive/MyDrive/강성웅/미니 프로젝트 EDA/prudential/train.csv') # train data
test = pd.read_csv('/content/drive/MyDrive/강성웅/미니 프로젝트 EDA/prudential/test.csv') # test data
3. Data Analysis
(1) 데이터 개요
- Id : 고유 식별자
- Product_Info_1-7 : 적용된 상품과 관련된 정규화된 변수 세트
- Ins_Age: 신청자의 정규화된 나이
- Ht: 신청자의 정규화된 키
- Wt: 신청자의 정규화된 몸무게
- BMI: 신청자의 정규화된 BMI
- Employment_Info_1-6: 신청자의 고용 이력과 관련된 정규화된 변수 세트
- InsuredInfo_1-6: 신청자에 대한 정보를 제공하는 일련의 정규화된 변수
- Insurance_History_1-9: 신청자의 보험 이력과 관련된 정규화된 변수 세트
- Family_Hist_1-5: 신청자의 가족력과 관련한 정규화된 변수 세트
- Medical_History_1-41: 신청자의 의료 기록과 관련된 정규화된 변수 세트
- Medical_Keyword_1-48: 신청자와 관련된 의료 키워드의 유무와 관련된 더미 변수 세트
- Response: 신청자와 관련된 최종 결정과 관련된 서수 변수인 대상 변수
Categorical 변수
- Product_Info_1-3,5-7
- Employment_Info_2,3,5
- InsuredInfo_1-7
- Insurance_History_1-4,7-9
- Family_Hist_1
- Medical_History_2-9,11-14,16-23,25-31,33-41
연속변수
- Product_Info_4
- Ins_Age
- Ht, Wt, BMI
- Employment_Info_1,4,6
- Insurance_History_5
- Family_Hist_2-5
이산형 변수
- Medical_History_1, 10, 15, 24, 32
더미 변수
- Medical_Keyword_1-48
train.info()
총 59381행*128열
(2) 결측 컬럼 처리
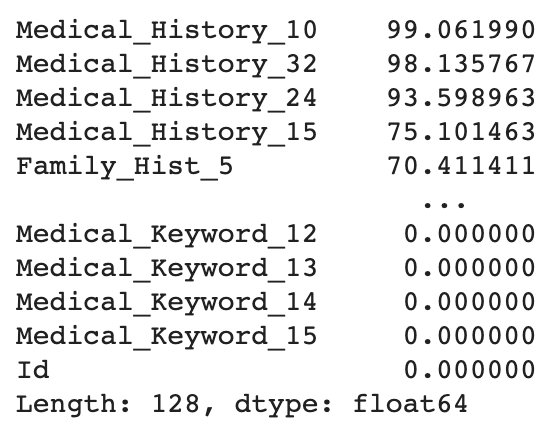
(train.isnull().sum() / train.shape[0] * 100).sort_values(ascending=False)
Medical History 10,32,24,15순으로 높은 비율의 결측치가 존재하며, 전체적으로는 1개 이상 결측치가 존재하는 컬럼은 총 13개이다.
그러나 결측치가 존재하는 컬럼 중에 Categorical Variables는 없는 것으로 확인된다.categorical = [ 'Employment_Info_2', 'Employment_Info_3', 'Employment_Info_5', 'Family_Hist_1' ] pi_vars1 = [f'Product_Info_{i}' for i in range(1, 4)] pi_vars2 = [f'Product_Info_{i}' for i in range(5, 8)] ii_vars = [f'InsuredInfo_{i}' for i in range(1, 8)] ih_vars1 = [f'Insurance_History_{i}' for i in range(1,5)] ih_vars2 = [f'Insurance_History_{i}' for i in range(7,10)] mh_vars1 = [f'Medical_History_{i}' for i in range(2,10)] mh_vars2 = [f'Medical_History_{i}' for i in range(11,15)] mh_vars3 = [f'Medical_History_{i}' for i in range(16,24)] mh_vars4 = [f'Medical_History_{i}' for i in range(25,32)] mh_vars5 = [f'Medical_History_{i}' for i in range(33,42)] categorical = categorical + pi_vars1 + pi_vars2 + ii_vars + ih_vars1 + ih_vars2 + mh_vars1 + mh_vars2 + mh_vars3 + mh_vars4 + mh_vars5 series = (train.isnull().sum() / train.shape[0] * 100).sort_values(ascending=False) series[series>0].reset_index()['index'].isin(categorical)
결측치의 수를 바 그래프로 확인해보자.
isna_train = train.isnull().sum().sort_values(ascending=False)
isna_train[:13].plot(kind='bar')
plt.show()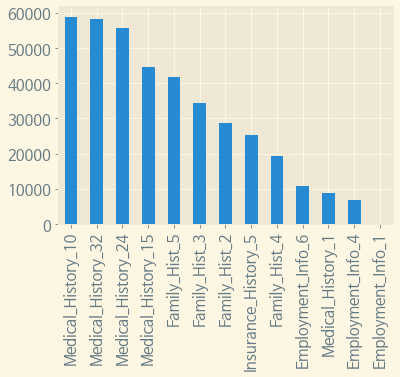
위에서 서술하였듯 13개의 컬럼에 결측치가 존재하나, Employment_Info_1은 0%대의 결측치가 존재한다.
(3) 결측 컬럼 Drop
def drop_columns(table, percent=0.3):
  """
  일정 비율 이상의 null값이 있는 column을 지정한 테이블에서 drop한다.
  :param table: 지정할 테이블
  :param percent: 퍼센트 지정. 기본 0.3
  :return table: column을 drop하고 난 테이블
  """
  table = table.drop(table.columns[table.isnull().sum()/table.shape[0] > percent].to_list(), axis=1)
  return table
# 30% 이상 결측치가 있는 column을 모두 drop한다.
train = drop_columns(train)
test = drop_columns(test)
(train.isnull().sum()*100/train.shape[0]).sort_values(ascending=False)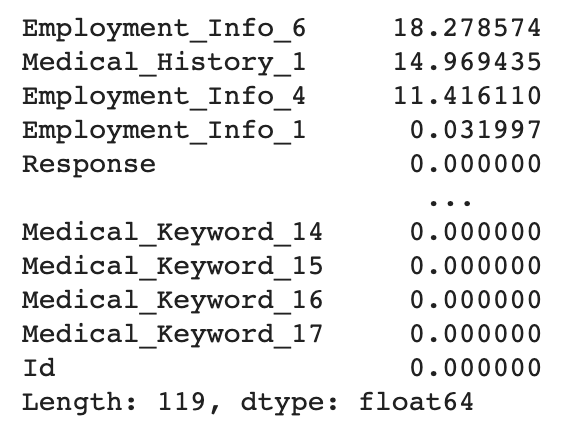
30% 이상 결측치가 있는 컬럼은 모두 Drop 되었다.
# 남은 결측 컬럼 중 카테고리컬 컬럼이 없고 연속형변수 뿐인데 0으로 결측치를 채우는 게 적합할 듯 하여 0으로 채우기로 한다.
train.fillna(0, inplace=True)
3. Continuous Variables
(1) BMI
# BMI의 분포를 알아본다.
f, (ax1, ax2) = plt.subplots(1, 2, figsize=(15, 8))
sns.boxplot(y = 'BMI', data=train, orient='v', ax=ax1)
sns.histplot(data=train['BMI'], kde=True)
ax1.set_title('BMI Box Distibution')
ax2.set_title('BMI Histogram')
ax2.set_ylabel('')
plt.show()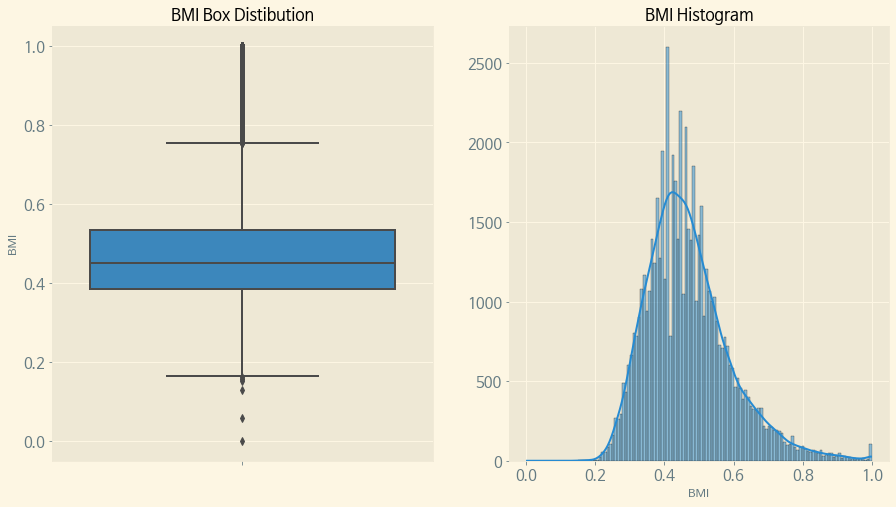
# Response별 BMI의 분포
f, (ax) = plt.subplots(1, 1, figsize=(15, 7))
sns.boxenplot(x='Response', y='BMI', data=train, palette='rainbow', ax=ax)
ax.set_title('BMI Distribution per Response')
plt.show()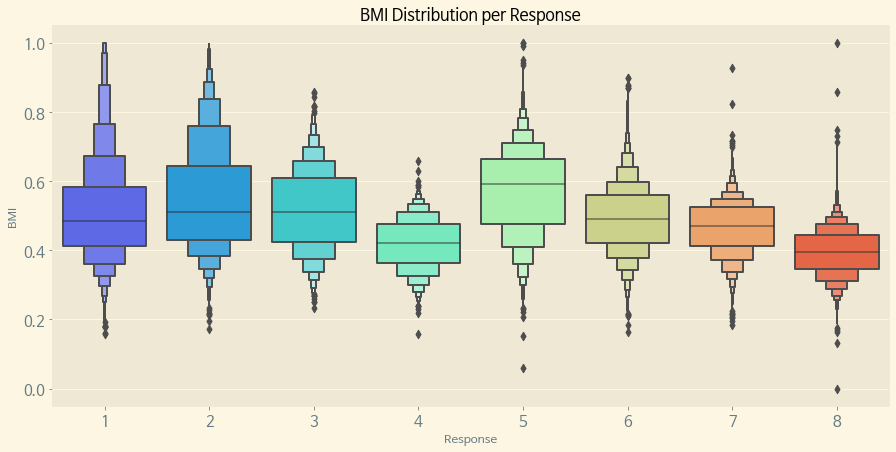
Response별로 BMI의 분포가 비슷한 것도 있고, 다른 Response와 확연하게 차이가 있는 Response도 있다. Response의 비율도 알아보도록 하자.
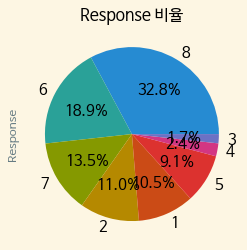
ax = train['Response'].value_counts().plot.pie(autopct='%.1f%%')
ax.set_title('Response 비율')
Response 8이 32.8%로 가장 높으면서 그 다음이 6번의 18.9%로, 가장 높은 비율의 8이 다른 Response에 비해 압도적으로 높은 것을 확인 할 수 있다.
(2) Age
f, (ax1, ax2) = plt.subplots(1, 2, figsize=(15, 7))
sns.boxplot(y='Ins_Age', data=train, orient='v', ax=ax1, palette='rainbow')
sns.histplot(train['Ins_Age'], ax=ax2, kde=True)
plt.show()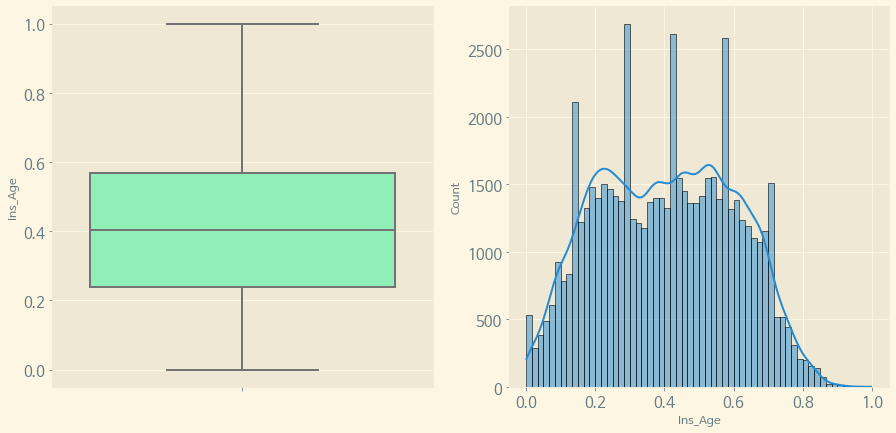
연령대를 확인해 보면, 대체로 0.2~0.6 사이가 많은 것을 알 수 있다.
다음으로, Response별 Age의 분포를 알아본다.
f, (ax) = plt.subplots(1, 1, figsize=(15, 7))
sns.boxenplot(x='Response', y='Ins_Age', data=train, palette='rainbow', ax=ax)
ax.set_title('Age Distribution per Response')
plt.show()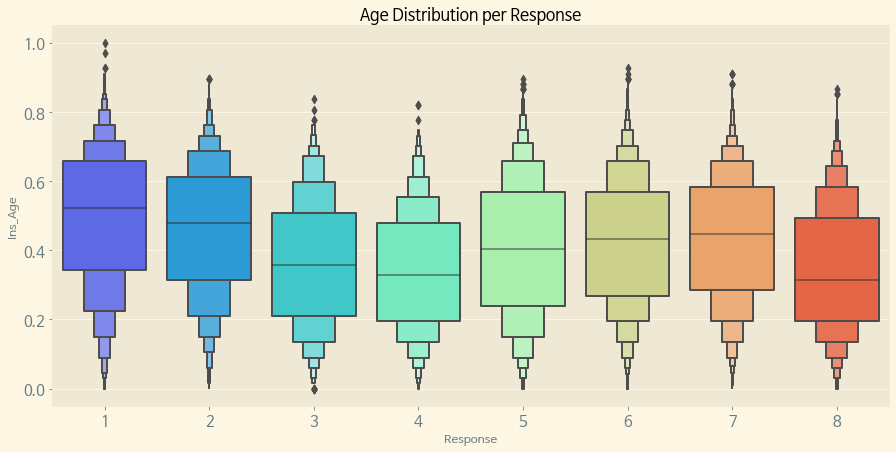
이번에는 BMI 분포보다 더 명확하게 Response별 BMI의 분포가 차이가 나는 것을 알 수 있다.
Response의 비율이 가장 높았던 8번이 Age가 낮은 쪽에 분포되어 있으면서, 가장 Response의 비율이 낮은 3,4 또한 Response 8과 비슷한 Age의 분포가 형성되어 있다.
(3) Weight
체중도 위의 BMI, Age와 마찬가지의 방법으로 분포 및 Response와의 관계를 알아본다.(Height도 같은 방법으로 진행한다.)
f, (ax1, ax2) = plt.subplots(1, 2, figsize=(15, 7))
sns.boxplot(y='Wt', data=train, orient='v', ax=ax1, palette='rainbow')
sns.histplot(train['Wt'], ax=ax2, kde=True)
plt.show()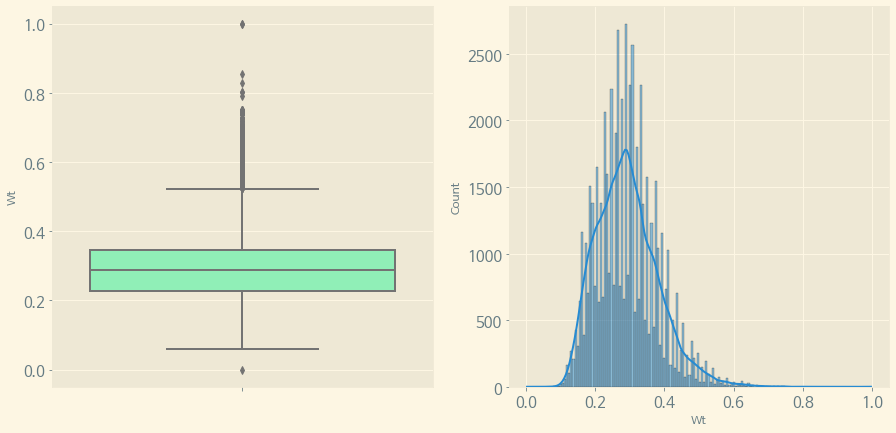
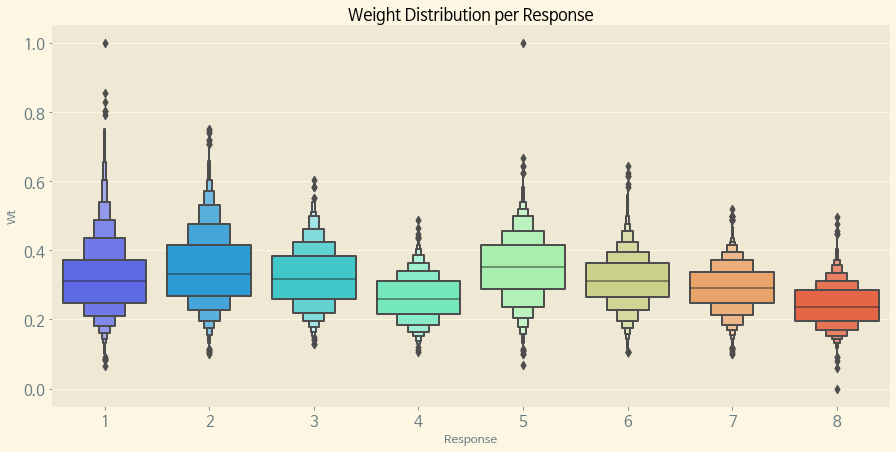
몸무게는 대체로 분포가 0.3 전후에 분포되어 있으면서, 역시 마찬가지로 8번 Response가 몸무게의 분포되어 있는 수치가 낮은 것 같다.
(4) Height
f, (ax1, ax2) = plt.subplots(1, 2, figsize=(15, 7))
sns.boxplot(y='Ht', data=train, orient='v', ax=ax1, palette='rainbow')
sns.histplot(train['Ht'], ax=ax2, kde=True)
plt.show()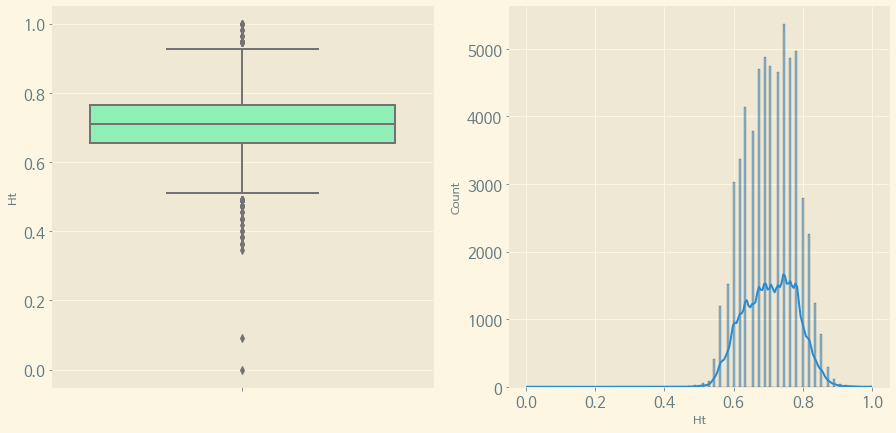
f, (ax) = plt.subplots(1, 1, figsize=(15, 7))
sns.boxenplot(x='Response', y='Ht', data=train, palette='rainbow', ax=ax)
ax.set_title('Height Distribution per Response')
plt.show()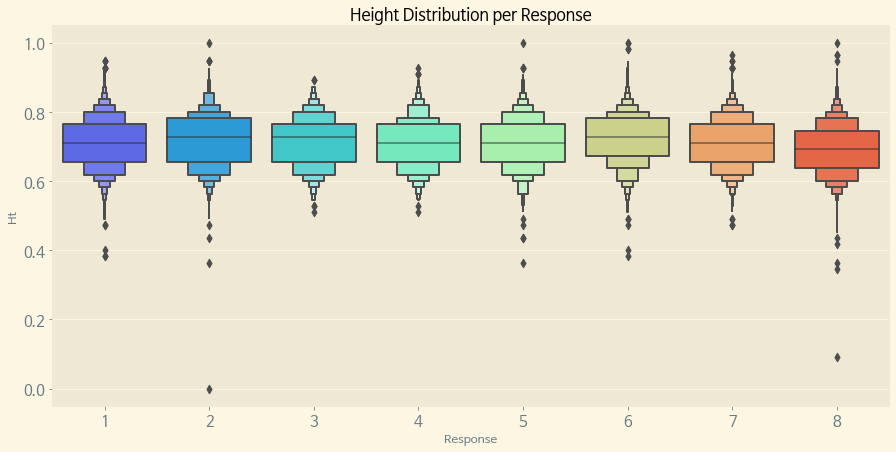
Applicant의 Height는 대체로 0.7 전후에 밀집되어 분포되어 있으며 역시 마찬가지로 8번 Response가 Height의 수치가 낮은 편이다.
Continuous Variables 중 의미를 명확하게 알 수 있는 BMI, Age, Weight, Height만 분포를 알아보았다.
다음은 이것들을 카테고리로 전환하도록 한다.
(5) 카테고리 나누기
# BMI 분포별 카테고리 나누기
BMI = 'BMI'
HT = 'Ht'
AGE = 'Ins_Age'
WT = 'Wt'

conditions = [
  (train[BMI] <= train[BMI].quantile(0.25)),
  ((train[BMI] > train[BMI].quantile(0.25)) & (train[BMI] <= train[BMI].quantile(0.75))),
  (train[BMI] > train[BMI].quantile(0.75))
]
choices = ['under_weight', 'average', 'overweight']
train['BMI_Wt'] = np.select(conditions, choices)

# 연령 분포별 카테고리 나누기
conditions = [
  (train[AGE] <= train[AGE].quantile(0.25)),
  ((train[AGE] > train[AGE].quantile(0.25)) & (train[AGE] <= train[AGE].quantile(0.75))),
  (train[AGE] > train[AGE].quantile(0.75))
]
choices = ['young', 'average', 'old']
train['Old_Young'] = np.select(conditions, choices)

# 신장 분포별 카테고리 나누기
conditions = [
  (train[HT] <= train[HT].quantile(0.25)),
  ((train[HT] > train[HT].quantile(0.25)) & (train[HT] <= train[HT].quantile(0.75))),
  (train[HT] > train[HT].quantile(0.75))
]
choices = ['short', 'average', 'tall']
train['Short_Tall'] = np.select(conditions, choices)

# 체중 분포별 카테고리 나누기
conditions = [
  (train[WT] <= train[WT].quantile(0.25)),
  ((train[WT] > train[WT].quantile(0.25)) & (train[WT] <= train[WT].quantile(0.75))),
  (train[WT] > train[WT].quantile(0.75))
]
choices = ['thin', 'average', 'fat']
train['Thin_Fat'] = np.select(conditions, choices)
각각 0.25 이하, 0.25 초과 0.75 이하, 0.75 초과의 범주로 나누고 각각에 대해 카테고리화 시켰다.
def paint_countplot(x, hue, ax, title, xlabel,palette='rainbow', data=train, order=None):
  sns.countplot(data=data, x=x, hue=hue, ax=ax, palette=palette, order=order)
  ax.set_title(title)
  ax.set_xlabel(xlabel)

f, ax = plt.subplots(2, 2, figsize=(30, 20))

paint_countplot(x='BMI_Wt', hue='Response', ax=ax[0][0], title='BMI와 Response의 관계', xlabel='BMI Category', order=['under_weight', 'average', 'overweight'])
paint_countplot(x='Old_Young', hue='Response', ax=ax[0][1], title='연령과 Response의 관계', xlabel='Age Category', order=['young', 'average', 'old'])
paint_countplot(x='Short_Tall', hue='Response', ax=ax[1][0], title='신장과 Response의 관계', xlabel='Height Category', order=['short', 'average', 'tall'])
paint_countplot(x='Thin_Fat', hue='Response', ax=ax[1][1], title='체중과 Response의 관계', xlabel='Weight Category', order=['thin', 'average', 'fat'])

plt.show()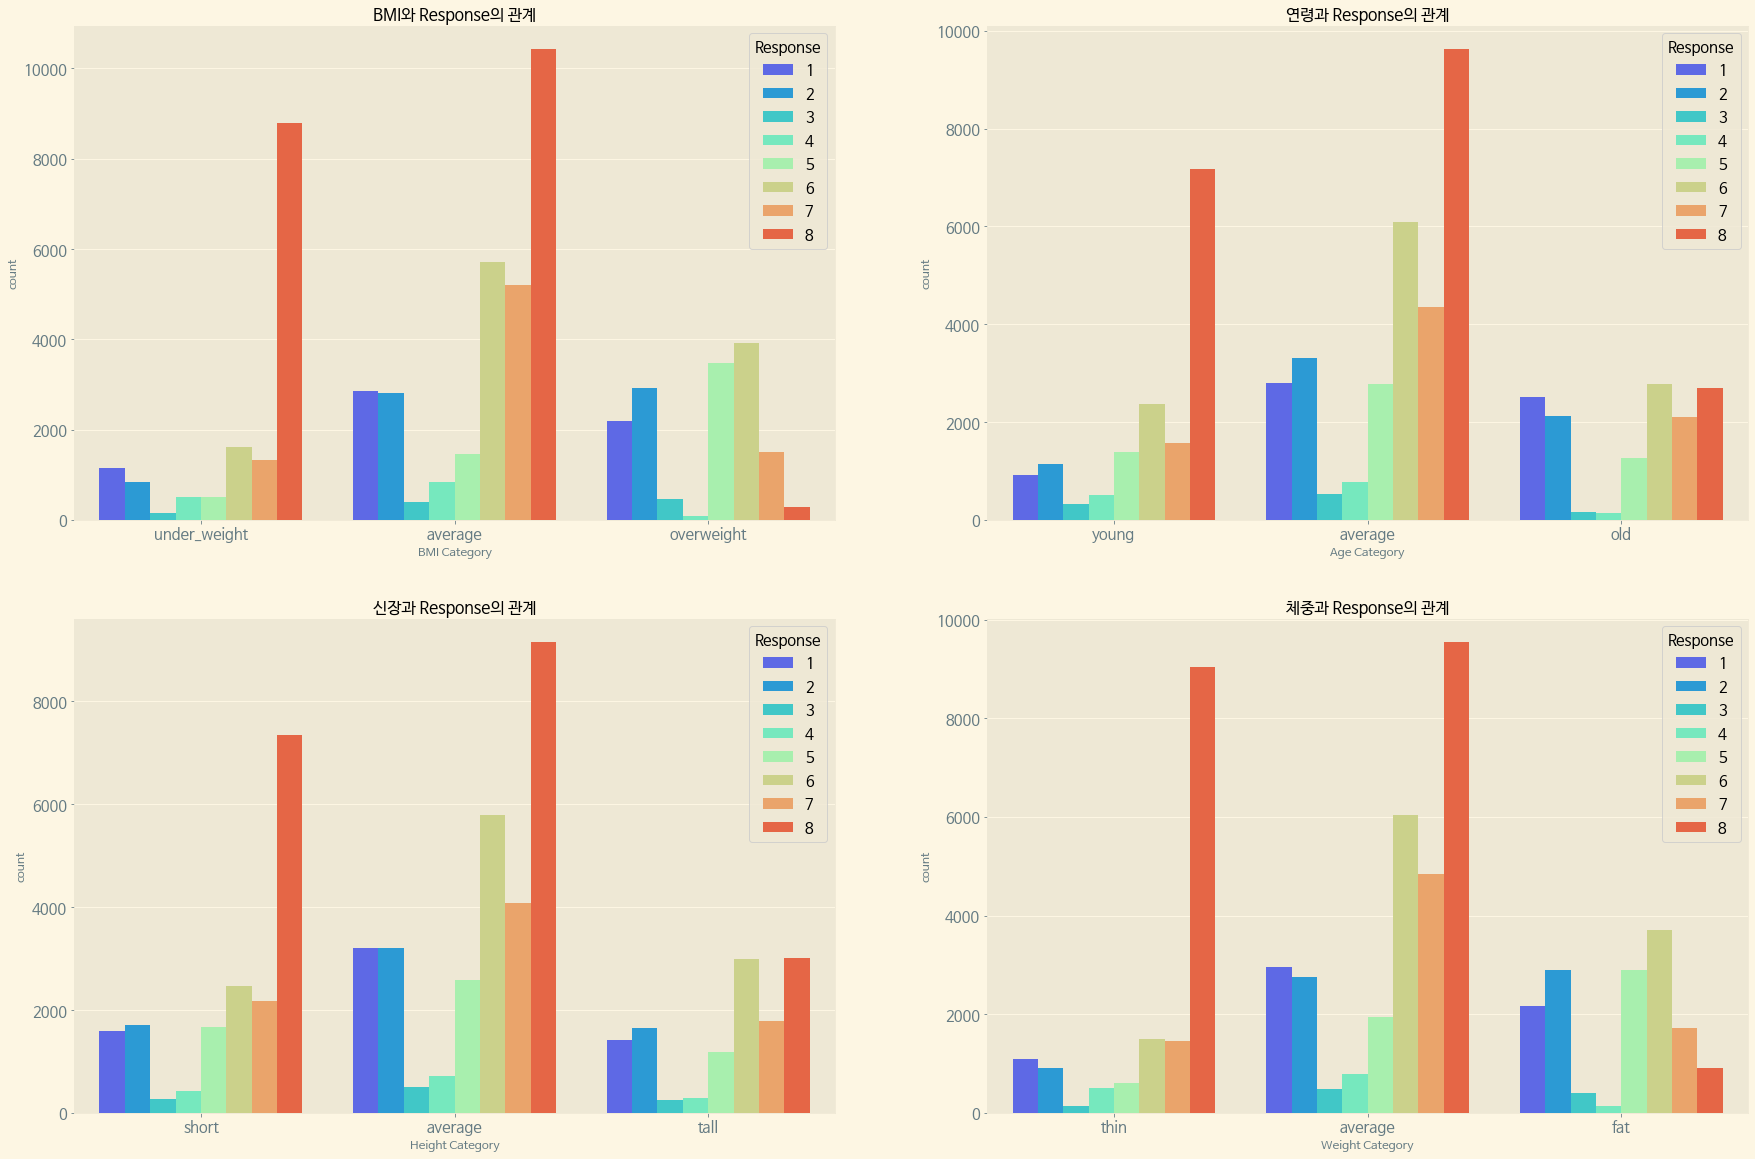
Response 자체의 비율에서도 보았듯, 여기에서도 마찬가지로 각 수치에 대해 Response 8이 높은 수치를 나타내면서도, 각각 가장 높은 수치 범위(Overweight, Old, Tall, Fat)에 대해서는 Response 8이 낮은 수치를 보여주고 있다.
다음으로, 대부분에서 가장 높은 수치를 보여주는 Response 8과 다른 Response(1~7)을 묶어서 각 Continuous Variables의 카테고리들에 대한 값을 비교해 보려고 한다.
(6) Response8과 Continuous Variables의 관계
new_data = train.copy()
new_data['New_Response'] = new_data.apply(lambda x: 1 if x['Response'] == 8 else 0, axis=1)
new_data['New_Response'].value_counts()
train data를 잠시 copy하여 new_data를 만들고 Response가 8이냐 아니냐에 따라 1 또는 0의 값을 넣어 새로운 컬럼인 New_Response를 생성하였다.
값이 0인 New Response가 39892줄, 1이 19489줄 존재한다.
new_data.drop('Response', axis=1, inplace=True)
train = new_data
del new_data
train.head()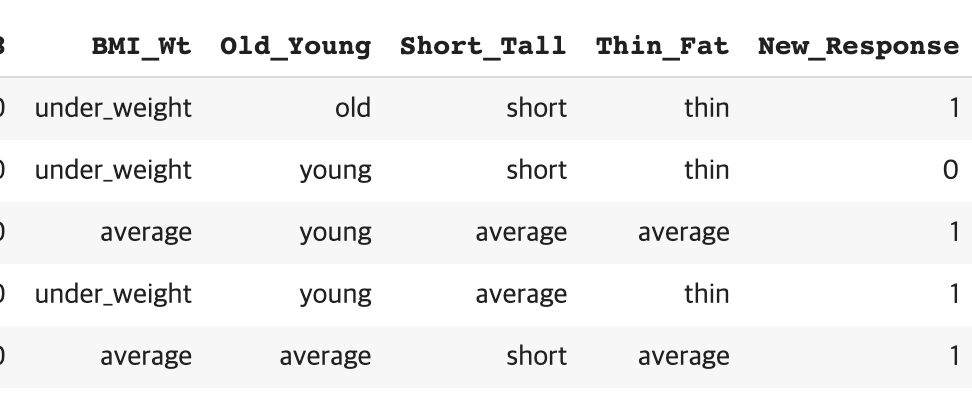
new_data 테이블에서 기존에 있던 Response를 잠시 drop 한 뒤, 원래의 train 데이터에 new_data를 대입하고 다시 new_data는 삭제하였다.
train은 위에서 Category를 만들었던 BMI,Age,Height,Weight에 대한 카테고리화된 컬럼과 함께 New Response 컬럼이 존재한다.
(7) 각 카테고리와 New Response의 관계
(1) New Response와 BMI의 관계
f, ax = plt.subplots(1, 1, figsize=(15, 8))
paint_countplot(data=train, x='BMI_Wt', hue='New_Response', ax=ax, title='BMI와 Response의 관계', xlabel='BMI Category',order=['under_weight', 'average', 'overweight'], palette='Paired')
plt.show()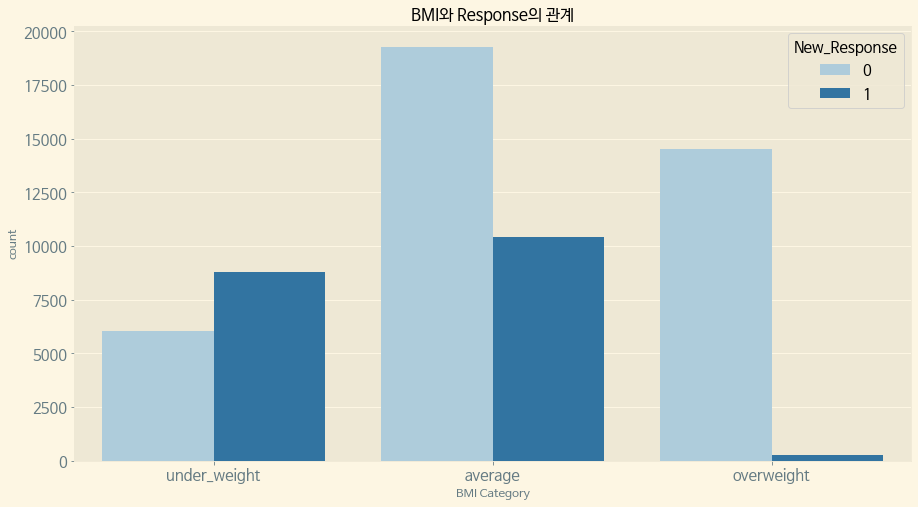
New Response 1은 평균 이하의 BMI에 밀집되어 있다.
(2) New Response와 연령의 관계
f, ax = plt.subplots(1, 1, figsize=(15, 8))
paint_countplot(data=train, x='Old_Young', hue='New_Response', ax=ax, title='연령과 Response의 관계', xlabel='Age Category',order=['young', 'average', 'old'], palette='Set2')
plt.show()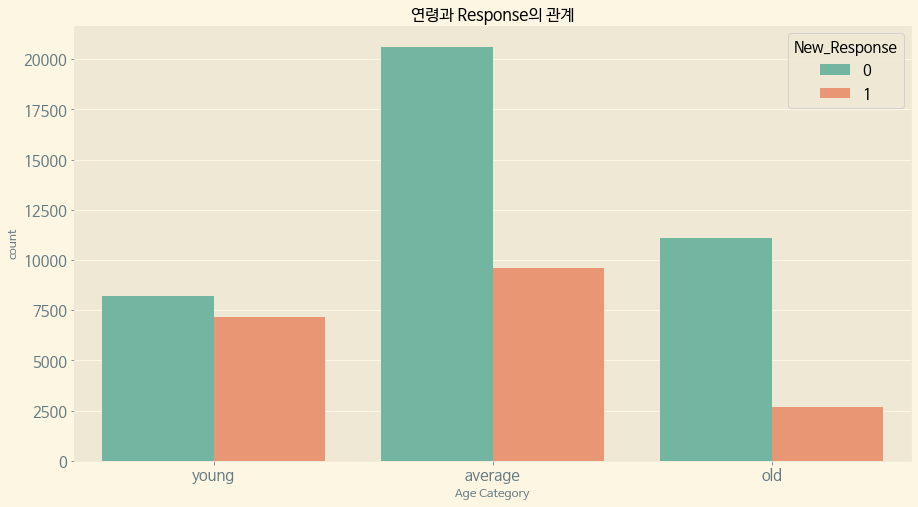
BMI와 마찬가지로 New Response 1은 평균 이하의 연령에 대부분 분포되어 있다.
(3) New Response와 신장의 관계
f, ax = plt.subplots(1, 1, figsize=(15, 8))
paint_countplot(data=train, x='Short_Tall', hue='New_Response', ax=ax, title='신장과 Response의 관계', xlabel='Height Category',order=['short', 'average', 'tall'],palette='husl')
plt.show()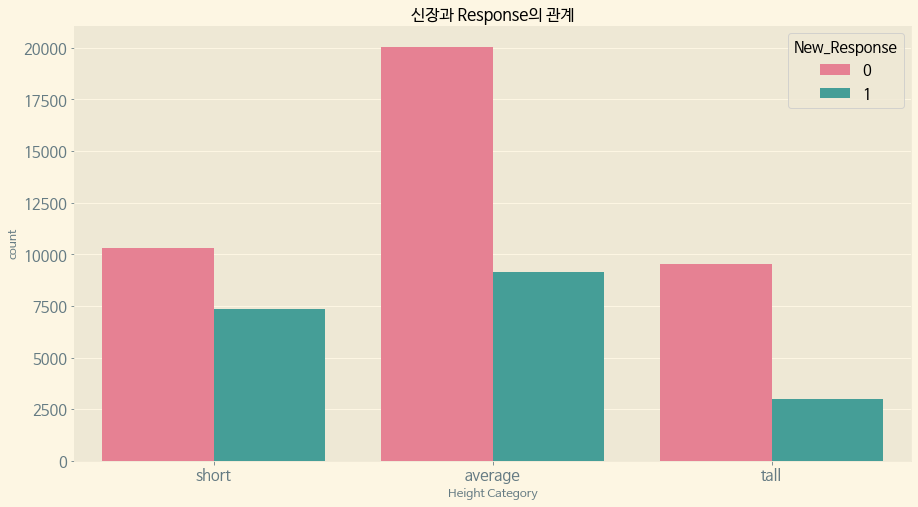
역시 평균 이하의 신장에 New Response 1이 대부분 분포되어 있다.
(4) New Response와 체중의 관계
f, ax = plt.subplots(1, 1, figsize=(15, 8))
paint_countplot(data=train, x='Thin_Fat', hue='New_Response', ax=ax, title='체중과 Response의 관계', xlabel='Weight Category',order=['thin', 'average', 'fat'], palette='hls')
plt.show()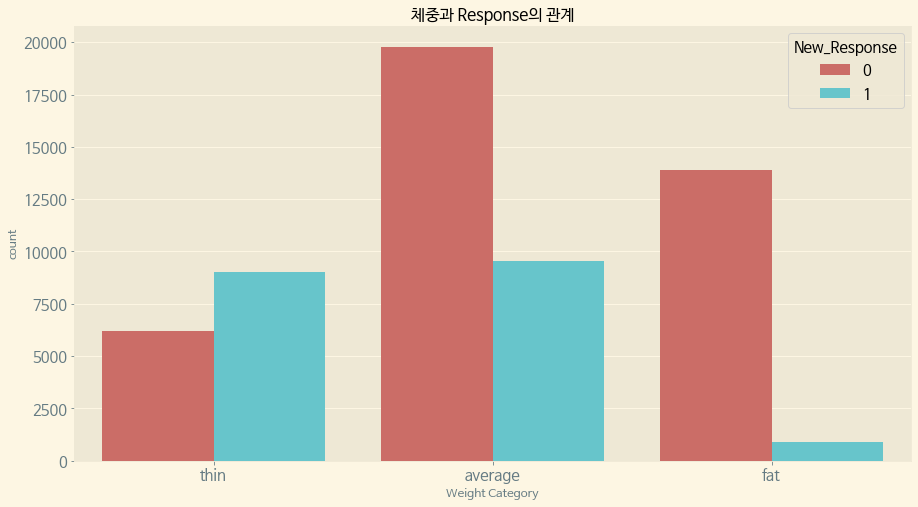
체중 역시 평균 이하에 New Response 1이 밀집분포되어 있다.
4. 위험도 알아보기
먼저 New Response 컬럼명을 Response로 바꾸도록 한다.
train.rename(columns={'New_Response':'Response'}, inplace=True)BMI가 높거나, 체중이 높거나, 나이가 많은 사람은 '매우 위험'으로 분류한다.
def new_target(row):
  val = 'not_extremely_risky'
  # BMI가 높거나, 체중이 높거나, 나이가 많은 사람은 '매우 위험'으로 분류한다.
  if row['BMI_Wt'] == 'overweight' or row['Thin_Fat'] == 'fat' or row['Old_Young'] == 'old':
    val = 'extremely_risky'
  return val
train['extreme_risk'] = train.apply(new_target, axis=1)
f, ax = plt.subplots(figsize=(10, 7))
sns.countplot(x='extreme_risk', hue='Response', data=train, ax=ax, palette='rainbow')
ax.set_title('Extremely Risk Count')
plt.show()
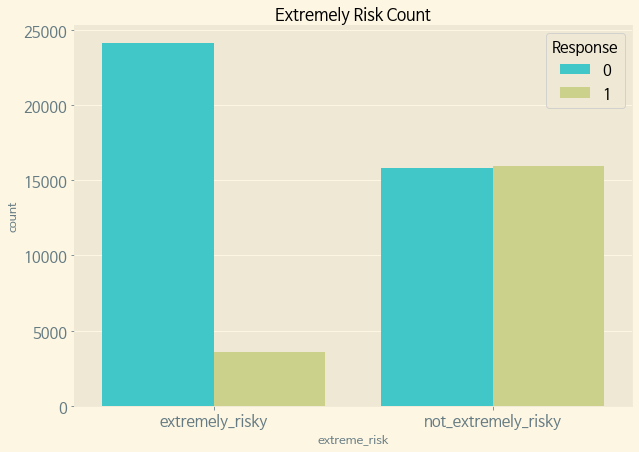
고위험/비(非) 고위험 신청자 중에는 비 고위험 신청자가 Response 1의 비율이 고위험에 비해 압도적으로 높다.
평균 위험도를 분류한다.
def new_target(row):
  val = 'non_average'
  # BMI가 평균이거나 체중이 평균이거나 나이가 평균이면 평균 위험도로 분류한다.
  if row['BMI_Wt'] == 'average' or row['Thin_Fat'] == 'average' or row['Old_Young'] == 'average':
    val = 'average'
  return val
train['average_risk'] = train.apply(new_target, axis=1)
f, ax = plt.subplots(figsize=(10, 7))
sns.countplot(x='average_risk', hue='Response', data=train, ax=ax, palette='rainbow')
ax.set_title('Average Risk Count')
plt.show()
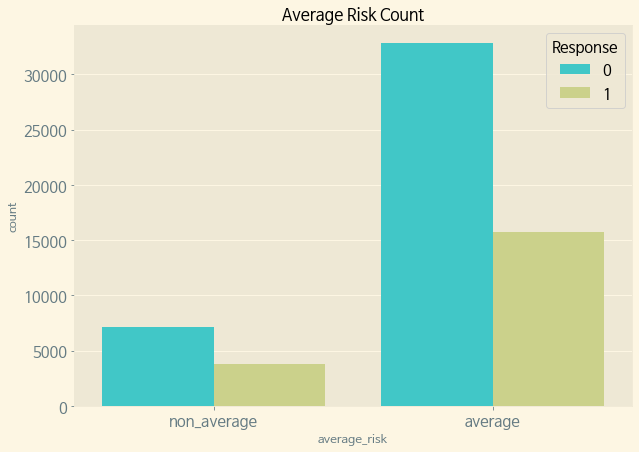
평균 위험도에서는 비 평균 위험도에 비해 Response 1의 비율이 매우 높다.
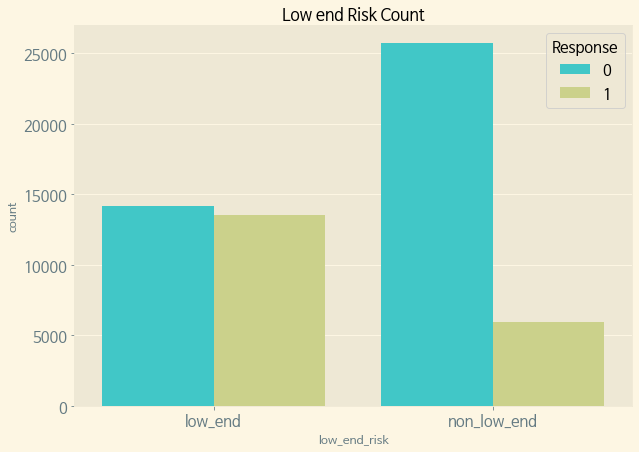
낮은 위험도를 분류한다.
def new_target(row):
  val = 'non_low_end'
  if row['BMI_Wt'] == 'under_weight' or row['Thin_Fat'] == 'thin' or row['Old_Young'] == 'young':
    val = 'low_end'
  return val
train['low_end_risk'] = train.apply(new_target, axis=1)
f, ax = plt.subplots(figsize=(10, 7))
sns.countplot(x='low_end_risk', hue='Response', data=train, ax=ax, palette='rainbow')
ax.set_title('Low end Risk Count')
plt.show()
위험도가 낮은 신청자 쪽이 그렇지 않은 신청자에 비하면 Response 1의 비율이 높다.
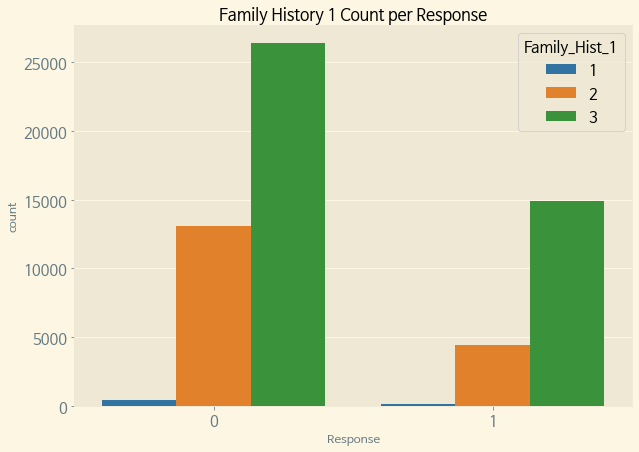
ex)Family Hist 1
f, ax = plt.subplots(figsize=(10, 7))
sns.countplot(data=train, x='Response', hue='Family_Hist_1', palette='tab10', ax=ax)
ax.set_title('Family History 1 Count per Response')
plt.show()
Categorical Variables 중에서 Family History 1에 대해서도 Response의 비율을 분석해 보았다.
Family History 1에 1,2,3의 값이 존재하는데, 1<2<3 순으로 Response의 비율이 높다.
위에서 공통적으로 Risky한 Category에 Response 값이 그렇지 않은 것에 비해 높았음을 볼 때, Family History 1이 가장 위험도가 높고, 2, 3 순으로 위험도가 낮은 듯 하다.(즉, 가족력 위험등급?)
Medical History(치료력?)에 대해서도 위험도를 한 번 보고자 한다.(이것은 이산 변수이긴 하다.)
train.loc[:, "Medical_History_1"] = train.loc[:, "Medical_History_1"].fillna(0)
train.loc[:, "Medical_History_1"].value_counts()
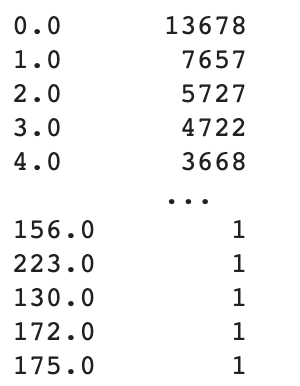
결측값이 조금 존재하였던 Medical History 1의 카운트이다. (결측값 조차 없는 것은 의료력이 없는 것이라 가정하여 마찬가지로 위에서 0으로 결측값을 채웠었다.)
0에 가까울수록 그 값이 많은 것을 알 수 있다.
f, ax = plt.subplots(figsize=[15, 8])
sns.countplot(data=train, x='Medical_History_1', ax=ax)
ax.set_xticklabels(labels=ax.get_xticklabels(), rotation=45)
ax.set_title('Medical History 1 Count')
plt.show()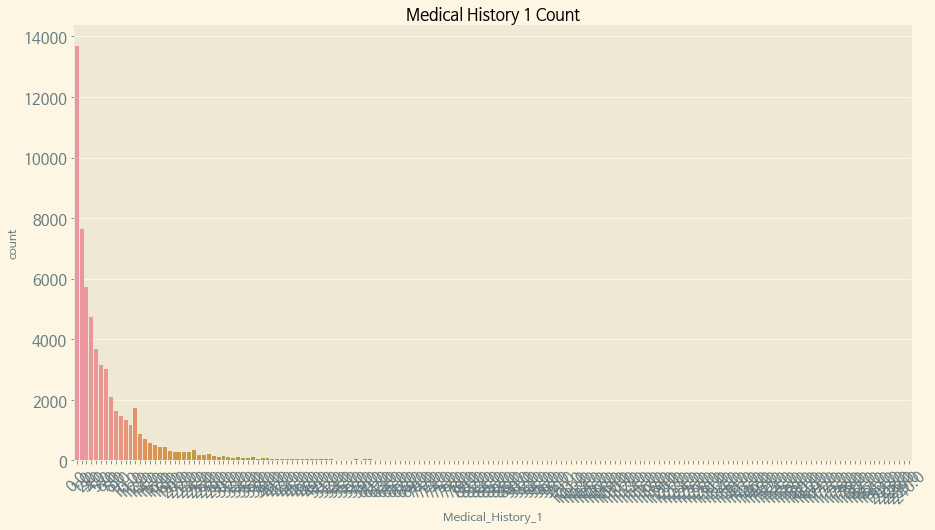
Medical History 1의 값이 너무 많은 관계로 Response별로 보기보다 값의 수 자체만 가지고 보았다. 위에서 적었듯이 0에 가까울수록 그 값이 높은 것을 볼 때, 0에 가까울 수록 의료력이 적은 것을 뜻하는 듯 하다.
5. 결론
전체 Response 중 약 1/3에 달하는 8번에 대해, 체중,신장,연령,BMI 모두 평균 이하의 분포에 밀집되어 있는 것으로 보인다. 주로 '위험하지 않은' 분류에 속하는 사람들에게 Response 8번이 주어졌음을 생각하면, Response 8이 보험 가입이 승인 된 것의 번호로 보아야 하지 않나 생각된다.
다시 말해, Risk를 산정함에 있어 데이터에서 주어진 BMI,신장,체중,연령 모두 유의미한 데이터이며, Categorical Variables에 속해있던 Family History 1이나 이산변수였던 Medical History 1 또한 위험도 추측에 사용이 가능한 것으로 볼 수 있다.

