Azure Monitor Agent(AMA)는 공식적으로 지원되는 운영체제에서만 동작하며, 지원되지 않는 버전에서는 설치 시 오류가 발생하거나 설치 자체가 거부됩니다.
이외에도 지원 목록에 없는 OS에서는 extension 형태로도 설치되지 않습니다. Azure 공식 문서에서 지원되는 OS를 확인하고, 목록에 없는 경우 Telegraf 같은 별도 에이전트 사용이 필요합니다
환경
- 클라우드 : Azure
- 서버(전송 노드) : Telegraf 서버 VM (ubuntu 22.04) — 클라이언트에서 수집한 데이터를 Azure Monitor로 전송
- 클라이언트(수집 노드) : AMA 미지원 VM (Linux) — Telegraf 설치 후 메트릭 수집
1) 공통: Telegraf 설치 (서버/클라이언트 모두)
# Ubuntu/Debian
sudo apt-get update
sudo apt-get install -y telegraf
systemd 오버라이드 안 함. 기본 ExecStart는
/usr/bin/telegraf -config /etc/telegraf/telegraf.conf -config-directory /etc/telegraf/telegraf.d
이라서,.d에 넣은 conf들을 자동으로 함께 읽는다.
2) 서버 VM (Azure Monitor로 직접 전송)
/etc/telegraf/telegraf.conf 수정:
[agent]
  interval = "10s"
  round_interval = true
  flush_interval = "10s"

# 출력
[[outputs.azure_monitor]]

# 입력
[[inputs.cpu]]
  percpu = true
  totalcpu = true
  collect_cpu_time = false
  report_active = true

[[inputs.disk]]
[[inputs.diskio]]
[[inputs.kernel]]
[[inputs.mem]]
[[inputs.processes]]
[[inputs.swap]]
[[inputs.system]]
3) 클라이언트 VM(들) (Azure Monitor로 직접 전송)
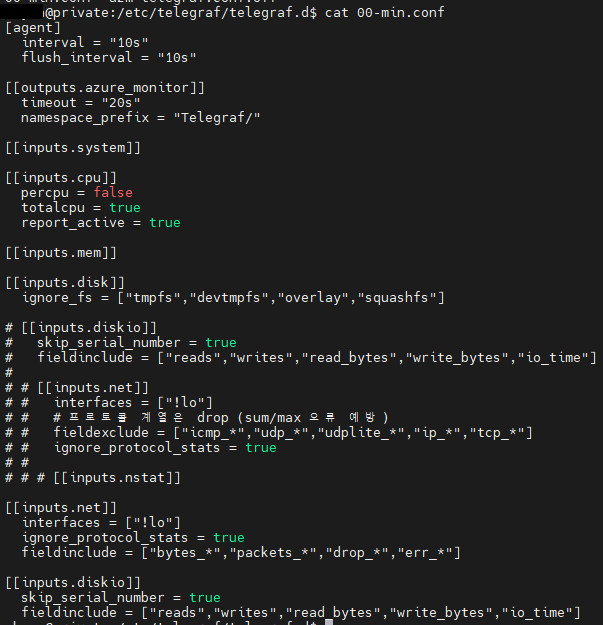
/etc/telegraf/telegraf.d/00-client.conf 생성:
sudo tee /etc/telegraf/telegraf.d/00-client.conf >/dev/null <<'EOF'
[agent]
  interval = "10s"
  flush_interval = "10s"

[[outputs.azure_monitor]]
  timeout = "20s"
  namespace_prefix = "Telegraf/"

[[inputs.system]]

[[inputs.cpu]]
  percpu = true
  totalcpu = true
  report_active = true

[[inputs.mem]]

[[inputs.disk]]
  ignore_fs = ["tmpfs","devtmpfs","overlay","squashfs"]

# 400 회피 패턴
[[inputs.net]]
  interfaces = ["!lo"]
  ignore_protocol_stats = true
  fieldinclude = ["bytes_*","packets_*","drop_*","err_*"]

[[inputs.diskio]]
  skip_serial_number = true
  fieldinclude = ["reads","writes","read_bytes","write_bytes","io_time"]
EOF

sudo systemctl enable --now telegraf
위처럼 하면 서버/클라이언트 각 VM이 자기 Managed Identity로 Azure Monitor에 직접 전송
4) Managed Identity 권한 부여 (각 VM마다 1회)
각 VM에 대해 실행(리소스 그룹/VM 이름만 바꿔서 반복):
# 변수에 담아 쓰면 편해
principalId=$(az vm show -g <ResourceGroup> -n <VmName> --query identity.principalId -o tsv)
scope=$(az vm show -g <ResourceGroup> -n <VmName> --query id -o tsv)

az role assignment create \
  --assignee-object-id "$principalId" \
  --assignee-principal-type ServicePrincipal \
  --role "Monitoring Metrics Publisher" \
  --scope "$scope"
권한이 잡히면, IMDS 토큰 확인도 가능:
curl -s -H "Metadata: true" \
'http://169.254.169.254/metadata/identity/oauth2/token?api-version=2018-02-01&resource=https%3A%2F%2Fmonitoring.azure.com%2F' \
| grep -o '"token_type":"[^"]*"'
# "token_type":"Bearer" 나오면 정상
포탈에서도 가능 :
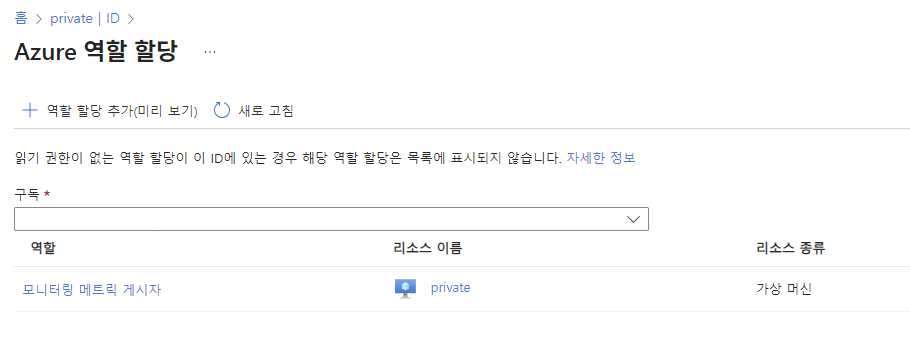
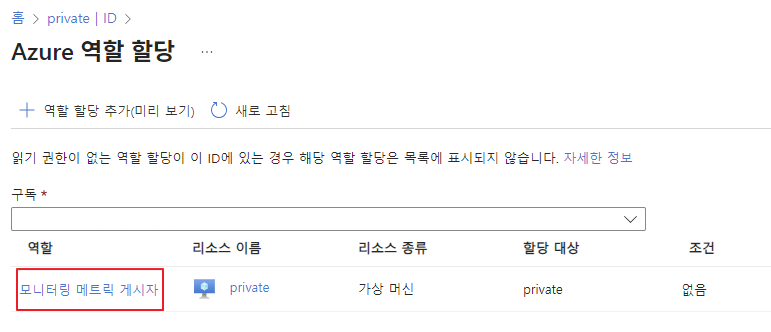
가상머신 > 보안 | ID > 상태 | 켜기 > Azure 역할 할당
5) 동작 확인
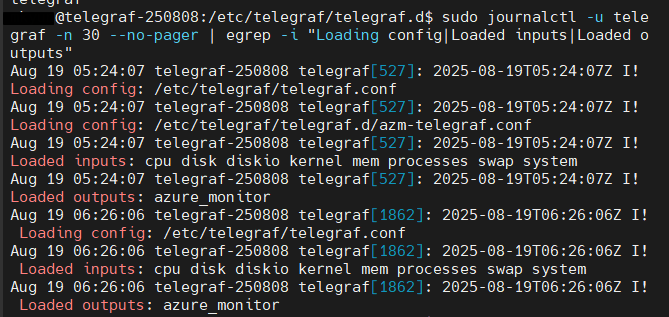
sudo systemctl restart telegraf
journalctl -u telegraf -n 100 --no-pager | egrep -i "azure_monitor|error|bad request"ignore_protocol_stats경고가 보이면[[inputs.net]]블록이 다른 conf에 남아있는지 grep으로 확인해서 정리.
가상머신 > 모니터링 > 메트릭 > 메트릭 네임스페이스에서 telegraf/*을 확인 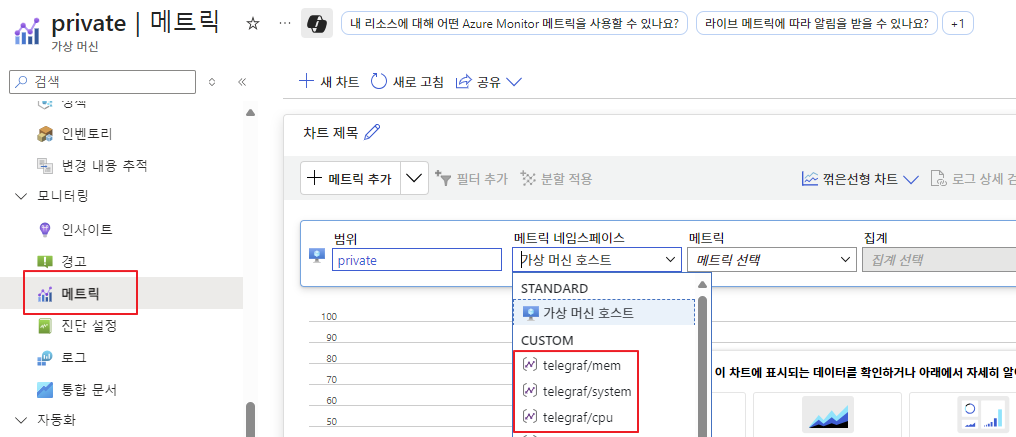
6) Grafana (Azure Monitor 데이터 보기)
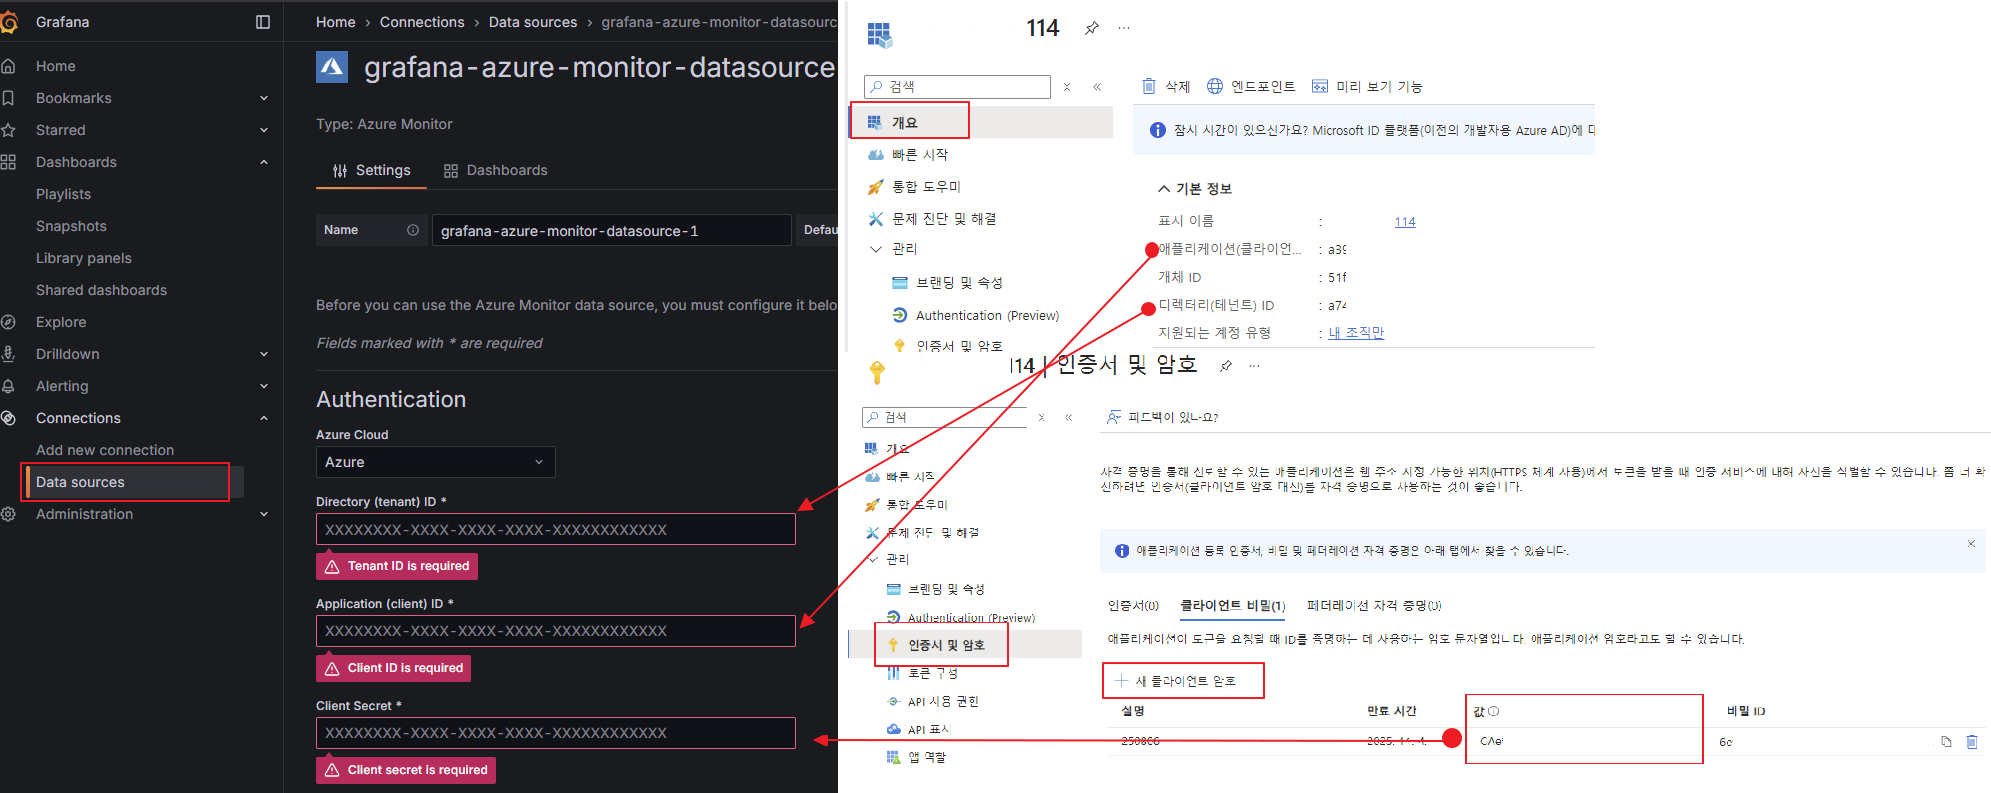
Microsoft Entra ID > 관리 > 앱등록 > 앱 등록 필요
-
Grafana → Connections → Data sources → Add data source → Azure Monitor
-
Dashboard에 pannel 작성 시 Telegraf 확인
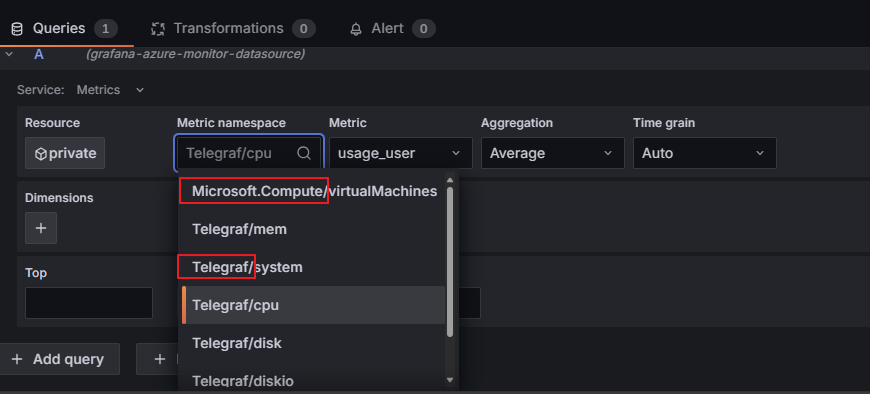
Azure가 기본으로 가져오는 [Microsoft.Compute] 도 확인할 수 있다.