서버 운영 중 가장 자주 확인해야 하는 정보 중 하나는 바로 CPU 사용률입니다.
하지만 매번 원격으로 접속해서 작업 관리자를 열고 확인하는 건 번거롭고 비효율적이죠.
그래서 이번에는 Zabbix를 활용해 Windows Server의 CPU 점유율 상위 프로세스를 자동으로 모니터링할 수 있도록 구성해봤습니다.
Zabbix로 Windows Server의 모니터링 구성
1. 기본 구성
-
Zabbix Server : Ubuntu 22.04
-
Zabbix Agent : Windows Server 2019
-
통신 포트: TCP 10050 (기본 Agent 수신)
-
사용한 Zabbix 템플릿: Windows by Zabbix agent
-
: Zabbix Server Agent
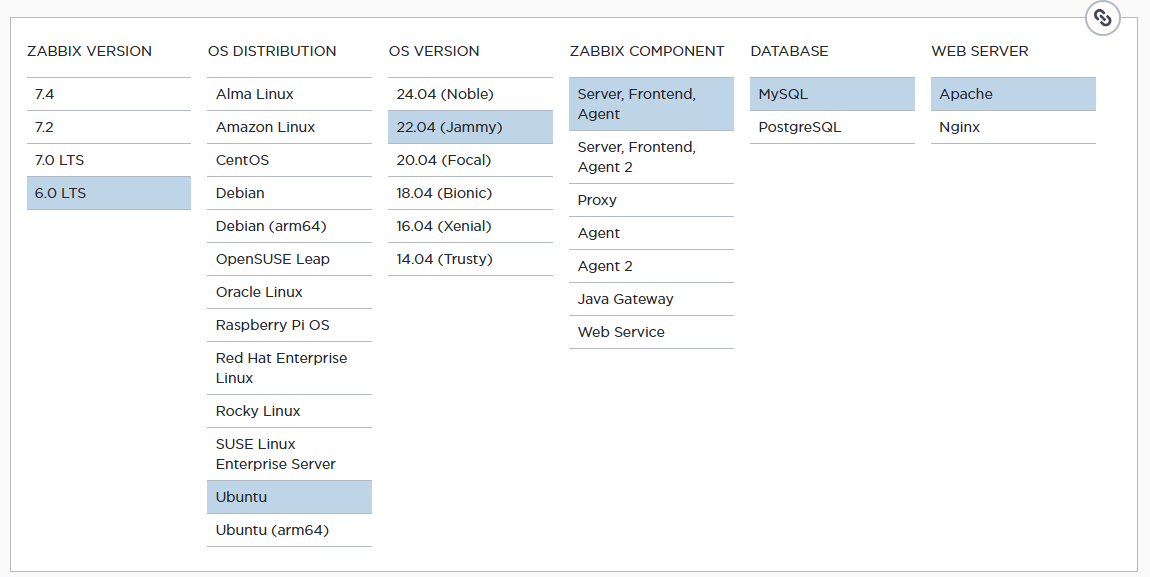
Zabbix version 7.0 이상은 Ubuntu 22.04 지원이 안되는 것 같습니다.
2. Zabbix 에이전트 설치 및 설정
-
대상 시스템: Windows Server 2019
-
에이전트 설치 경로 예시: C:\Program Files\Zabbix Agent 2\
-
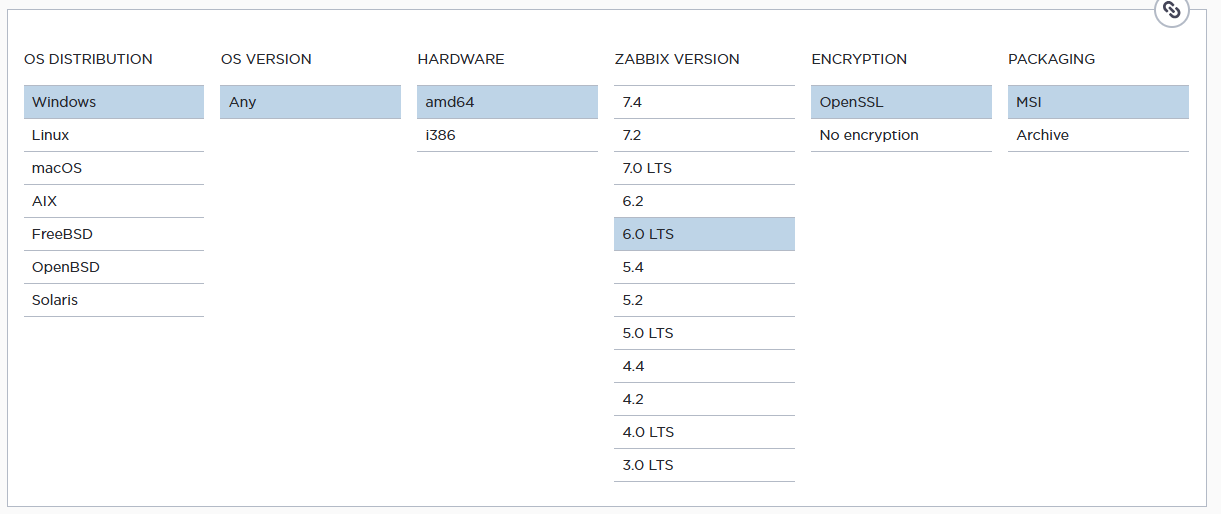
사용 버전: Zabbix 6.0 LTS, Windows용 zabbix_agent2
-
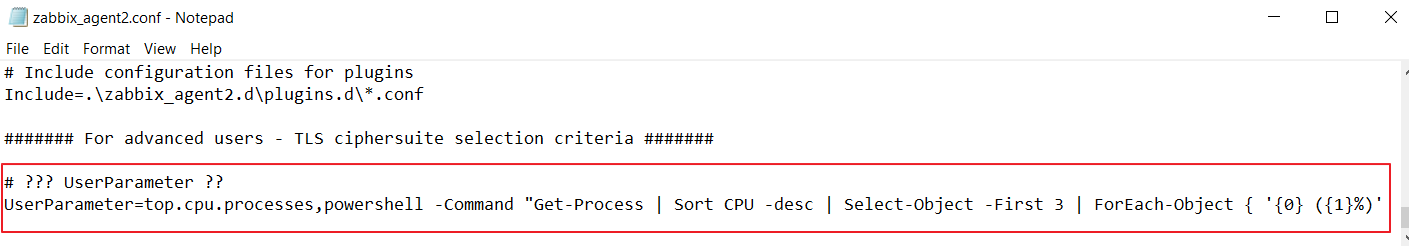
Zabbix Agent 설정 : PowerShell로 상위 CPU 점유 프로세스를 텍스트 형태로 반환하는 문구
아래와 같은 PowerShell 커맨드를 zabbix_agent2.conf에 추가해 줍니다.
설정 파일 경로: C:\Program Files\Zabbix Agent 2\zabbix_agent2.conf
UserParameter=top.cpu.processes,powershell -command "Get-Process | Sort CPU -Descending | Select -First 3 | ForEach { '$($_.ProcessName) ($($_.CPU)%)' }"Server=10.0.0.4 ServerActive=10.0.0.4 Hostname=Windows-server설정 후에는 Zabbix Agent 2 서비스를 재시작해야 반영됩니다.
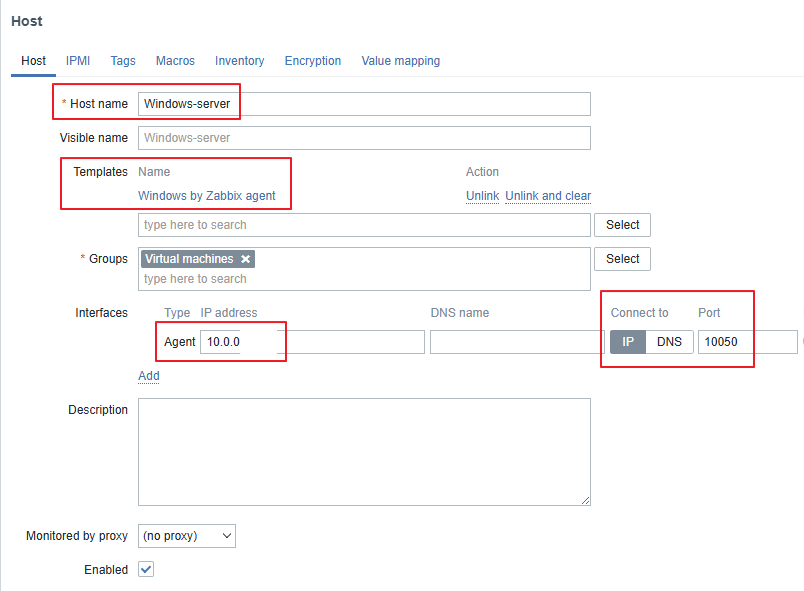
3. Zabbix 웹 UI에서 Host 등록
-
Host Name: (zabbix_agent2.conf에서 설정했던 Hostname)
-
IP: (Clinet IP)
-
Port: 10050 (기본 Port)
-
Template: Windows by Zabbix agent
경로 : Configuration > Hosts > Create Host
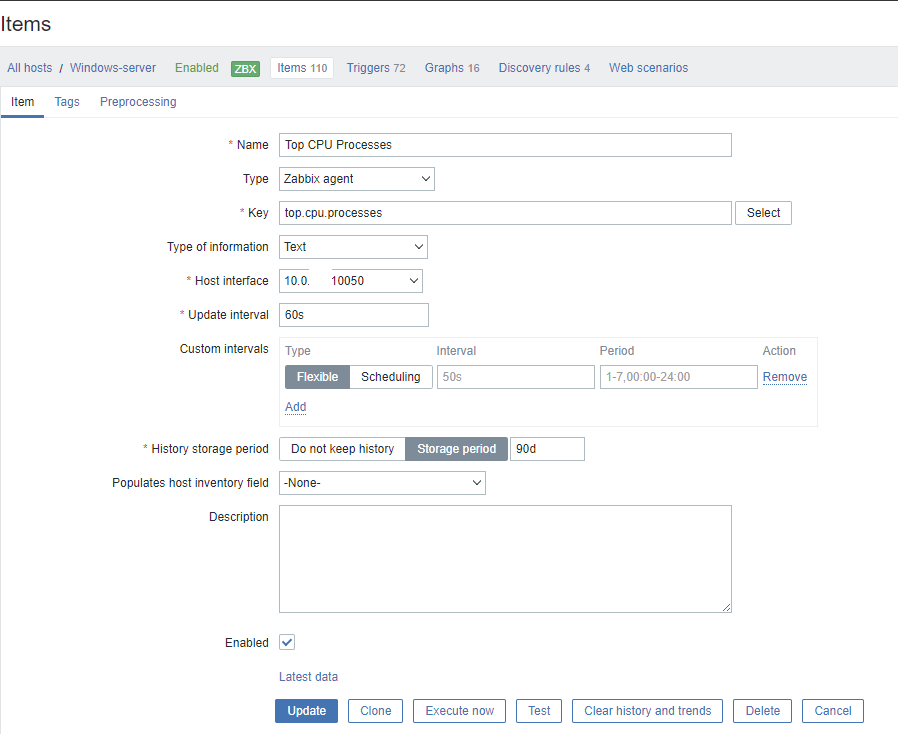
4. Item 생성
Item을 추가해 Zabbix가 PowerShell 결과를 가져올 수 있게 합니다.
-
Name: (Top CPU Processes)
-
Type: Zabbix agent
-
Key: top.cpu.processes
-
Type of information: Text
-
host inferface : (client ip:10050)
-
Update interval: 60s
-
History storage period: 예: 90d
경로 : Configuration > Hosts > Windows-server > Items
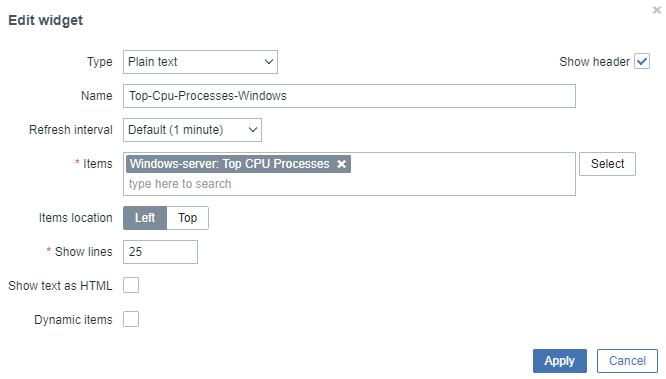
5. 대시보드에 시각화 추가
-
Name: Top-Cpu-Processes-Windows
-
Type: Plain text
-
Items: Windows-server: Top CPU Processes
-
Show lines: 25
경로 : Monitoring > Dashboard > Global view > edit dashboard > add
6. 대시보드 결과
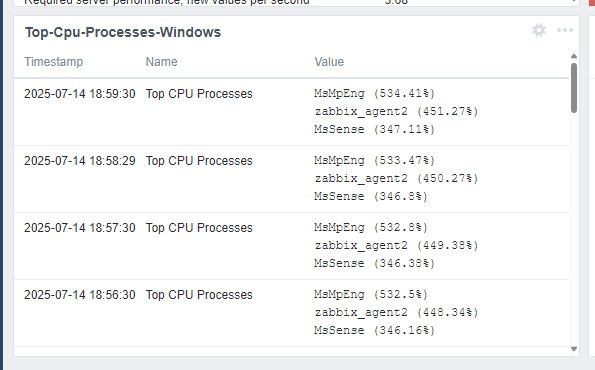
이렇게 시간별 Top cpu를 차지하는 프로세스를 가져올 수 있었다.
이 방법으로 어떤 대시보드를 만들 수 있을지 생각해봐야겠다.