Cluster
클러스터는 데이터를 유사한 특성을 가진 그룹으로 나누는 것
각 클러스터 안의 데이터는 서로 비슷하며, 다른 클러스터와는 차이가 나도록 설계
클러스터링은 비지도 학습(Unsupervised Learning) 알고리즘 중 하나로
데이터의 숨겨진 구조를 이해하거나 분류 작업에 도움을 줄 때 사용
코드
# 기본 라이브러리 불러오기
import pandas as pd
import numpy as np
import matplotlib.pyplot as plt
import seaborn as sns
from sklearn.cluster import KMeans
%matplotlib inline
# 보증금(만원),월세(만원) 단위 맞추기
train['보증금(만원)'] = train['보증금'] / 10000
train['월세(만원)'] = train['월세'] / 10000
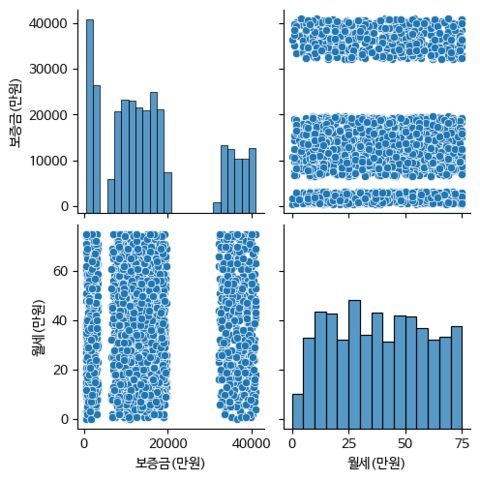
# 보증금(만원), 월세(만원)만 새로운 데이터 만들기
security_monthly_rent = train[['보증금(만원)','월세(만원)']]
# 군집화 모델 설정 및 학습
kmeans = KMeans(n_clusters = 5) # 군집화 개수 5로 설정(임의의 값)
kmeans.fit(security_monthly_rent)
# 클러스터 레이블 추가
security_monthly_rent['cluster'] = kmeans.labels_ # 데이터프레임에 군집화 컬럼 추가
시각화
plt.scatter(security_monthly_rent['보증금(만원)'], security_monthly_rent['월세(만원)'], c= security_monthly_rent['cluster'], cmap='viridis', s= 100)
plt.scatter(kmeans.cluster_centers_[:, 0], kmeans.cluster_centers_[:,1], c='red',marker='X', s=200,
label = '무게중심')
plt.title('보증금과 월세의 KMeans Clustering')
plt.xlabel('보증금(만원)')
plt.ylabel('월세(만원)')
plt.legend()
plt.show()
None시각화
이건 블루베리 생크림 케이크 같다. 누가 생크림 왕창 발라놓은 듯한 케이크 너낌..
아니 근데 어쩜 아무리 인라인으로 만들었다 해도 이렇게까지 상관관계가 안보이게 나올 수 있지..?!?!?
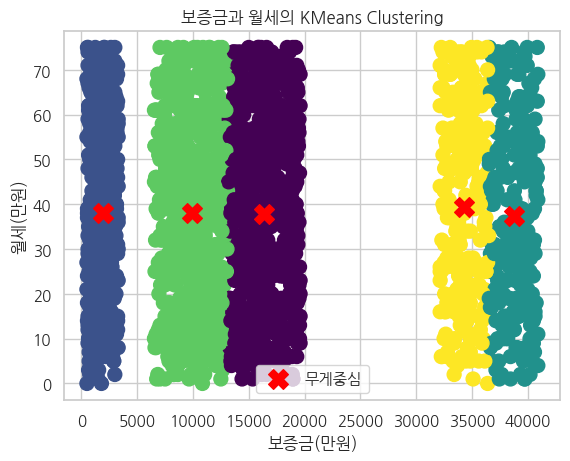
뭔가 곰팡이 핀 케이크가 되어버렸다.. 이게 맞나..?
보완할 점 by 튜터님
- 현재 군집화를 얼마나 잘 해서 결측치를 잘 채우느냐가 중요한 것이 아님
- 대신 n_cluster에 임의의 값을 넣어보며 기본 랜덤포레스트 모델을 변형시키며 돌려보고 최대한의 효율을 내는 것이 중요함
- 일단 랜덤포레스트 모델을 만들어서 해보라..!!!
KMeans
K-Means는 클러스터링을 수행하는 대표적인 알고리즘
데이터를 K개의 클러스터로 나누고 각 클러스터 중심(centroid)과 데이터 간의 거리를 최소화하는 방식으로 작동
알고리즘 동작 과정
1. K 개의 클러스터 중심 초기화
- 랜덤하게 K개의 초기 중심(centroid)을 선택
2. 클러스터 할당 - 각 데이터 포인트를 가장 가까운 중심에 할당하여 클러스터를 형성
3. 중심 업데이트 - 클러스터에 속한 데이터 포인트들의 평균값으로 중심을 업데이트
4. 반복 - 클러스터 할당과 중심 업데이트를 반복
- 중심이 변하지 않거나 지정한 반복 횟수에 도달하면 종료
K-Means 주요 특징
- 입력값: 클러스터 개수 를 사용자가 미리 지정
- 거리 계산: 일반적으로 유클리디안 거리(Euclidean Distance)를 사용
- 중심의 이동: 중심은 클러스터에 포함된 데이터 포인트들의 평균값
- 종료 조건:
- 클러스터의 중심이 더 이상 변화하지 않을 때
- 설정된 최대 반복 횟수에 도달했을 때
K-Means의 장단점
장점
- 간단하고 빠름
- 구현이 간단하며 대규모 데이터에도 빠르게 동작
- 효율적
- 데이터가 클러스터 중심에 밀집된 경우 좋은 결과를 냄
- 해석이 쉬움
- 결과가 직관적이며 시각화하기 쉬움
단점
- 클러스터 개수()를 지정해야 함
- 적절한 값을 찾는 것이 어려움
- 이를 위해 엘보우 방법(Elbow Method) 등을 사용
- 초기 중심값에 민감
- 초기 중심값에 따라 결과가 달라질 수 있음
- 이를 완화하기 위해 여러 번 실행한 후 평균을 내는 방식(n_init 파라미터)을 사용
- 구형 클러스터에 적합
- 클러스터가 구형(spherical)이 아닌 경우 성능이 저하될 수 있음
- 노이즈와 이상치에 민감
- 이상치(outlier)가 있으면 중심값 계산에 큰 영향을 줌
K-Means 사용 사례
- 고객 세분화
- 고객의 구매 데이터를 기반으로 비슷한 소비 패턴을 가진 그룹으로 나눔
- 이미지 압축
- 이미지의 색상을 클러스터링하여 색상을 축소(압축)함
- 문서 분류
- 문서를 주제별로 그룹화
- 도시 계획
- 지리적 데이터를 기반으로 적절한 지역 클러스터링
K-Means의 주요 파라미터
n_clusters: 클러스터 개수init: 초기 중심값 설정 방법 (e.g., 'k-means++' 또는 'random')n_init: 초기 중심값 선택 반복 횟수 (기본값은 10)max_iter: 최대 반복 횟수random_state: 결과 재현성을 위해 랜덤 시드 설정
K-Means의 개선 알고리즘
- K-Medoids (PAM)
- 중심 대신 클러스터 내부의 실제 데이터 포인트를 대표로 사용
- 이상치에 더 강건함
- MiniBatchKMeans
- 대규모 데이터를 처리하기 위해 데이터의 일부를 사용하여 학습
- 계산 속도가 훨씬 빠름
- Spectral Clustering
- 비구형 데이터를 처리하는 데 적합
- DBSCAN
- 밀도 기반 클러스터링. 클러스터 개수를 지정하지 않아도 됨
오늘치 끝!

SQL, Python, Code Kata