0. Intro
다양한 비즈니스 문제들을 데이터사이언스 측면에서 어떻게 해결하면 좋을지 생각해보자.
1. From Business Problems to Data Mining Tasks
1.1. Classification and class probability estimation(분류와 계층확률 추정)
Classification and class probability estimation(분류와 계층확률추정) attempt to predict, for each individual in a population, which of a small set of classes this individual belongs to
Among all the customers of MegaTelCo, which are likely to respond to a given offer?
① Classification
Given a new individual, determines which class that individual belongs to(어디에 속할지)
② Class Probability estimation
A scoring model applied to an individual produces a score representing the probability that individual belongs to each class. (각 클래스에 속할 확률이 얼마일지)
1.2. Regression(회귀분석)
• Regression(회귀분석), “value estimation”, attempts to estimate or predict, for each individual, the numerical value of some variable for that individual
ex) How much will a given customer use the service?
1.3. Similarity matching(유사도 매칭)
Similarity matching(유사도 매칭) attempts to ,identify similar individuals based on data known about them.(개인들간의 유사성을 확인하는것)
👉 marketing에서 많이 사용함.
• Similarity matching is the basis for one of the most popular methods for making product recommendations (finding people who are similar to you in terms of the products they have likely or have purchased )
ex) "님이랑 비슷한 사람이 이거 샀는데, 님도 사실? 이런 것임"
1.4. Clustering(군집화)
Clustering(군집화) attempts to group individuals in a population together y their similarity, but not driven by any specific purpose
Do our customers form natural groups or segment?
ex) 나이별 그룹 소비패턴그룹 등등
1.5. Co-occurrence grouping(동시발생 그룹화,장바구니분석이라고도 불림)
Co-occurrence grouping(동시발생 그룹화), also known as frequent itemset mining, association rule discovery, and market-basket analysis, attempts to find associations between entities based on transactions involving them.(거래정보_transaction를 바탕으로 여러 개체 간의 연관성을 찾아내는 방법)
What items are commonly purchased together?
ex) 사람들이 빵과 우유를 같이 사더라, 계란을 살때 수건도 사더라 같은거처럼, 어떤 상품들이 자주 같이 구매되는지를 파악해 묶음 상품 추천에 활용될 수 있다.
1.6. Profiling(프로파일링)
Profiling(프로파일링), also known as behavior description, attempts to characterize the typical behavior of an individual, group, or population
ex) What is the typical cell phone usage of this customer segment?
1.7. Link prediction(연결 예측)
Link prediction(연결 예측) attempts to predict connections between data items, usually by suggesting that a link should be exist, and possibly also estimating the strength of the link
For recommending movies to customers one can think of a graph between customers and the movies they’ve watched or rated
1.8. Data reduction(데이터 축소)
Data reduction(데이터 축소) attempts to take a large set of data and replace it with smaller set of data that contains much of the important information in the larger set.
=
1.9. Causal modeling(인과 모델링)
Causal modeling(인과 모델링) attempts to help us understand what events or actions actually influence others(어떤 사건이나 행동이 실제로 다른 요소에 영향을 미치는지 이해하는데 도움)
Was this because the advertisements influenced the consumers to purchase?
ex)정말 광고가 매출향상에 영향을 줘서, 매출이 향상되었나?? 가설검정을 할 수 있는 것이다.
광고를 본 그룹과 아닌 그룹을 나누어 비교하여 광고가 매출에 영향을 직접적으로 미쳤는지 테스트 <- 흔히 A/B test 라고 함.
2. Supervised vs Unsupervised Methods
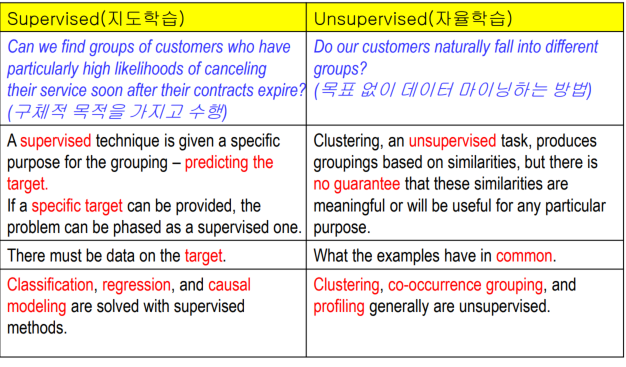
요약하면, 지도학습은 타겟이 있고 자율학습은 타겟이 없음.
3. Regression vs classification
Regression involves a numeric target while classification involves a categorical (often binary) target
ex) Classification question
• Will this customer purchasing service S1 if given incentive I?
• Which service package (S1, S2, or none) will a customer likely purchase if given incentive I
ex) Regression question
How much will this customer use the service?
4. Data Mining and Its Results
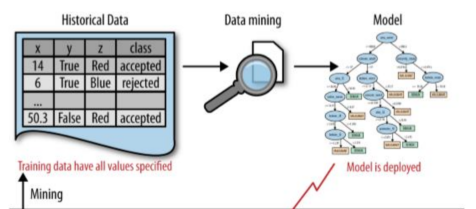
In mining phase, data mining produces the probability estimation model from historical data.
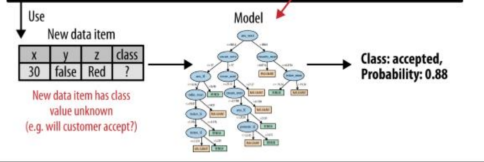
In use phase,the model is applied to a new, unseen case and it generates a probability estimate for it.
CRISP -DM(Cross Industry Standard Process for Data Mining)
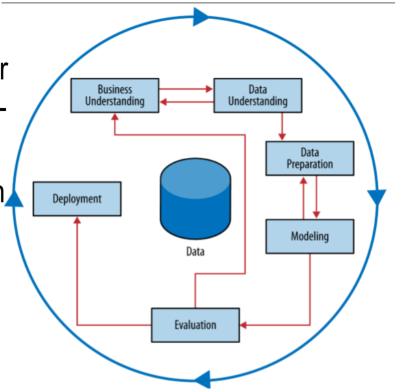
Cross Industry Standard Process for Data Mining
비즈니스(도메인)에 대한 이해 -> 데이터에 대한 이해 -> 데이터 준비/전처리 -> 모델링 -> 평가 -> 배포
4.1 Business Understanding
-
Initially, it is vital to understand the problem to be solved.
-
The initial formulation may not be complete or optimal so multiple iterationsmay be necessary for an acceptable solution formulation to appear
-
Structuring the problem such that one or more sub problems involves building models for classification, regression, probability estimation, and so on
-
In this first stage, the design team should think carefully about the use scenario.
4.2 Data Understanding
- A critical part of the data understanding phase is estimating the costs and benefits of each data source and deciding whether further investment is merited.
어떤 데이터는 무료이지만 , 다른 데이터는 유료일 수 있기 때문에 수집에 대한 비용과 노력을 생각해봐야 한다.
Credit card fraud vs. Medicare fraud
| Criteria | Credit Card Fraud | Medicare Fraud |
|---|---|---|
| Data Labeling | Nearly all fraud is identified and reliably labeled | No reliable target variable indicating fraud |
| Fraud Perpetrators | Distinct from legitimate users | Subset of legitimate users |
| Suitable Approach | Supervised technique | Unsupervised technique |
| Detection Methods | Classification algorithms (e.g. logistic regression, decision trees) | Profiling, clustering, anomaly detection, co-occurrence grouping |
| Data Characteristics | Binary labels (fraud or legitimate) | Unlabeled data |
| Model Training | Can train on historical labeled data | Must infer patterns without explicit fraud labels |
| Fraud Identification | Direct classification of transactions | Indirect detection of anomalous patterns |
👉 같은 fraud detection 이라하더라도 데이터에 따라서 supervised, unsupervised로 나뉘고 모델training 도 달라진다. 그러므로, 데이터에 대한 이해는 필수적이다.
4.3 Data Preparation
Data Type
-
Some data mining techniques are designed for symbolic and categorical data, while others handle only numeric values
-
converting data to tabular format, removing or inferring missing values, and converting data to different types. (format 바꾸기, 결측치 제거, 다른 dtype로 바꾸기.)
4.4 Modeling
- The output of modeling is some sort of model or pattern capturing regularities(규칙적인 패턴) in the data
-> The modeling stage is the primary place where data mining techniques are applied to the data.
4.5 Evaluation
We would like to have confidence that the models and patterns extracted from the data are true regularities and not just idiosyncrasies or sample anomalies
The evaluation stage also serves to help ensure that the model satisfies the original business goals.
• The model should be comprehensive A comprehensive evaluation framework is important
Validity vs Reality
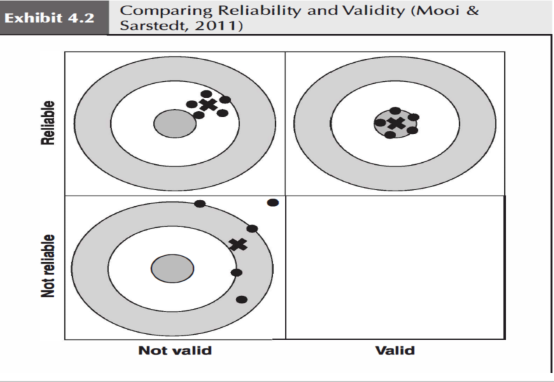
validity(타당도) 는 true 값에 얼마나 잘 맞췄냐(true에 얼마나 가까운지를)
reality(신뢰도) 는 측정결과가 얼마나 일관되게 분포되어 있는지를 나타냄.
4.6 Deployment
- Deploying a model into a production system typically requires that the model be recoded for the production environment, usually for greater speed or compatibility with an existing system.
(모델을 프로덕션 시스템에 배포하려면 일반적으로 더 빠른 속도나 기존 시스템과의 호환성을 위해 모델을 프로덕션 환경에 맞게 재코딩해야 합니다.)
=> deploy 를 하기 위해서 많은 자동화 개발 도구들이 있다. 특히 deploy 할때 나중에 업데이트 호환성을 위해 docker, kubernetics, microservices 등을 사용하기도 한다. 그래서 개발할때는 반드시 버전등을 확인하고 매번 기록할 필요가 있다. 치유보다는 예방이다.!
5. Implications for Managing the Data Science Team
-
Data mining projects are often treated and managed as engineering projects
-
This can be mistake because data mining is an exploratory undertaking closer to research and development than it is to engineering
(DM은 엔지니어링보다 R&D에 가깝다.)
6. Other Analytics Techniques and Technologies
Six groups of related analytic technologies
- Statistics
- Database Querying
- Data Warehousing
- Regression Analysis
- Machine Learning and Data Mining
- Data Mining
Data Mining focuses on the automated search for knowledge, patterns, or regularities from data
An important skill for a business analyst is to be able to recognize what sort of analytic technique is appropriate for addressing a particular problem.
6.1 Statistics
Summary statistics should be chosen with close attention to the business problem to be solved, and also with attention to the distribution of the data they are summarizing
-> 왜냐하면 데이터가 skewed 되어 있을 수 있기 때문에.(평균의 함정)
ex) 왜도(데이터의 비대칭성정도)
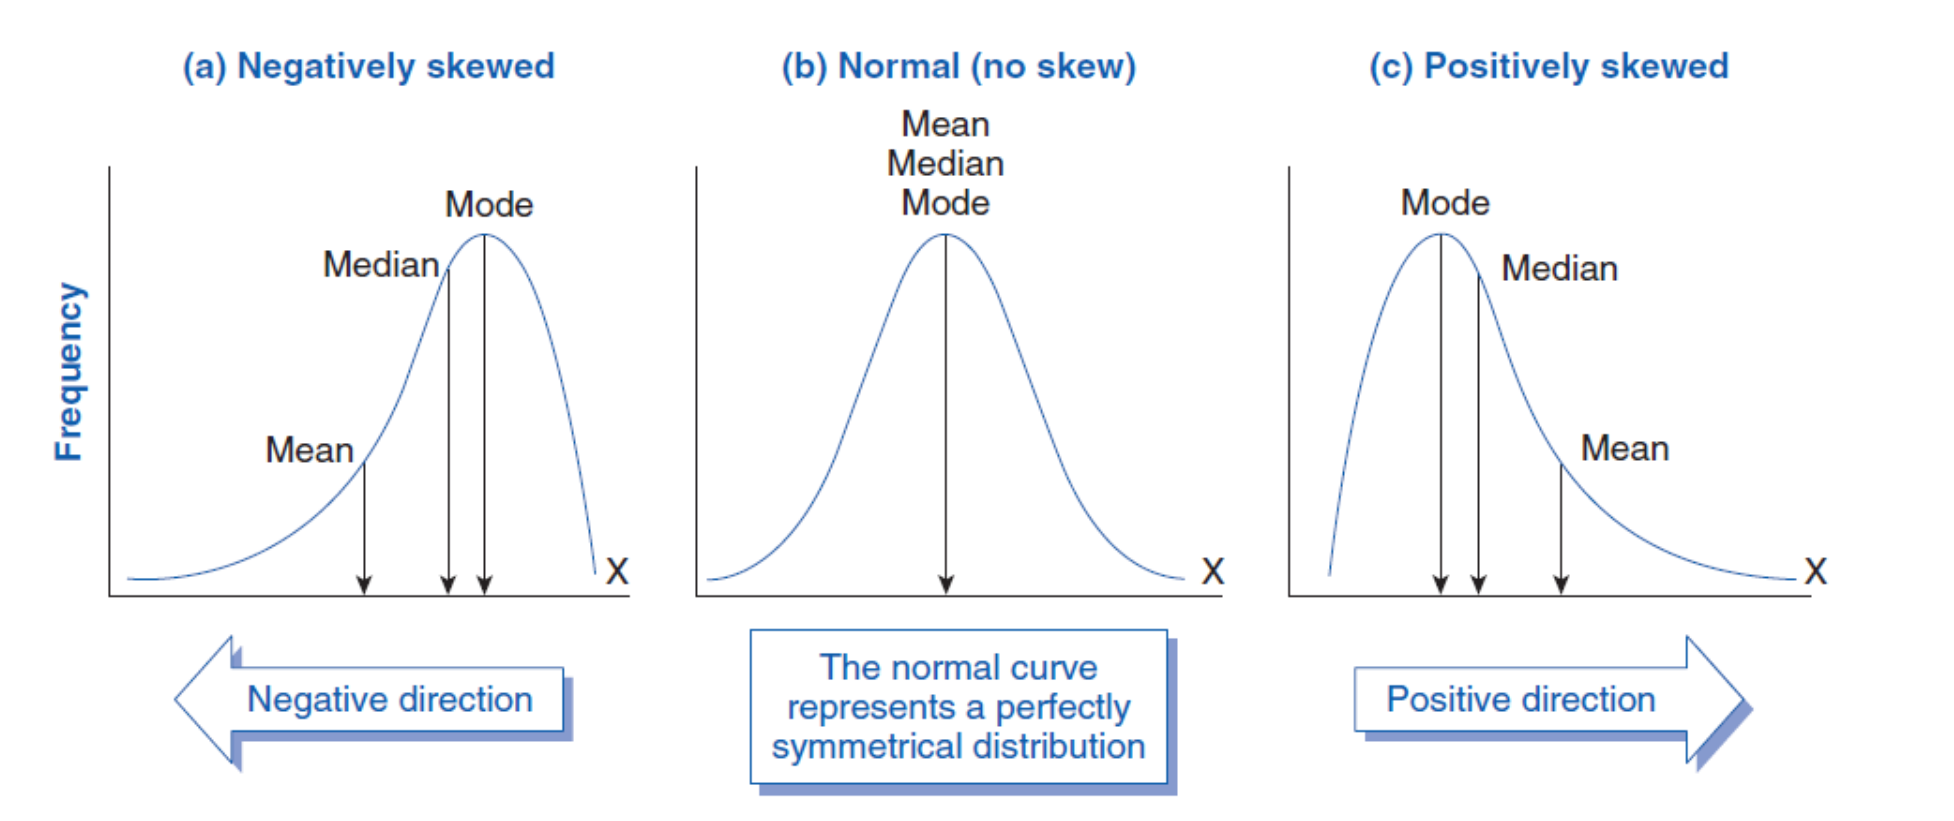
수식:
Statistics로 얻을 수 있는 것.
① Statistics helps us to understand different data distributions(데이터 분포) and what statistics(통계량) are appropriate to summarize each
②Statistics helps us understand how to use data to test hypotheses(가설검정) and to estimate the uncertainty of conclusions.
③Hypothesis testing can help determine whether an observed pattern is likely to be a valid, general regularity as opposed to a chance occurrence in some particular dataset (우연인지 아닌지 판별도구)
6.2 Database Querying
Database queries are appropriate when an analyst already have an idea of what might be an interesting subpopulation of the data, and wants to investigate this population or confirm a hypothesis about it (데이터분석의 결과를 DB에서 검색)
👉데이터의 특정 하위 집단에 대해 흥미로운 가설이나 예상을 가지고 있을때 적합.
ex)
SELECT * FROM CUSTOMERS WHERE AGE > 45 AND SEX = ‘M’ AND
DOMICILE = ‘ME’;
6.3 Data Warehousing
Stores current and historical data from many core operational transaction systems
Consolidates and standardizes information for use across enterprise, but data cannot be altered
Data Warehouse Framework
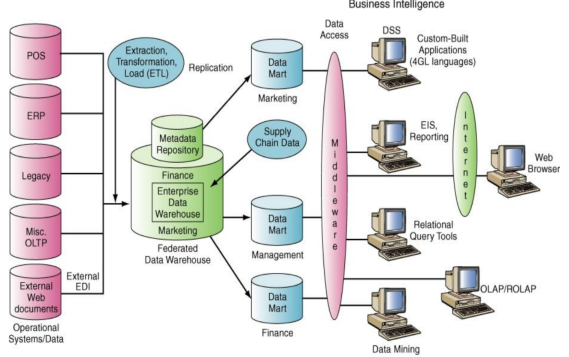
저장된 데이터를 추출하고, 정리해서 결론 추출.
6.4 Regression Analysis
Regression analysis will involve estimating or predicting values for cases that are not in the analyzed data set.
- We are less interested in digging into the reasons for churn in a particular historical set of data, and more interested in predicting which customers who have not yet left would be the best to target to reduce future churn
-> 어떤 결과가 '왜' 나왔는지 보다, 어떤 결과를 잘 맞췄는지가 더 중요.
6.5 Machine Learning and Data Mining
| 특성 | 기계 학습 (ML) | 데이터 마이닝 (DM) |
|---|---|---|
| 목표 지향성 | 자율적인 의사결정과 행동이 가능한 지능형 에이전트 생성 | 대규모 데이터셋에서 패턴 발견 및 유용한 정보 추출 |
| 인지적 측면 | 인간과 유사한 학습 및 의사결정 과정 모방 | 인지 과정이나 의사결정 능력에 관심 없음 |
| 지식의 적용 | 학습된 지식을 환경에서 추론하고 행동하는 데 적용 | 지식 추출에 집중, 의사결정 적용에 덜 관심 |
| 자율성과 적응 | 최소한의 인간 개입으로 성능 향상 및 적응 가능한 시스템 목표 | 패턴 해석 및 적용에 더 많은 인간 개입 필요 |
| 학습의 범위 | 예시로부터 일반화 및 새로운 상황 적응 능력 포함 | 기존 데이터 내 특정 패턴 찾기에 집중 |
6.6 Answering Business Questions with These Techniques
Q1) Who are the most profitable customers?
-> – If “profitable” can be defined clearly based on existing data, this is a straightforward database query
Q2) Is there really a difference between the profitable customers and the average customer?
Statistical hypothesis testing would be used to confirm or disconfirm the hypothesis that there is a difference in value to the company between the profitable customers and the average customer
Q3)who really are these customers? Can I characterize them?
This is the realm of data science, using data mining techniques for automated pattern finding.
Q4)Will some particular new customer be profitable? How much revenue should I expect this customer to generate?
These questions could be addressed by data mining techniques that examine historical customer records and produce predictive models of profitability.