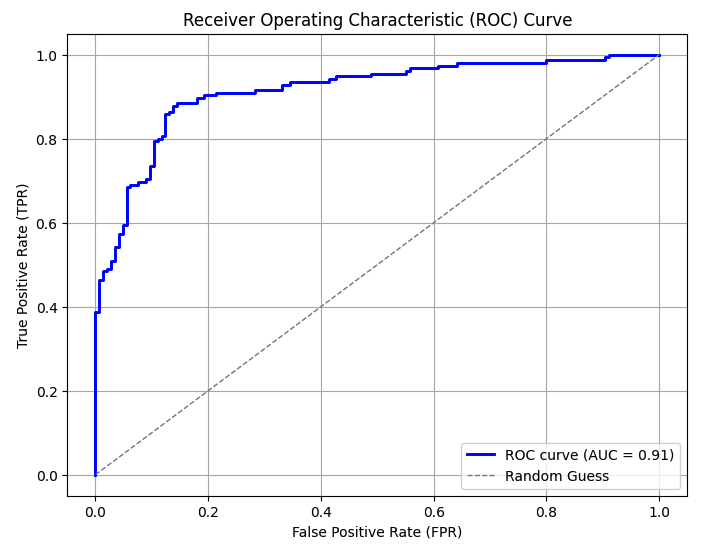
ROC(Receiver Operation Characteristic Curve)
머신러닝의 이진분류 모델의 예측성능 판단하는 중요한 평가지표
위양성률(FPR)이 변할때 재현율(TPR)이 어떻게 변하는지를 나타내는 곡선이다
직선에 가까울수록 성능이 떨어지고 멀수록 성능이 좋다
임계값을 1부터 0까지 변화시켜가면서 FPR을 구해 FPR변화에 따른 TPR 값을 구한다
import numpy as np
import matplotlib.pyplot as plt
from sklearn.metrics import roc_curve, auc
from sklearn.model_selection import train_test_split
from sklearn.linear_model import LogisticRegression
from sklearn.datasets import make_classification

# 1. 샘플 데이터 생성 (이진 분류)
X, y = make_classification(
    n_samples=1000,
    n_features=20,
    n_classes=2,
    random_state=42
)

# 2. 데이터 분할
X_train, X_test, y_train, y_test = train_test_split(X, y, test_size=0.3, random_state=42)

# 3. 로지스틱 회귀 모델 학습
model = LogisticRegression(solver='liblinear', random_state=42)
model.fit(X_train, y_train)

# 4. 예측 확률 계산
y_prob = model.predict_proba(X_test)[:, 1]  # 양성 클래스 확률

# 5. FPR, TPR, 임계값 계산
fpr, tpr, thresholds = roc_curve(y_test, y_prob)

# 6. AUC 계산
roc_auc = auc(fpr, tpr)

# 7. ROC 곡선 시각화
plt.figure(figsize=(8, 6))
plt.plot(fpr, tpr, color='blue', lw=2, label=f'ROC curve (AUC = {roc_auc:.2f})')
plt.plot([0, 1], [0, 1], color='gray', lw=1, linestyle='--', label='Random Guess')
plt.xlabel('False Positive Rate (FPR)')
plt.ylabel('True Positive Rate (TPR)')
plt.title('Receiver Operating Characteristic (ROC) Curve')
plt.legend(loc='lower right')
plt.grid()
plt.show()
# AUC = 0.9142157953281423
분류의 성능지표는 ROC 곡선의 면적에 기반한 AUC로 사용한다
1에 가까울수록 좋은 수치이다
FPR 이작은 상태에서 큰 TPR을 가질수록 AUC 값이 커진다

hi!