
실습 : 기상청 날씨 정보 시각화하기
- 먼저 스크래핑에 필요한 라이브러리를 불러옵니다.
from selenium import webdriver
from selenium.webdriver import ActionChains
from webdriver_manager.chrome import ChromeDriverManager
from selenium.webdriver.common.actions.action_builder import ActionBuilder
from selenium.webdriver import Keys, ActionChains
from selenium.webdriver.chrome.service import Service
from selenium.webdriver.common.by import By
driver를 이용해 기상청 날씨 데이터를 가져옵니다.
이때 동적페이지의 경우 시간을 지연시켜 대기합니다.
데이터의 타입 또한 시각화에 적합한int형으로 변환합니다.driver = webdriver.Chrome(service = Service(ChromeDriverManager().install())) driver.get("https://www.weather.go.kr/w/weather/forecast/short-term.do") driver.implicitly_wait(100) temps = driver.find_element(By.ID, "my-tchart").text temps = [int(i) for i in temps.replace("℃","").split("\n")]
- 받아온 데이터를 통해 꺾은선 그래프(Line plot)를 그려봅시다.
# x = Elapsed Time(0~len(temperatures)
# y = temperatures

import seaborn as sns
sns.lineplot(
    x = [i for i in range(len(temps))],
    y = temps
)
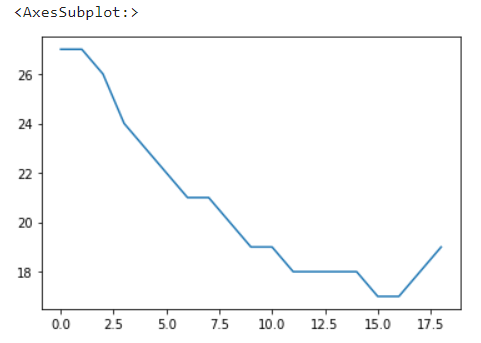
- 축의 범위 등을 조절하여 가독성을 높여줍니다.
import matplotlib.pyplot as plt
import seaborn as sns

plt.ylim(min(temps) - 2, max(temps) + 2)
plt.title("Expected Temperature from now on")

sns.lineplot(
    x = [i for i in range(len(temps))],
    y = temps
)

plt.show()


AI Tensorflow Python