에뮬레이터 프로그램 개발 중 ...
ChartDirector - Realtime Multi Chart를 활용한 데이터 시각화를 개발 중이다.
※※※※※※※※※※※※※※※※※※※※※※※※※※※※※※※※※※※※
해당 라이브러리는 ChartDirector 사이트에 C++(MFC), C#(WPF) 등 여러 코드로 구현된 수십가지 차트의 소스로 다운로드 받아볼 수 있으며,
학습용은(비상업용) 무료인 것으로 알고있다.
<<<상업용(재배포용?)으로 사용할때는 별도 라이센스 필요.>>>
※※※※※※※※※※※※※※※※※※※※※※※※※※※※※※※※※※※※
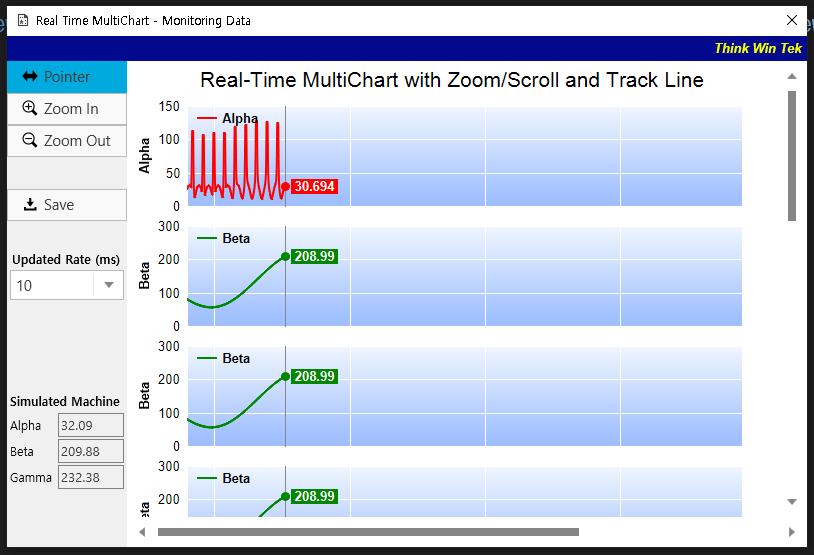
대충 이런 모습
이때, 한가지 이상한 점을 발견하게 되는데...
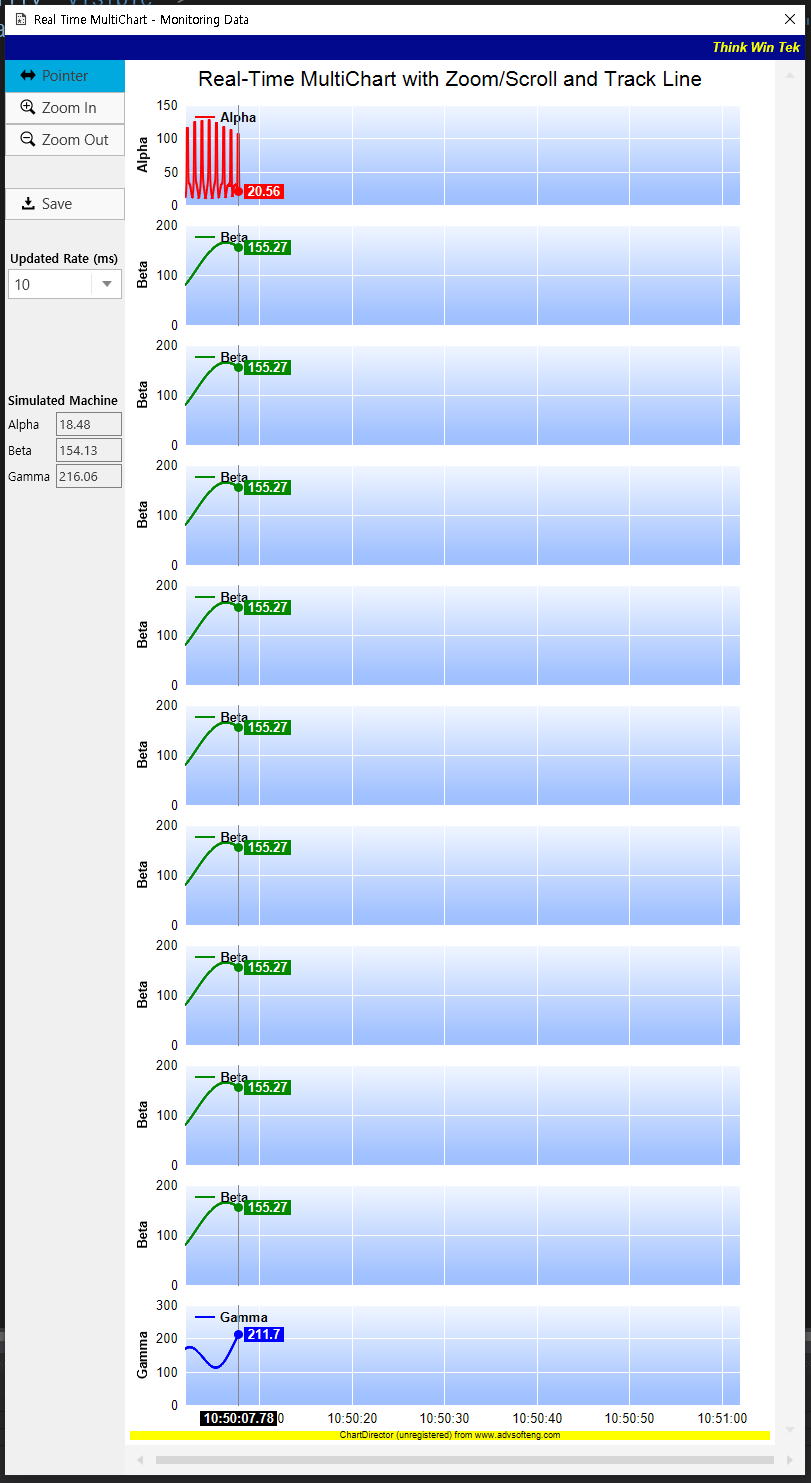
엄...
(긴 이미지 죄송합니다...)
그렇다. 해당 윈도우 창은 XAML상에 Max Width, Height가 지정되어 있지 않아서... 그래프를 늘리면 무한정 세로로 길어지도록 짜여져 있는 것이다.
※※※※※※※※※※※※※※※※※※※※※※※※※※※※※※※※※※※※
우선 소스를 받았을 때 저렇게 여러 차트를 만드는 법에 대한 소스를 간단히 다뤄보겠다.
        // Draw the MultiChart
        // 다중 차트를 그림.
        void drawMultiChart(WPFChartViewer viewer)
        {
            // The MultiChart contains 3 charts. The x-axis is only visible on the last chart, so we only need to reserve space for 1 x-axis.
            // 다중 차트에는 3개의 차트가 포함됨. x축은 마지막 차트에만 표시되므로 1개의 x축 공간만 예약.
            MultiChart m = new MultiChart(640, 30 + 21 * chartHeight + xAxisHeight);
            m.addTitle("Real-Time MultiChart with Zoom/Scroll and Track Line", "Arial", 16);

            // This first chart is responsible for setting up the x-axis scale.
            // 첫 번째 차트는 x축 척도 설정을 담당.
            m.addChart(0, 30, drawXYChart(viewer, dataSeriesA, "Alpha", 0xff0000, null, false));
            Axis xAxisScale = ((XYChart)m.getChart(0)).xAxis();

            // All other charts synchronize their x-axes with that of the first chart.
            // 다른 모든 차트는 첫 번째 차트의 x축과 동기화.
            for (int i = 1; i < 20; i++)
            {
                m.addChart(0, 30 + chartHeight*i, drawXYChart(viewer, dataSeriesB, "Beta", 0x008800,
                    xAxisScale, false));
            }

            // The last chart displays the x-axis.
            // 마지막 차트는 x축을 출력.
            m.addChart(0, 30 + chartHeight * 20, drawXYChart(viewer, dataSeriesC, "Gamma", 0x0000ff,
                xAxisScale, true));

            // We need to update the track line too. If the mouse is moving on the chart, the track line will be updated in MouseMovePlotArea. Otherwise, we need to update the track line here.
            // 선로 업데이트. 마우스가 차트에서 이동 중이면 마우스 이동 플롯 영역에서 트랙 라인이 업데이트 됨. 그렇지 않으면 여기서 선로를 업데이트 함.
            if (!viewer.IsInMouseMoveEvent)
                drawMultiTrackLine(m, (null == viewer.Chart) ? m.getWidth() : viewer.PlotAreaMouseX);

            // Set the combined plot area to be the bounding box of the plot areas of the 3 charts
            // 결합된 플롯 영역을 세 개의 차트에 있는 플롯 영역의 경계 상자로 설정.
            m.setMainChart(m);

            // Display the chart
            // 차트 표시
            viewer.Chart = m;
        }
이 부분에 있는 멀티차트에
-
MultiChart m = new MultiChart(640, 30 + 21 * chartHeight + xAxisHeight);
안에 인자값을 Max Chart의 갯수로 수정하고, -
for (int i = 1; i < 20; i++)
{
m.addChart(0, 30 + chartHeight*i, drawXYChart(viewer, dataSeriesB, "Beta", 0x008800,
xAxisScale, false));
}
for문을 사용하여 원하는 갯수-1개 만큼의 중간열에 들어갈 그래프들을 생성(m.addChart()) -
m.addChart(0, 30 + chartHeight * 20, drawXYChart(viewer, dataSeriesC, "Gamma", 0x0000ff, xAxisScale, true));
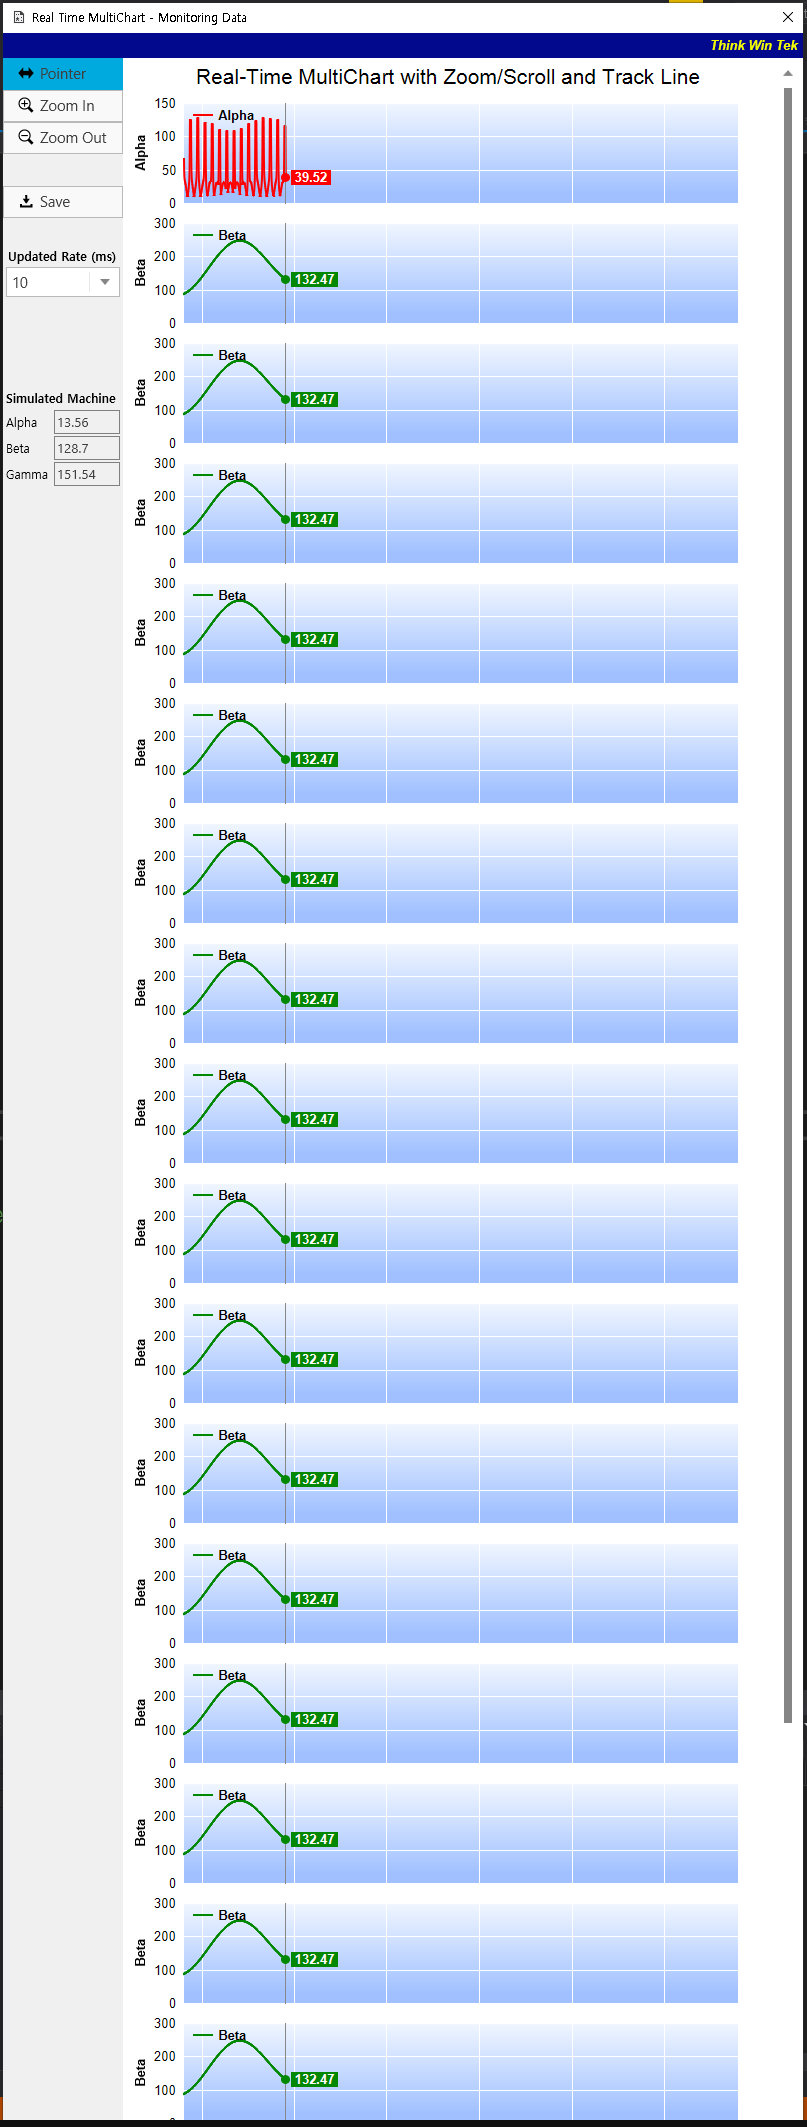
마지막 멀티 차트를 생성하고자하는 차트의 갯수 (저기선 20)로 수정하면 완료...
총 20개의 멀티 차트가 생성된다.
※※※※※※※※※※※※※※※※※※※※※※※※※※※※※※※※※※※※
각설하고, 그렇다면 우리는 User Friendly를 위하여 해당 윈도우창을 사용자가 보기에 편하도록 수정해야된다.
※※※※※※※※※※※※※※※※※※※※※※※※※※※※※※※※※※※※
먼저 위 길쭉한 사진처럼 늘어나는 차트에 따라 무한히 내리꼽는 윈도우 창에 제약을 가하기 위해
윈도우 창에 Max 값을 설정한다.
Title="Real Time MultiChart - Monitoring Data " SizeToContent="WidthAndHeight" ResizeMode="NoResize" Loaded="Window_Loaded" Width="850" Height="550" MaxWidth="850" MaxHeight="550"↑ Max Width="850" MaxHeight="550" 으로 고정
이어서 XAML에서 기본으로 제공하는 스크롤뷰어(ScrollViewer)를 사용하여 윈도우창 내에 차트 뷰어에 자동으로 스크롤이 생기게끔 설정한다.
         <ScrollViewer VerticalScrollBarVisibility="Visible" >
            <ChartDirector:WPFChartViewer x:Name="WPFChartViewer1" DockPanel.Dock="Top" Width="640" Height="415" Margin="5" ViewPortChanged="WPFChartViewer1_ViewPortChanged" MouseMovePlotArea="WPFChartViewer1_MouseMovePlotArea" />
</ScrollViewer>- 여기서 ScrollViewer 값 내 "VerticalScrollBarVisibility"는 "수직" 스크롤 바를 의미한다.
- 1번의 값이 Visible일 경우 스크롤은 항상 보여지게 된다. Auto로 변경한다면 고정된 윈도우 창의 수치보다 긴 값이 출력될 때 자동으로 스크롤 바가 생기도록 설정 가능. Default 값은 Disable이다.
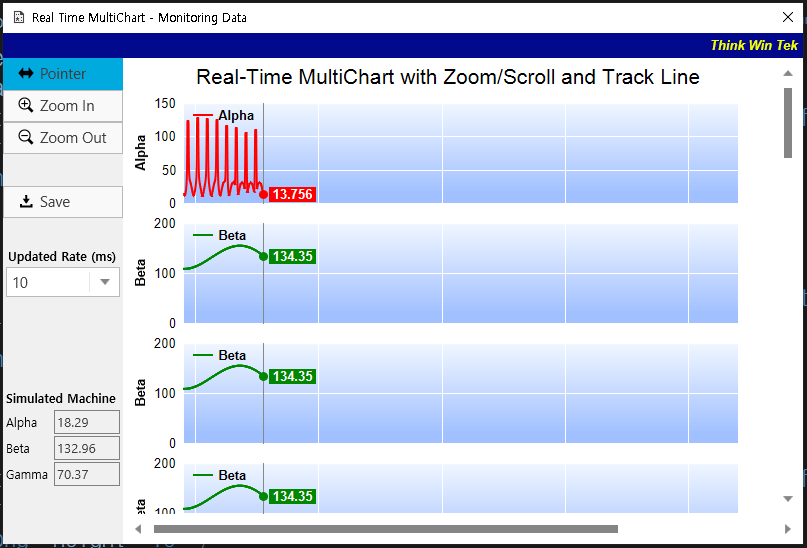
코드를 실행하면 우측에 스크롤 바가 생성된 것을 볼 수 있다.