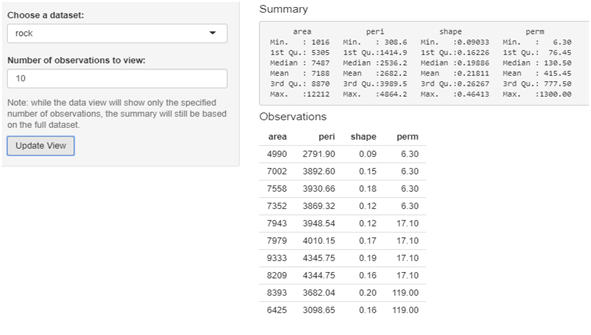
데이터셋을 선택하고, 표시할 행의 개수를 입력하면 그 결과를 보여주는 프로그램
전체 코드
library(shiny)

# Define UI for dataset viewer app ----
ui <- fluidPage(

  # App title ----
  titlePanel("More Widgets"),

  # Sidebar layout with input and output definitions ----
  sidebarLayout(

    # Sidebar panel for inputs ----
    sidebarPanel(

      # Input: Select a dataset ----
      selectInput("dataset", "Choose a dataset:",
                  choices = c("rock", "pressure", "cars")),

      # Input: Specify the number of observations to view ----
      numericInput("obs", "Number of observations to view:", 10),

      # Include clarifying text ----
      helpText("Note: while the data view will show only the specified",
               "number of observations, the summary will still be based",
               "on the full dataset."),

      # Input: actionButton() to defer the rendering of output ----
      # until the user explicitly clicks the button (rather than
      # doing it immediately when inputs change). This is useful if
      # the computations required to render output are inordinately
      # time-consuming.
      actionButton("update", "Update View")

    ),

    # Main panel for displaying outputs ----
    mainPanel(

      # Output: Header + summary of distribution ----
      h4("Summary"),
      verbatimTextOutput("summary"),

      # Output: Header + table of distribution ----
      h4("Observations"),
      tableOutput("view")
    )

  )
)

# Define server logic to summarize and view selected dataset ----
server <- function(input, output) {

  # Return the requested dataset ----
  # Note that we use eventReactive() here, which depends on
  # input$update (the action button), so that the output is only
  # updated when the user clicks the button
  datasetInput <- eventReactive(input$update, {
    switch(input$dataset,
           "rock" = rock,
           "pressure" = pressure,
           "cars" = cars)
  }, ignoreNULL = FALSE)

  # Generate a summary of the dataset ----
  output$summary <- renderPrint({
    dataset <- datasetInput()
    summary(dataset)
  })

  # Show the first "n" observations ----
  # The use of isolate() is necessary because we don't want the table
  # to update whenever input$obs changes (only when the user clicks
  # the action button)
  output$view <- renderTable({
    head(datasetInput(), n = isolate(input$obs))
  })

}

# Create Shiny app ----
shinyApp(ui, server)
ui 코드 분석
ui <- fluidPage(

  titlePanel("More Widgets"),

  sidebarLayout(

    sidebarPanel(

      selectInput("dataset", "Choose a dataset:",
                  choices = c("rock", "pressure", "cars")),

      numericInput("obs", "Number of observations to view:", 10),

      helpText("Note: while the data view will show only the specified",
               "number of observations, the summary will still be based",
               "on the full dataset."),

      actionButton("update", "Update View")

    ),

    mainPanel(

      h4("Summary"),
      verbatimTextOutput("summary"),

      h4("Observations"),
      tableOutput("view")
    )

  )
)-
사용자의 환경에 맞게 자동으로 디스플레이를 조정해주는
fluidpage()함수 -
titlePanel() 함수를 이용해서 “More widgets”라는 제목을 붙임
-
ui 레이아웃으로
sidebarLayout()을 선택 -
사이드바패널에 들어갈 인풋함수로
selectInput()과numericInput()을 선정해서 사용자로부터 rock, pressure, cars라는 3개의 데이터셋에 대한 선택권과 몇 개의 결과를 볼 것인지에 대한 선택권을 제공 -
helpText()에는 앞으로 표시할 output인 Summary와 Observations의 차이에 대해 설명을 해주고 있는데 Observations는 사용자의 인풋에 따라 다른 결과를 제공하고 Summary는 사용자의 인풋에 상관없이 풀데이터셋의 요약을 표시하는 것이라고 설명해서 프로그램에 대한 사용자의 이해를 도움 -
actionButton()함수를 이용해서 사용자가 Update View라는 동작버튼을 눌렀을 때 update가 되도록 함 -
actionButton()함수는 사용자가 버튼을 명시적으로 클릭할 때까지(입력이 변경될 때 즉시 수행하는 것이 아니라) 출력 렌더링을 연기하기 위해서 사용하는데, 이는 출력을 렌더링하는데 필요한 계산이 지나치게 시간이 많이 걸리는 경우에 유용하다. -
메인패널에 들어갈 output함수들로는
verbatimTextOutput()과tableOutput()이 사용됐는데,verbatimTextOutput()함수로 summary를 표시하고tableOutput()으로 view를 표시하게 된다. -
h4()는 머리글을 추가하는 함수로서 각각에 "Summary"와 "Observation"이라는 머리글을 표시한다.
server 코드 분석
server <- function(input, output) {

  datasetInput <- eventReactive(input$update, {
    switch(input$dataset,
           "rock" = rock,
           "pressure" = pressure,
           "cars" = cars)
  }, ignoreNULL = FALSE)

  output$summary <- renderPrint({
    dataset <- datasetInput()
    summary(dataset)
  })

  output$view <- renderTable({
    head(datasetInput(), n = isolate(input$obs))
  })

}-
datasetinput이라는 객체는
eventReactive()라는 함수에 의해서 결정되는데, 이eventReactive()라는 함수는 update라는 input이 이루어졌을 때 (즉, 사용자가 Update View라는 동작버튼을 클릭했을 때) switch문을 수행한다 -
그래서 사용자가 rock을 선택했을 땐 샤이니 패키지에 내장된 rock이라는 dataset을 input으로 받고, pressure을 선택했을 땐 pressuer라는 데이터셋을, cars를 선택했을 땐 cars라는 데이터셋을 input으로 받는다
-
eventReactive()함수는 또 사용자로부터 아무 입력이 없을 때 동작에 영향을 미치는 ignoreNULL이라는 지표를 가지는데, ignoreNULL값이 TURE일 경우에는 사용자의 입력을 먼저 기다리는 경우에 사용되고 FALSE일 경우에는 일단 처음에 동작한 뒤, 추후에 사용자 입력을 받아서 반응하고자 하는 경우에 사용된다 -
다음은 ui에서 정의한
verbatimTextOutput()함수가 표시할 output인 summary 변수를 결정하는 부분인데, 먼저 dataset에datasetInput()을 호출해서 사용자로부터 받은 input을 집어넣고,summary()함수를 이용해서 요약을 한 뒤,renderPrint()함수를 통하여 ui의 summary에 결과를 텍스트 형식으로 반환한다 -
마지막으로 ui에서 정의한
tableOutput()함수가 표시할 output인 view를 결정하는 부분인데,head()함수를 이용해서 datasetInput()의 데이터셋을 몇행까지 보여줄 것인지 결정하게 된다 -
이 경우, ui.R에서
numericInput()함수를 통해 사용자로부터 받은 숫자인 obs를 n에다 집어넣어서 n행만큼 표시해주게 된다. -
단, 사용자가 “Update View”버튼을 눌렀을 때만 n값을 갱신시키기 위해서 해당 동작을 하는
isolate()함수를 사용했다.
정리
- 이 프로그램은 먼저
selectInput()과numericInput()을 통해 사용자로부터 데이터셋 선택과 선택한 데이터셋의 몇행까지를 표시할지에 대한 입력을 받은 뒤, “Updat View”라는 동작버튼을 눌렀을 때 그에따라 반응하여 사용자에게 해당 데이터셋에 대한 summary를 제공하고, 사용자가 요구한 행까지 테이블 형식으로 상세 데이터를 보여주는 프로그램이다.