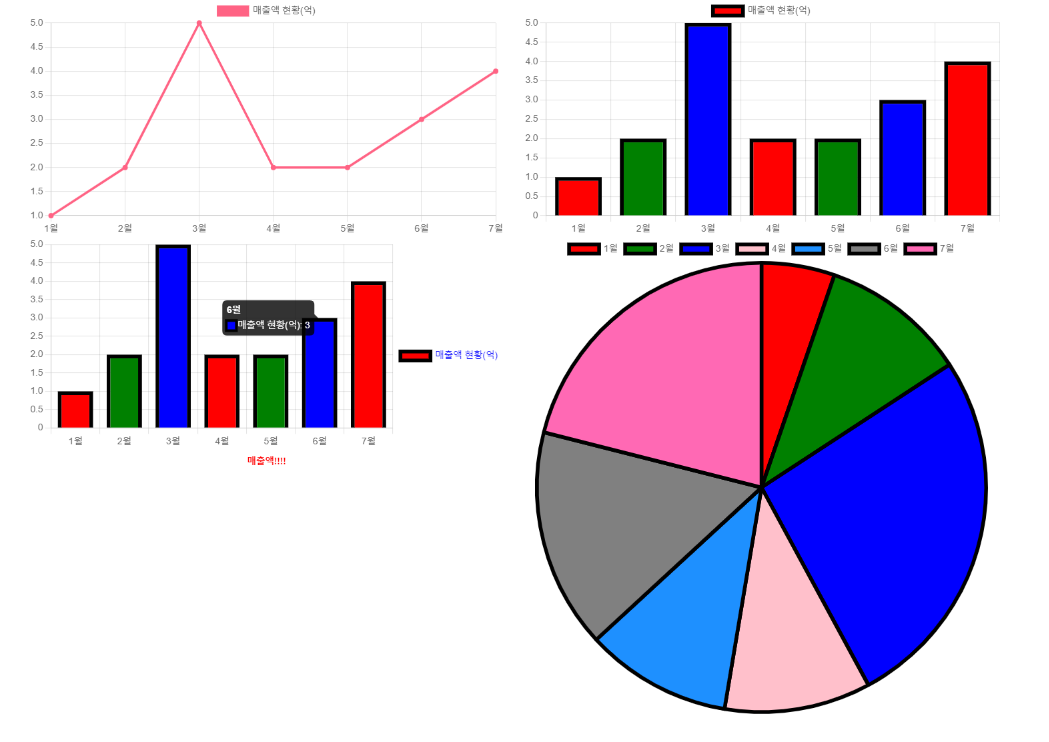
chartjs
<!DOCTYPE html>
<html lang="ko">
<head>
    <meta charset="UTF-8">
    <meta http-equiv="X-UA-Compatible" content="IE=edge">
    <meta name="viewport" content="width=device-width, initial-scale=1.0">
    <title>chartjs</title>

    <!-- chartjs cdn -->
    <script src="https://cdn.jsdelivr.net/npm/chart.js"></script>

    <!-- bootstrap css -->
    <link href="https://cdn.jsdelivr.net/npm/bootstrap@5.1.3/dist/css/bootstrap.min.css" rel="stylesheet">
</head>
<body>
    <div class="container">
        <div class="row">
            <div class="col-md-6">
                <canvas id="myChartOne"></canvas>
            </div>
            <div class="col-md-6">
                <canvas id="myChartTwo"></canvas>
            </div>
            <div class="col-md-6">
                <canvas id="myChartThree"></canvas>
            </div>
            <div class="col-md-6">
                <canvas id="myChartFour"></canvas>
            </div>
        </div>
    </div>
    <script>
        const labels = [
            '1월',
            '2월',
            '3월',
            '4월',
            '5월',
            '6월',
            '7월',
        ];
        const data = {
        labels: labels,
        datasets: [{
            label: '매출액 현황(억)',
            backgroundColor: 'rgb(255, 99, 132)',
            borderColor: 'rgb(255, 99, 132)',
            data: [1, 2, 5, 2, 2, 3, 4],
        }]
        };
        const data2 = {
        labels: labels,
        datasets: [{
            label: '매출액 현황(억)',
            backgroundColor: ['#ff0000', 'green', 'blue'], // rgba(255, 0, 0, 0.5), #ff0000
            borderColor: 'black',
            borderWidth: 5,
            hoverBorderWidth: 7,
            data: [1, 2, 5, 2, 2, 3, 4],
        }]
        };
        const data3 = {
        labels: labels,
        datasets: [{
            label: '매출액 현황(억)',
            backgroundColor: ['#ff0000', 'green', 'blue'], // rgba(255, 0, 0, 0.5), #ff0000
            borderColor: 'black',
            borderWidth: 5,
            hoverBorderWidth: 7,
            data: [1, 2, 5, 2, 2, 3, 4],
        }]
        };
        const data4 = {
        labels: labels,
        datasets: [{
            label: '매출액 현황(억)',
            backgroundColor: ['red', 'green', 'blue', 'pink', 'dodgerblue', 'gray', 'hotpink'], // rgba(255, 0, 0, 0.5), #ff0000
            // 보통 컬러를 하나하나 입력하지않고 function을 사용함
            borderColor: 'black',
            borderWidth: 5,
            hoverBorderWidth: 7,
            data: [1, 2, 5, 2, 2, 3, 4],
        }]
        };
        const config = {
            type: 'line', // pie, bar, line, doughnut, polarArea
            data: data,
            options: {}
        };
        const config2 = {
            type: 'bar', // pie, bar, line, doughnut, polarArea
            data: data2,
            options: {}
        };
        const config3 = {
            type: 'bar', // pie, bar, line, doughnut, polarArea
            data: data3,
            options: {
                plugins:{
                    title:{
                        display: true,
                        text: '매출액!!!!',
                        color: 'red',
                        position: 'bottom',
                        padding: {
                            top: 10,
                            bottom: 10
                        }
                    },
                    legend: {
                        display: true,
                        position:'right',
                        labels:{
                            color:'blue'
                        }
                    }
                }
            }
        };
        const config4 = {
            type: 'pie', // pie, bar, line, doughnut, polarArea
            data: data4,
            options: {}
        };
    </script>
    <script>
        const myChartOne = new Chart(
            document.getElementById('myChartOne'),
            config
        );
        const myChartTwo = new Chart(
            document.getElementById('myChartTwo'),
            config2
        );
        const myChartThree = new Chart(
            document.getElementById('myChartThree'),
            config3
        );
        const myChartFour = new Chart(
            document.getElementById('myChartFour'),
            config4
        );
    </script>
</body>
</html>
Canvas
<!DOCTYPE html>
<html lang="ko">
<head>
<meta charset="UTF-8">
<meta http-equiv="X-UA-Compatible" content="IE=edge">
<meta name="viewport" content="width=device-width, initial-scale=1.0">
<title>Canvas tutorial</title>
</head>
<body>
<canvas id="canvas"></canvas>
<script>
// 태그 선택
const canvas = document.getElementById('canvas');
// 캔버스에서 어떻게 그릴지(렌더링) 컨텍스트를 받아옴
const ctx = canvas.getContext('2d');
// 그림 그리기
function drawRect(ctx) {
// x, y : 좌측 상단 기준 x, y 좌표
// w는 너비, h는 높이
let x = 30,
y = 50,
w = 150,
h = 100;
ctx.fillStyle = 'pink';
ctx.fillRect(x, y, w, h);
}
// drawRect(ctx);
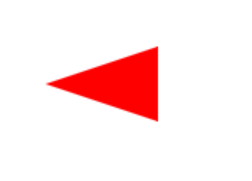
function 삼각형(ctx){
// 점을 하나씩 찍는 방식
// moveTo, lineTo를 바꾸면 삼각형 모양이 바뀜
ctx.beginPath()
ctx.moveTo(25, 50);
ctx.lineTo(100, 75);
ctx.lineTo(100, 25);
ctx.fillStyle = 'red';
ctx.fill();
}
삼각형(ctx);
</script>
</body>
</html>D3
<!DOCTYPE html>
<html lang="ko">
<head>
<meta charset="UTF-8">
<meta http-equiv="X-UA-Compatible" content="IE=edge">
<meta name="viewport" content="width=device-width, initial-scale=1.0">
<title>D3</title>
<script src="https://d3js.org/d3.v7.min.js"></script>
</head>
<body>
<div class="canvas"></div>
<script>
const canvas = d3.select('.canvas');
const svg = canvas.append('svg') //추가
.attr('height', 1000) // 속성 지정
.attr('width', 1000);
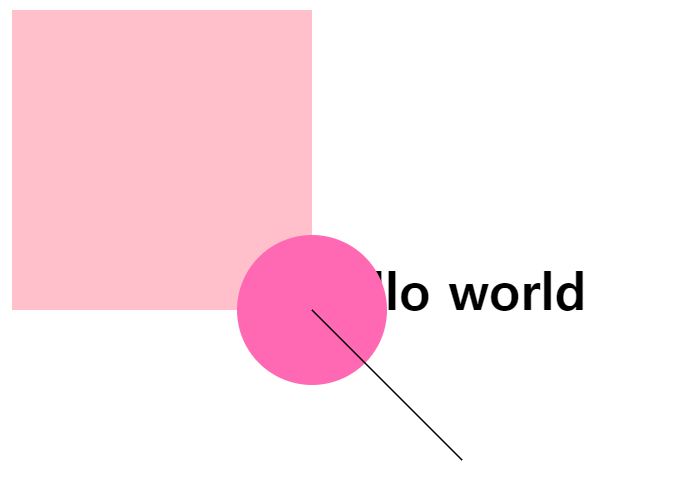
svg.append('text') // 추가, text 형태로 추가
.attr('x', 200)
.attr('y', 200) // 좌측 상단 기준 좌표
.attr('fill', 'black')
.text('hello world')
.style('font-weight', 'bold')
.style('font-size', '34px');
// .style('font-style', 'Nanum Pen Script');
// google font style은 바로 적용 안됨 (import를 사용해서 root에 추가하는 방법으로 해결 가능)
svg.append('rect') // 추가, 사각형 형태로 추가
// .attr('x', 10)
// .attr('y', 10)
.attr('width', 200)
.attr('height', 200)
.attr('fill', 'pink')
svg.append('circle') // 추가, 원 형태로 추가
// .attr('x', 10)
// .attr('y', 10)
.attr('r', 50)
.attr('cx', 200) // x 축
.attr('cy', 200) // y 축
.attr('fill', 'hotpink')
svg.append('line')
.attr('x1', 200) // x축 시작
.attr('y1', 200) // y축 시작
.attr('x2', 300) // x축 끝
.attr('y2', 300) // y축 끝
.attr('stroke', 'black')
</script>
</body>
</html>- CSV(영어: comma-separated values)는 몇 가지 필드를 쉼표(,)로 구분한 텍스트 데이터 및 텍스트 파일이다.
- D3는 서버환경에서 실행된다.
git 명령어 (=리눅스 명령어)
-
git add . : 모든 변경내역을 업로드 (.은 all)
-
git commit -m '메시지' : 커밋 메세지 입력
-
git push : github에 올리기
-
git pull : pull 땡겨오기
-
git diff : 어떤 커밋이 추가되었는지 확인
-
rm -rf 개리 : 개리 폴더 삭제
-
code . : vsc를 현재 폴더 기준으로 열기
-
git log : 로그 확인
-
touch
-
vi > i > esc + :wq!
-
shift+insert : 붙여넣기
-
git clone repo-link . : repo 복사해오기 (파일만 * 가져오기, 마지막에 . 안찍으면 새로운 폴더가 생김)
-
Settings > Manage access > Add people: 접근 권한 허용됌
-
git branch : 브랜치 목록과 현재 브랜치 확인
-
git branch 이름 : 브랜치 만들기
git으로 추적하는 파일의 4가지 상태
- untracked : 추적안됨
- tracked : 수정없음
- tracked : 수정함
- tracked : 스테이지됨(폴더에 있는 추적안됨과 수정함을 스테이지로 올림, commit 후에는 수정없음으로 되돌아감)
warning: LF will be replaced by CRLF in README.md.
The file will have its original line endings in your working directory (무시해도 되는 warning)
- commit은 기능 단위로, 코드 몇 줄 추가되었다고 커밋하면 안됌 (rollback을 위함)
- add 하면 stage로 이동, commit하면 version이 추가됨
- version관리 : 이전 버전으로 돌아갈 수 있음
1분코딩 '유준모'님 특강
인터렉티브 웹 개발,
웹에서 3D를 다루는 법(Three.js)
WebGL
WebGL은 웹 기반의 그래픽 라이브러리이다.
자바스크립트 프로그래밍 언어를 통해서 사용할 수 있으며 호환성이 있는 웹 브라우저에서 인터랙티브한 3D 그래픽을
사용할 수 있도록 제공된다.
저수준언어라 Three.js등의 라이브러리를 사용하는 경우가 많다.
Three.js 기본요소
- Scene : object를 올리는 무대
- Camera : 이동하며 줌인/아웃 등 가능
- Renderer : 브라우저에 보이는 화면
- Light(필수요소는 아님)
캐릭터
Mesh = Geometry(모양) + Material(재질)