
들어가며
사이드 프로젝트를 하면서 늘 고민이 있었습니다.
“내 서비스가 잘 동작하는 건 알겠는데, 성능이나 장애는 어떻게 확인하지?”
특히 EC2 프리티어 환경에서 돌리는 서비스라서,
- 요청이 몰렸을 때 어디서 병목이 생기는지,
- 장애가 발생했을 때 어디서 로그를 확인해야 하는지,
- 성능을 개선했을 때 그 효과를 수치로 증명할 수 있는지,
이런 부분이 늘 불안했습니다.
그래서 이번에는 Observability(관찰 가능성) 환경을 직접 구축하기로 했습니다.
왜 OTEL(OpenTelemetry) + Grafana 스택인가?
처음 고민했던 선택지들
- ELK 스택(Elasticsearch + Logstash + Kibana) → 너무 무겁고, EC2 프리티어에서 운영하기 벅참.
- cadvisor → 컨테이너 리소스 모니터링은 되지만, 애플리케이션 단위 모니터링에는 한계.
- 단순 Prometheus + Actuator → 메트릭 수집은 가능하지만, 로그와 트레이스까지 엮기는 어려움.
최종 선택
- OTEL(OpenTelemetry) → 표준화된 데이터 수집 파이프라인.
- Prometheus → 메트릭 저장.
- Loki → 로그 저장.
- Tempo → 트레이스 저장.
- Grafana → 시각화 & 대시보드.
결론적으로, 로그 + 메트릭 + 트레이스를 하나로 묶어보고 싶다는 니즈가 제일 컸습니다.
최소 구성으로 스택 띄우기
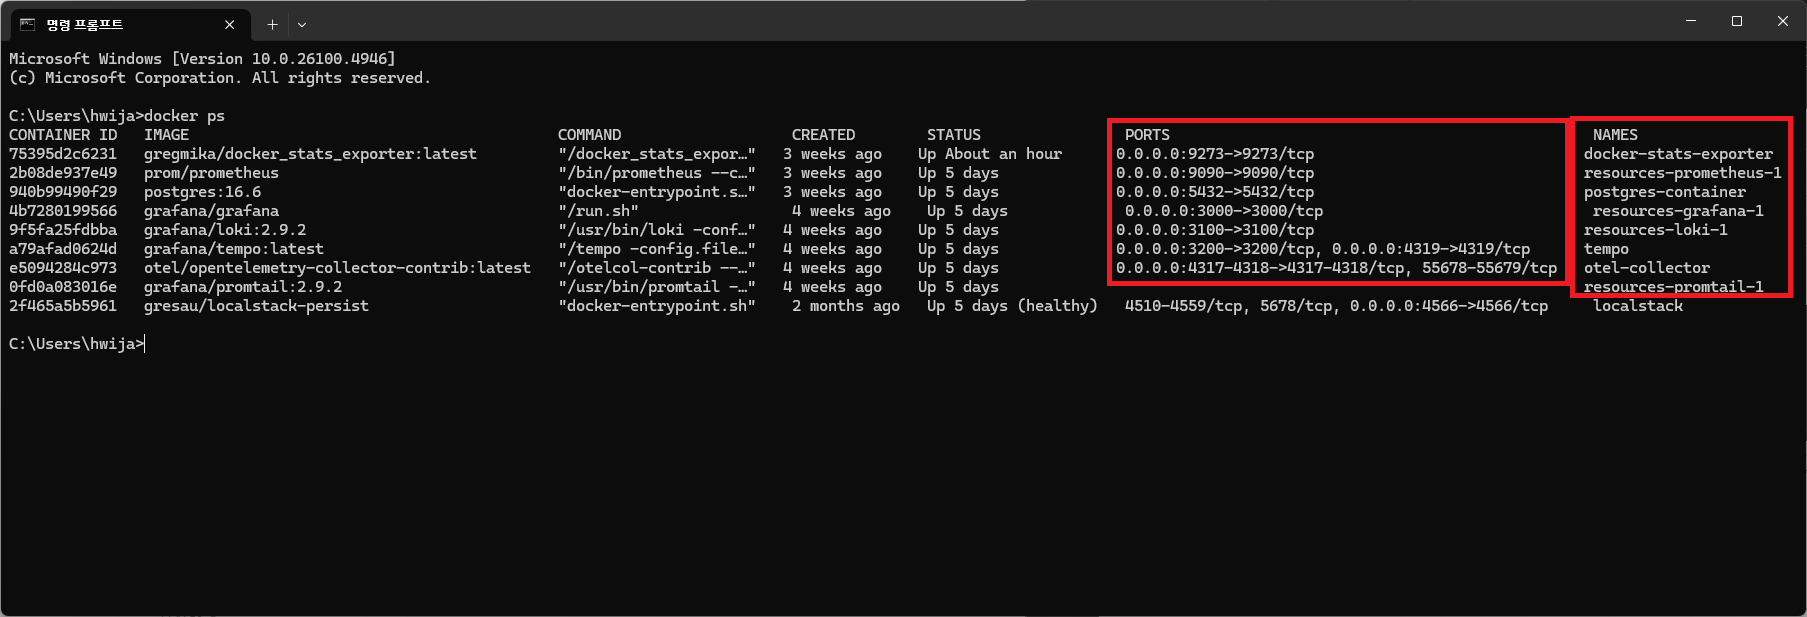
첫 단계는 docker-compose로 관찰 가능성 스택을 띄우는 것이었습니다.
이번 편에서는 핵심인 Prometheus, Grafana, Loki, Tempo만 올렸습니다.
services:
  prometheus:
    image: prom/prometheus
    ports:
      - "9090:9090"
    volumes:
      - ./prometheus.yml:/etc/prometheus/prometheus.yml:ro

  grafana:
    image: grafana/grafana
    ports:
      - "3000:3000"

  loki:
    image: grafana/loki:2.9.2
    ports:
      - "3100:3100"

  tempo:
    image: grafana/tempo:2.3.1
    ports:
      - "3200:3200"
여기서는 Postgres, Promtail, OTEL Collector 같은 것들은 잠시 빼고, “관찰용 스택이 정상 기동되는지”만 확인했습니다.
- 다음 편에서 점차 확장할 예정입니다.
Spring Boot 메트릭 노출
Spring Boot Actuator를 켜고 Prometheus 엔드포인트를 노출했습니다.
# application-local.yml
management:
  endpoints:
    web:
      exposure:
        include:
          - health
          - info
          - prometheus
  metrics:
    distribution:
      percentiles-histogram:
        http.server.requests: true
      percentiles:
        http.server.requests: 0.5, 0.95, 0.99
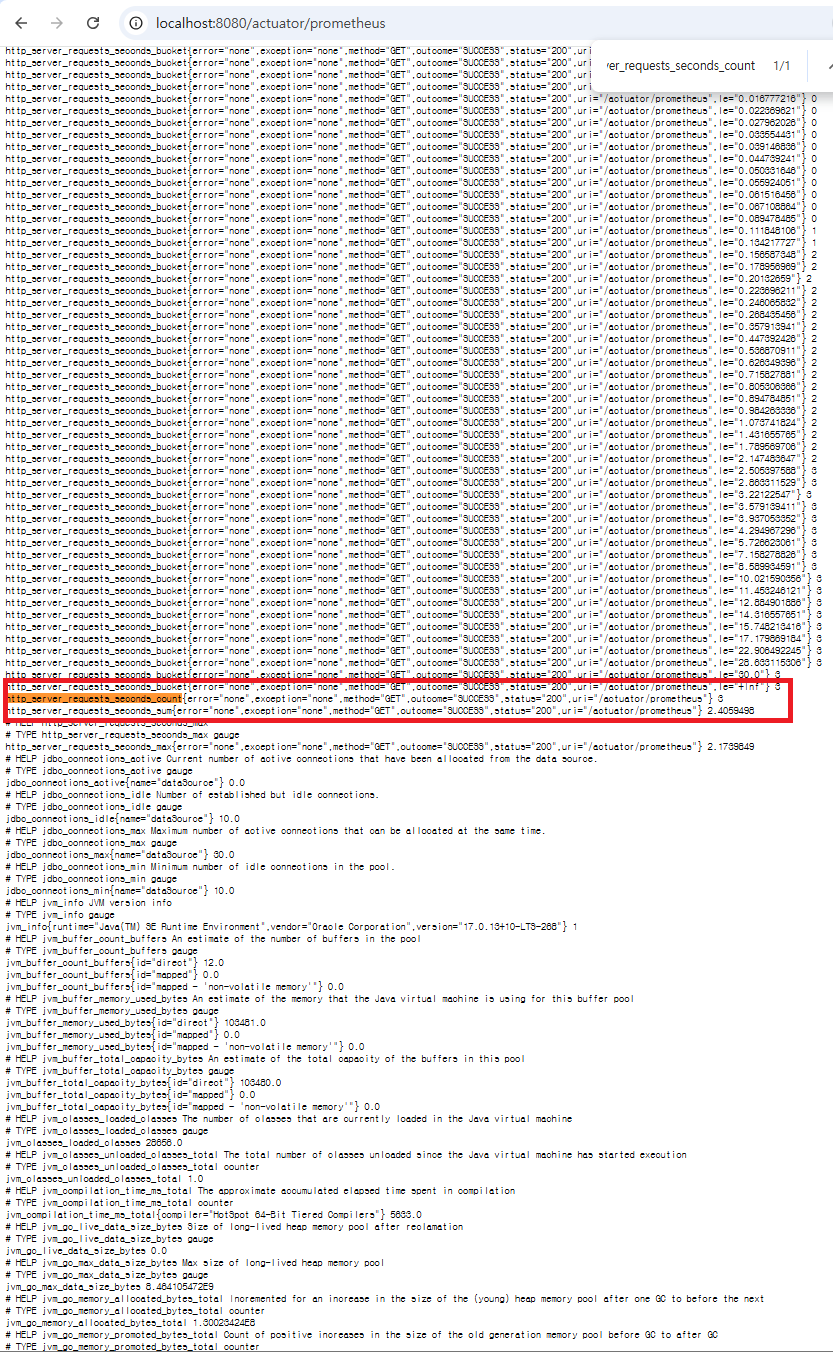
http://localhost:8080/actuator/prometheus접속 시,
http_server_requests_seconds_count같은 메트릭이 보이면 성공입니다.
Prometheus에서 Spring Boot 연결
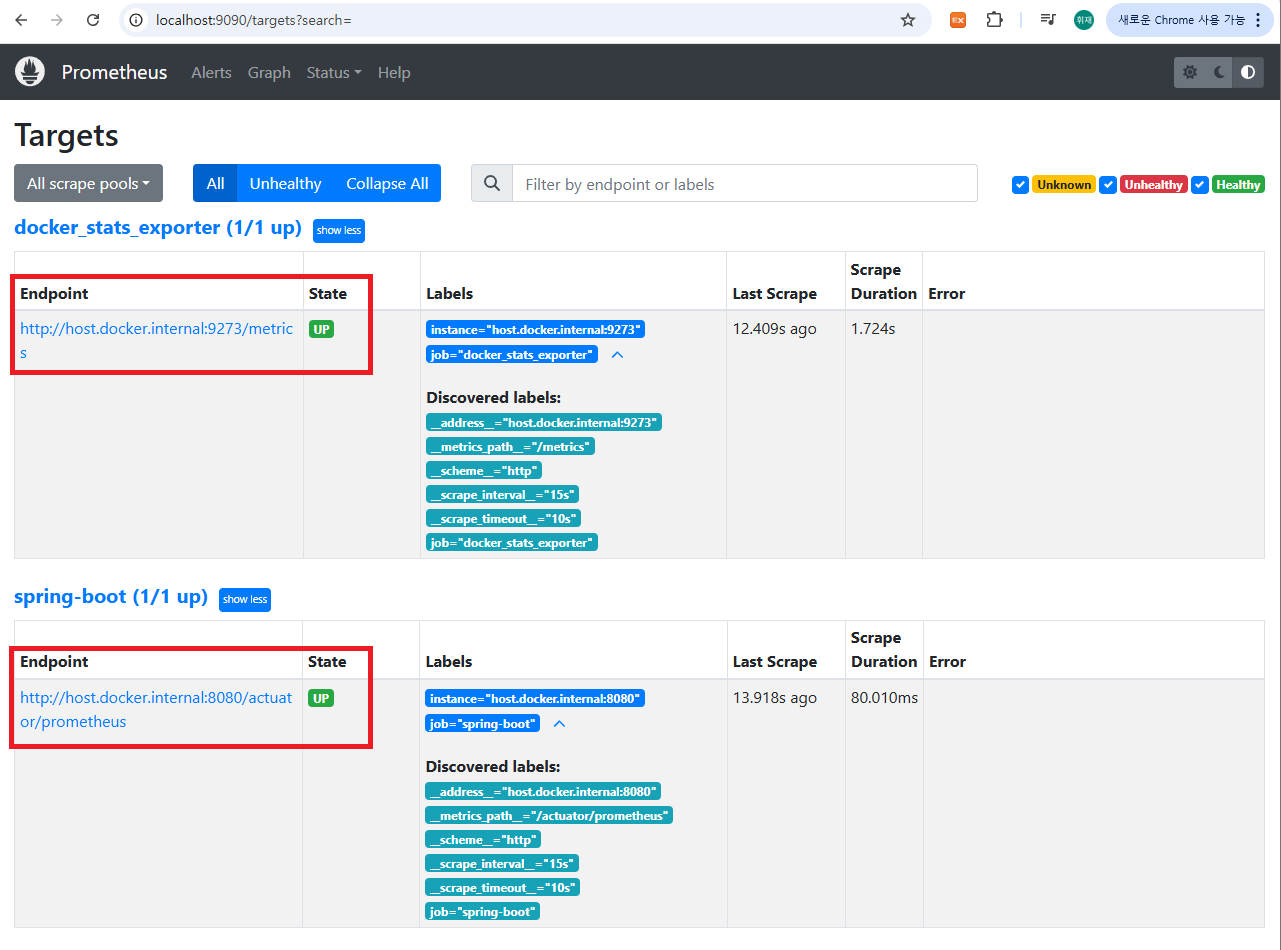
Prometheus 설정에서 Spring Boot 애플리케이션을 스크랩 대상으로 등록합니다.
# prometheus.yml
global:
  scrape_interval: 15s

scrape_configs:
  - job_name: 'spring-boot'
    metrics_path: '/actuator/prometheus'
    static_configs:
      - targets: ['host.docker.internal:8080']
처음에는
localhost:8080을 썼다가 실패했는데,
Docker 컨테이너에서 접근할 때는host.docker.internal을 써야 정상적으로 UP 상태가 됐습니다.
Grafana에서 데이터 확인
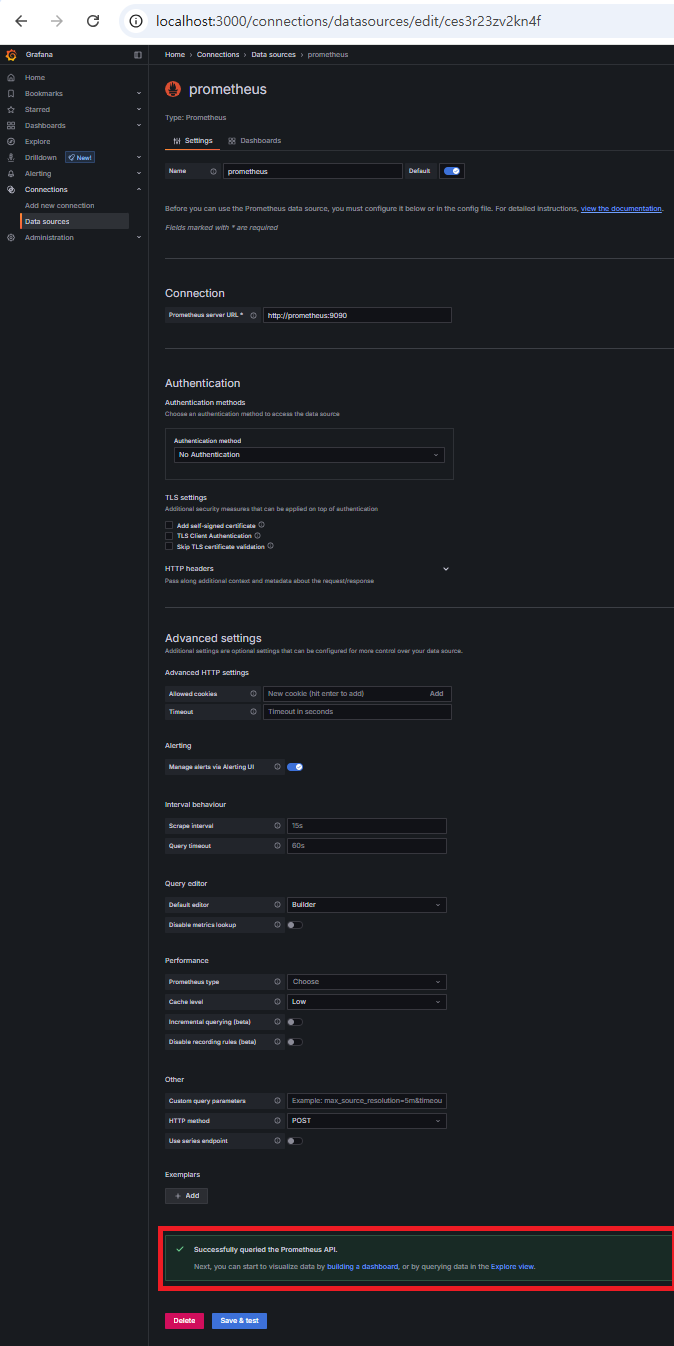
1. Prometheus 데이터소스 연결
- Grafana → DataSources → Prometheus 등록
- URL:
http://prometheus:9090 - 연결 성공 메시지: “Successfully queried the Prometheus API”
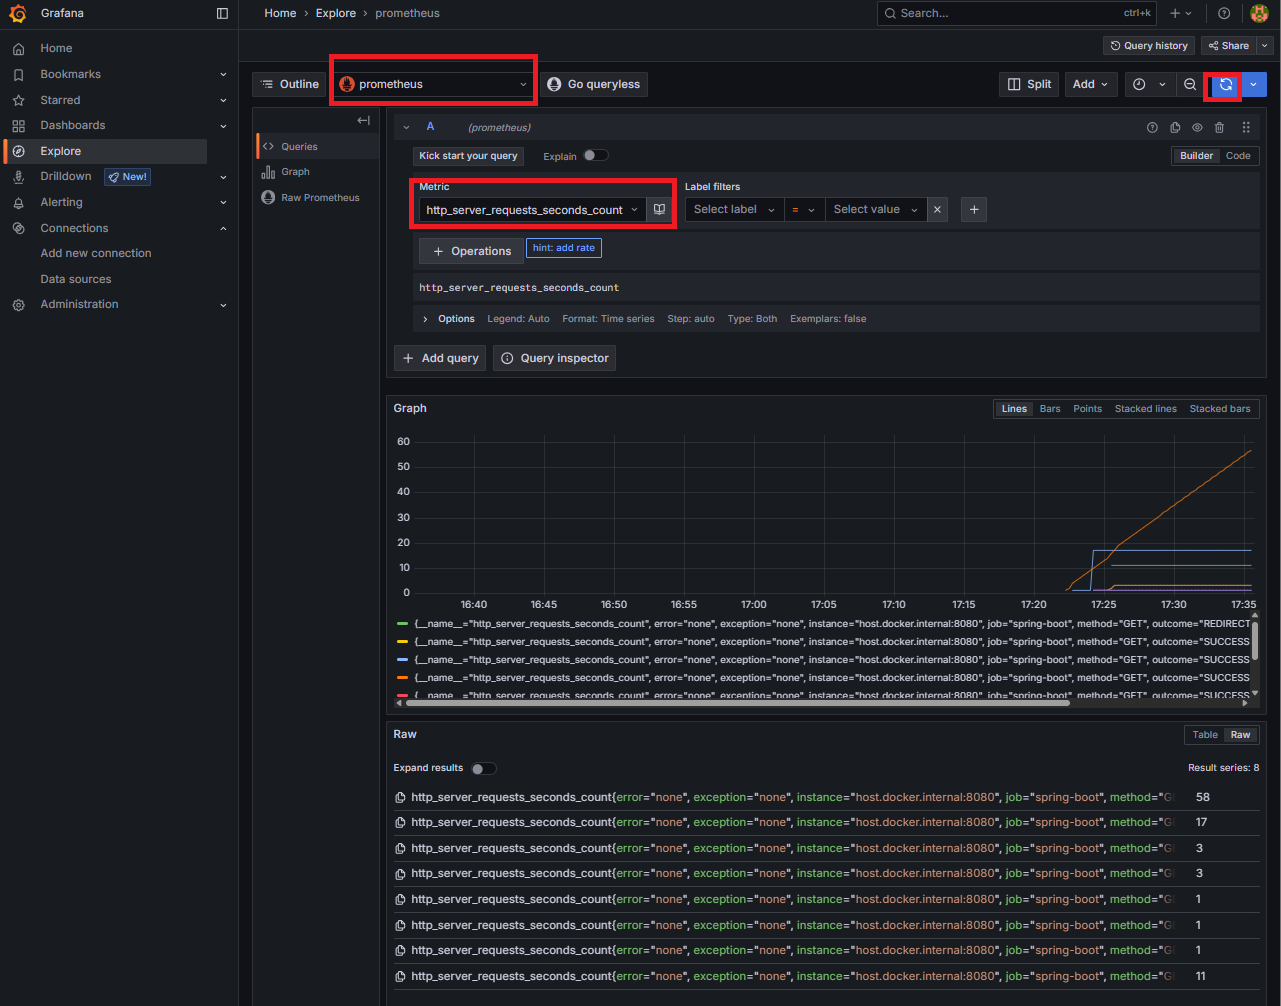
2. Explore에서 메트릭 확인
http_server_requests_seconds_count조회 → 그래프 출력- 서비스 요청량이 실시간으로 올라가는 걸 보면서, “이제야 내 서비스가 모니터링되고 있구나” 실감했습니다.
첫 번째 병목 확인 (부하 테스트)
간단히 ApacheBench로 부하를 줬습니다.
ab -n 1000 -c 50 http://localhost:8080/
- Grafana Explore에서 응답 시간 지표가 튀는 순간을 바로 볼 수 있었습니다.
- 아직 원인은 분석 전이지만, “어디서부터 성능 이슈가 시작되는지”를 눈으로 확인했다는 점이 의미 있었습니다.
시행착오와 배움
- 주소 문제: Prometheus → Spring Boot 연결 시
localhost대신host.docker.internal을 써야 함. - 부하 테스트 효과: 단순히 로그만 볼 땐 몰랐던 병목 구간이 메트릭 그래프에서 확 드러남.
- 교훈: “일단 계측해야 개선도 가능하다”는 걸 체감.
정리
이번 1편에서는,
- 왜 모니터링이 필요한지,
- 왜 OTEL + Grafana 스택을 선택했는지,
- 최소 구성으로 띄우고 첫 번째 메트릭을 확인한 과정,
- 간단한 부하 테스트로 병목을 발견한 경험,
까지 다뤘습니다.

운동처럼 개발도 작은 실천이 성장의 힘이 된다고 믿는 개발자 minpractice_jhj 기록