겨울 방학동안 머신러닝과 딥러닝을 공부하면서 캐글 대회(이미 종료된 대회 위주이지만,,,ㅎ)를 몇개 참가하면서 파이썬을 이용한 딥러닝을 공부를 해보았다. 방학동안 교수님과 스터디를 진행하면서 이론적으로 딥러닝을 공부했지만 파이썬을 따로 배우지 않았고 크게 와닿지가 않았다. 그래서 실습자료를 찾아보다가 캐글이라는 사이트를 알게 되었는데

캐글이란?
캐글(Kaggle)은 2010년 설립된 빅데이터 솔루션 대회 플랫폼 회사이다. 21세기의 가장 섹시한 직업으로 데이터 사이언티스트가 꼽힐 만큼[하버드 비즈니스 리뷰] 빅 데이터(Big Data)가 사회 및 기업 환경에서 큰 화두로 떠오르면서 캐글의 규모도 같이 성장하게 되었고, 지난 2017년 3월, 구글은 캐글을 인수하기에 이르렀다.
이러한 사이트인데 여러 딥러닝 모델을 사용해볼수 있는 데이터와 대회들이 많아서 딥러닝이나 머신러닝을 공부하는 사람들을 위한 사이트라고 할 수 있다.
그중 나는 첫번째로 참가하게된 대회는 
Bike Sharing Demand(자전거 수요량 예측하기)
- 말 그대로 자전거의 수요량에 관한 데이터가 주어지고 그 데이터를 가지고 모델이 학습을 해서 미래에 수요량을 예측하는 대회이다. 캐글에 여러 입문 대회가 있는데 그 중에 입문대회로 포함되는 대회이다.
데이터 확인하기
- datetime : 대여날짜 및 시간
- season : 계절
- holiday : 휴일유무
- workingday : 평일(일하는날)
- weather : 날씨
- temp - temperature in Celsius
- atemp - "feels like" temperature in Celsius
- humidity - relative humidity
- windspeed - wind speed
- casual - number of non-registered user rentals initiated
- registered - number of registered user rentals initiated
- count - number of total rentals
프로젝트 진행순서
- 데이터 확인하기
- 필요없는 데이터 제거하기
- 모델 불러오기
- 모델 선언하기
- 학습하기
- 예측하기
- 학습한 모델 데이터 제출하기
- 위에 진행순서로 어떤 대회든 진행하면 된다. 굵은 글씨로 쓰인 3,4,5,6번 과정이 딥러닝 과정에서 가장 중요하다고 생각한다.
데이터 확인하기
# This Python 3 environment comes with many helpful analytics libraries installed
# It is defined by the kaggle/python docker image: https://github.com/kaggle/docker-python
# For example, here's several helpful packages to load in

import numpy as np # linear algebra
import pandas as pd # data processing, CSV file I/O (e.g. pd.read_csv)

# Input data files are available in the "../input/" directory.
# For example, running this (by clicking run or pressing Shift+Enter) will list all files under the input directory

import os
for dirname, _, filenames in os.walk('/kaggle/input'):
    for filename in filenames:
        print(os.path.join(dirname, filename))

# Any results you write to the current directory are saved as output.
-처음에 주어진 코드를 실행시킨다.
 /kaggle/input/bike-sharing-demand/sampleSubmission.csv
 /kaggle/input/bike-sharing-demand/test.csv
 /kaggle/input/bike-sharing-demand/train.csv
이런식으로 결과가 나온다.
우선 train_set의 데이터를 확인한다.
train = pd.read_csv("/kaggle/input/bike-sharing-demand/train.csv")
train.head()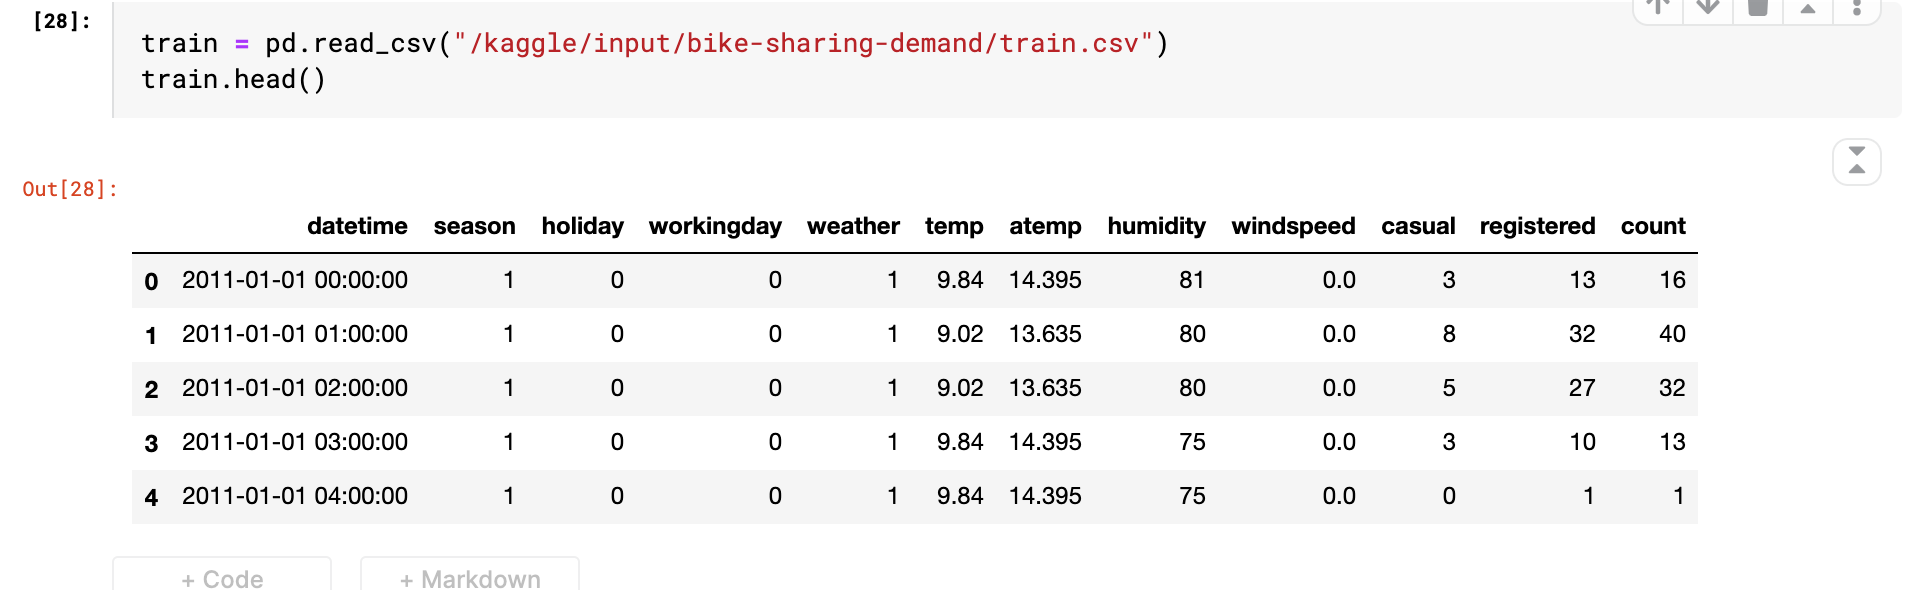
test_set의 데이터도 마찬가지로 확인한다.
test = pd.read_csv("/kaggle/input/bike-sharing-demand/test.csv")
test.head()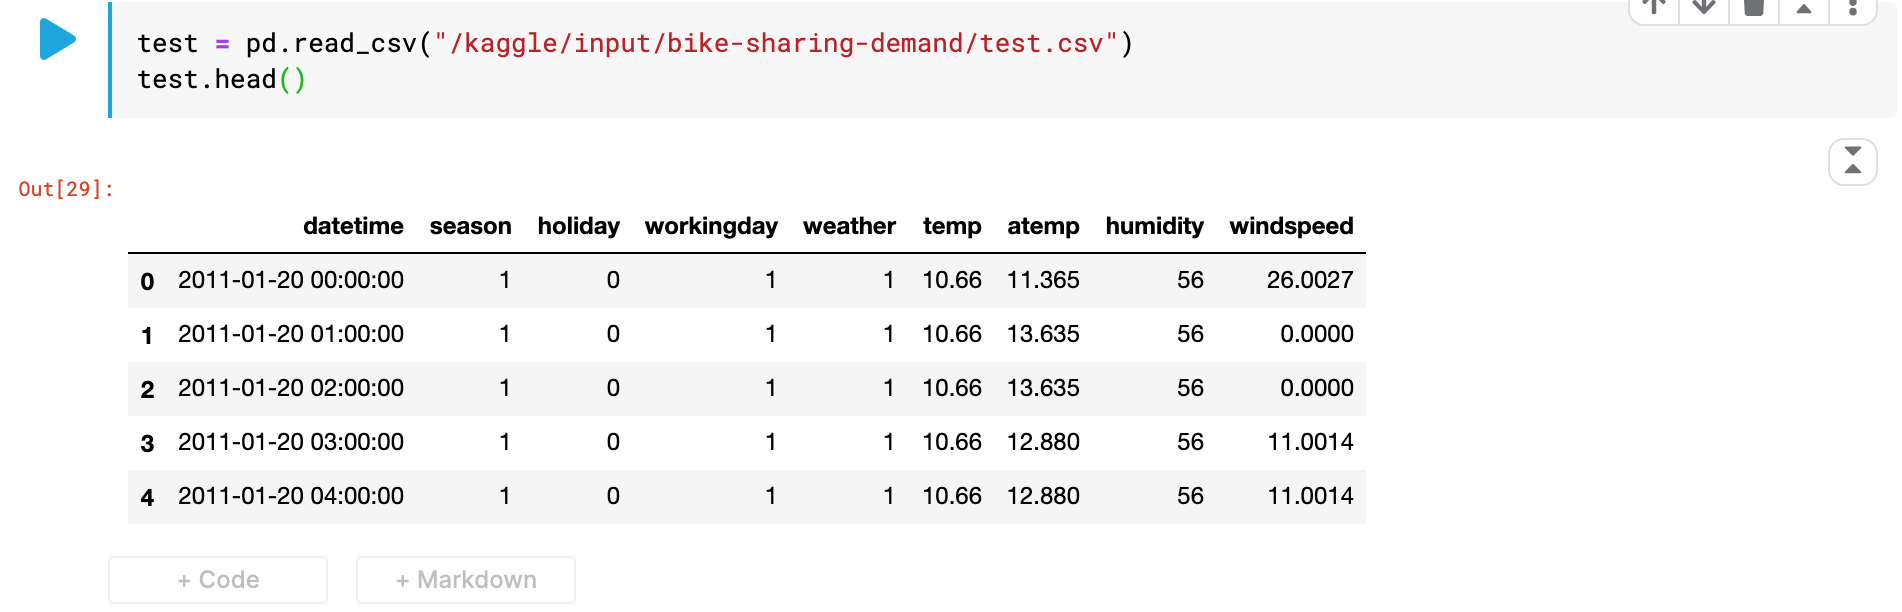
train_set의 데이터 자료형을 확인한다.
train.info()RangeIndex: 10886 entries, 0 to 10885
Data columns (total 12 columns):
datetime 10886 non-null object
season 10886 non-null int64
holiday 10886 non-null int64
workingday 10886 non-null int64
weather 10886 non-null int64
temp 10886 non-null float64
atemp 10886 non-null float64
humidity 10886 non-null int64
windspeed 10886 non-null float64
casual 10886 non-null int64
registered 10886 non-null int64
count 10886 non-null int64
dtypes: float64(3), int64(8), object(1)
memory usage: 1020.7+ KBtest_set의 데이터 자료형을 확인한다.
test.info()<class 'pandas.core.frame.DataFrame'>
RangeIndex: 6493 entries, 0 to 6492
Data columns (total 9 columns):
datetime 6493 non-null object
season 6493 non-null int64
holiday 6493 non-null int64
workingday 6493 non-null int64
weather 6493 non-null int64
temp 6493 non-null float64
atemp 6493 non-null float64
humidity 6493 non-null int64
windspeed 6493 non-null float64
dtypes: float64(3), int64(5), object(1)
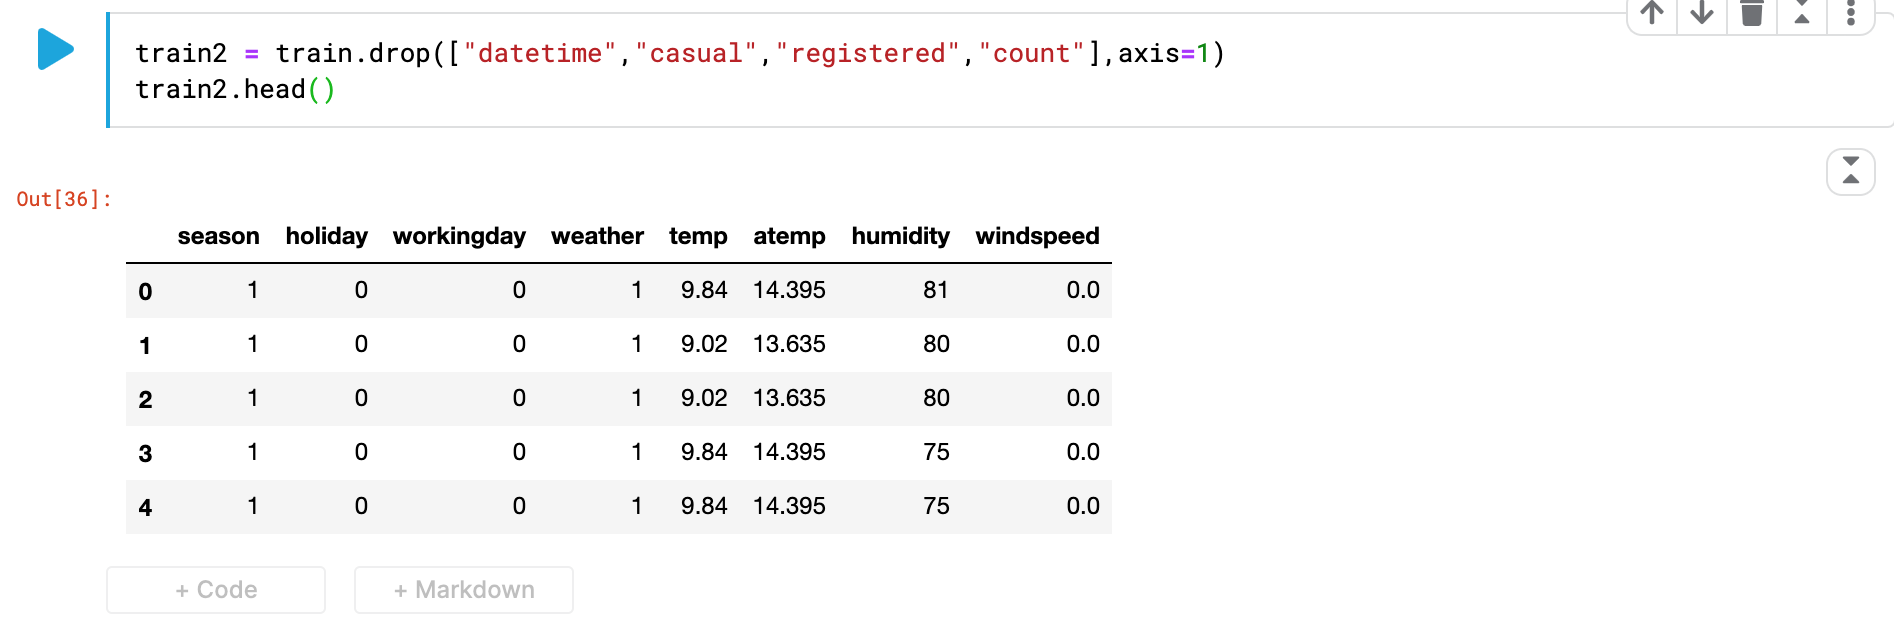
memory usage: 456.7+ KBtrain_set과 test_set의 공통된 데이터 칼럼은 살리면서 데이터의 자료형이 object인 'datetime'은 제거해준다 -> object형식은 학습안됨
//기존 train과 test변수에는 데이터 원본이 있으므로 train2,test2와 같은 새로운 변수로 카테고리를 없앤 데이터를 저장한다.
train2 = train.drop(["datetime","casual","registered","count"],axis=1)
//axis는 1이면 행으로 0이면 열로 수행
//우리는 행 전체를 삭제해야 되기 때문에 axis를 1로 설정
train2.head()
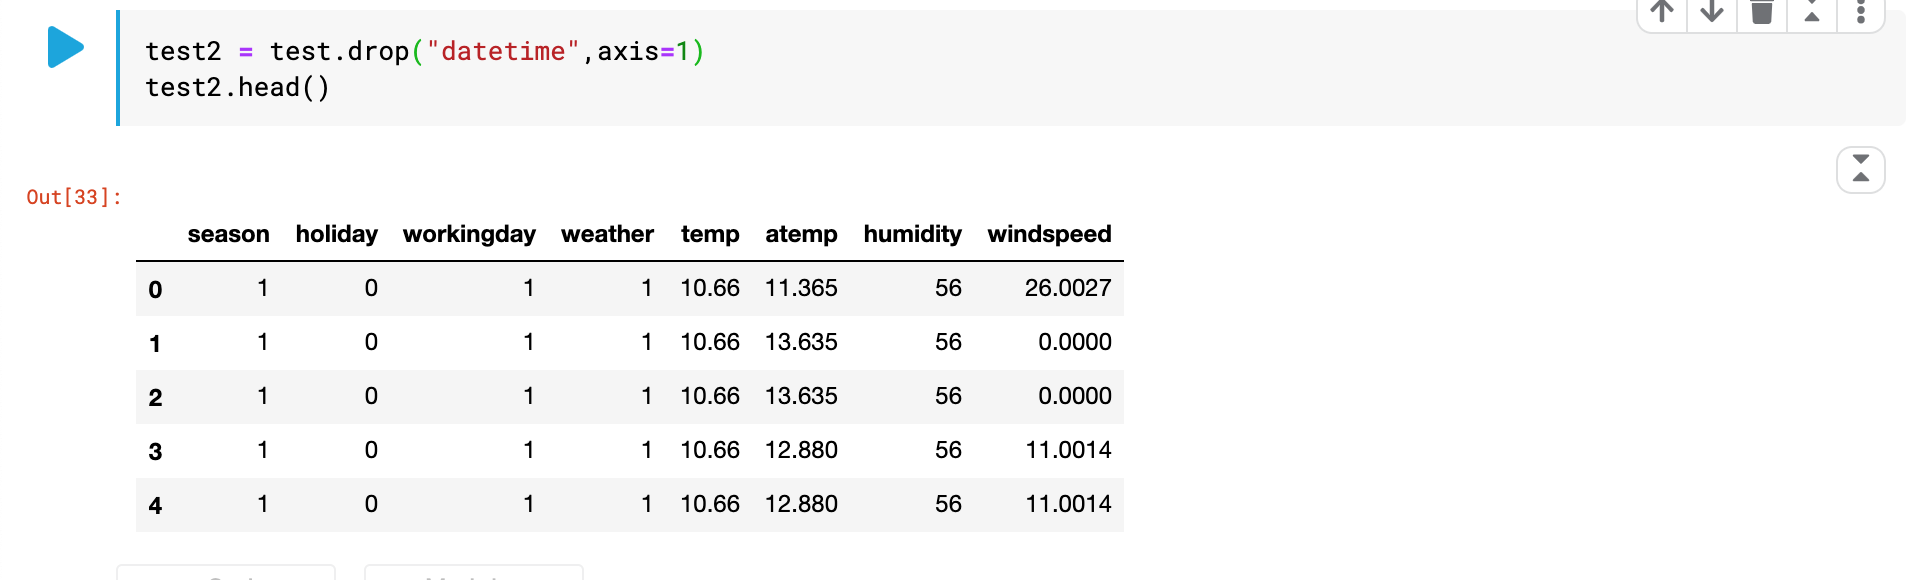
test2 = test.drop("datetime",axis=1)
test2.head()
train_set과 test_set의 데이터 칼럼의 갯수를 맞췄으면 진행순서 3번부터 계속 진행한다.
from sklearn.ensemble import RandomForestRegressor //랜덤포레스트 모델 불러오기
rf = RandomForestRegressor()   //모델 생성하기
rf.fit(train2,train["count"])  //모델 학습시키기(train의 count 칼럼에 train2에 데이터를 적용시킨다.)
result = rf.predict(test2)     // result에 예측한 값을 저장한다.
test_set의 count칼럼에 모델이 예측한 값을 저장하고 확인한다.
test["count"]=result
test.head()
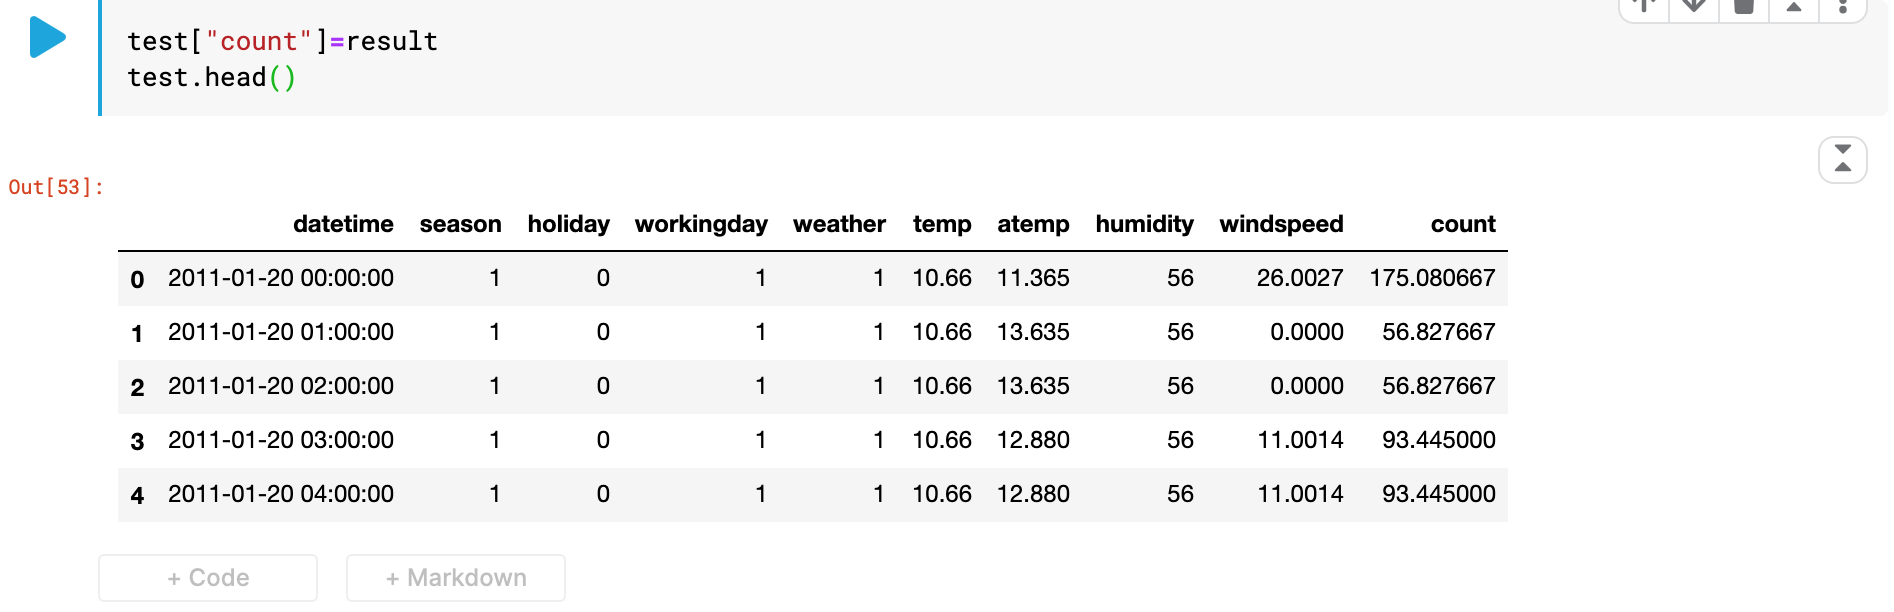
count칼럼에 모델이 학습하고 예측한 값이 적용된것을 볼 수 있다.
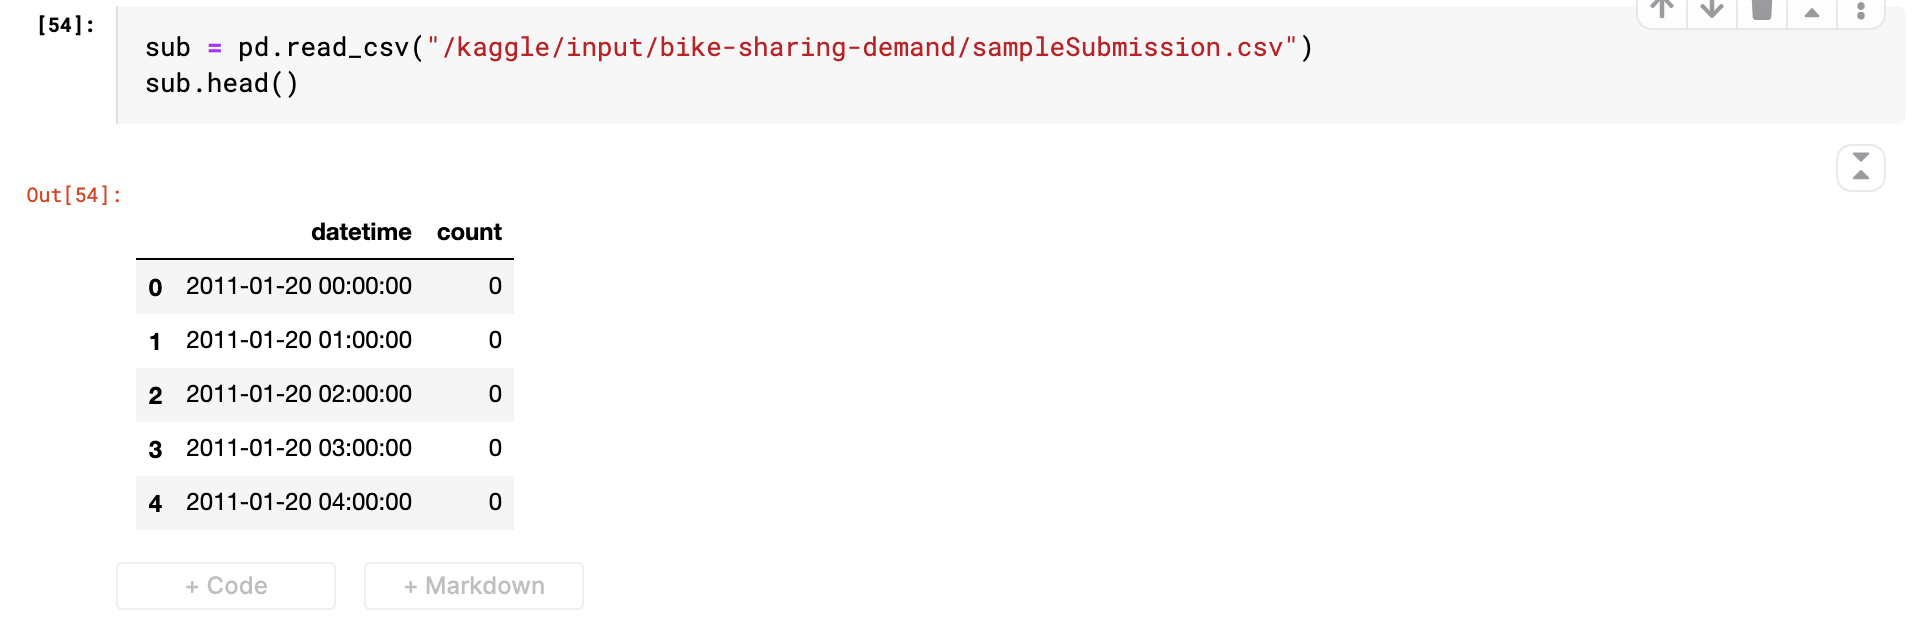
이제 제출 파일의 형식을 확인하고 그 형식에 맞게 제출 파일을 저장하고 제출한다.
sub = pd.read_csv("/kaggle/input/bike-sharing-demand/sampleSubmission.csv")
sub.head()
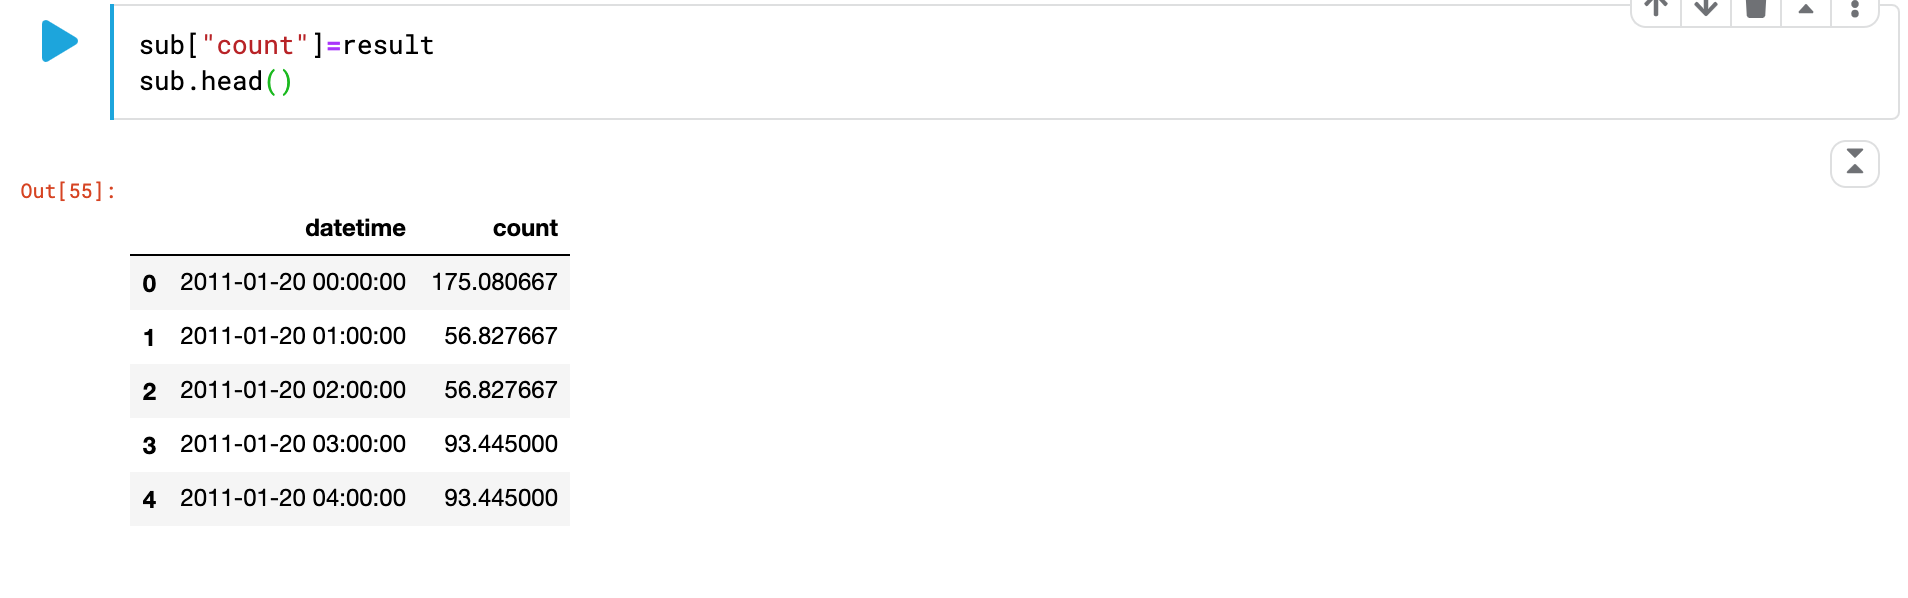
제출할 파일의 count칼럼에 모델이 학습하고 예측한 값을 저장해준다.
sub["count"]=result
sub.head()
csv 파일 형식으로 제출 파일을 저장한다.
sub.to_csv("bike_sharing.csv",index = False)선형회귀 문제이기 때문에 그에 적합한 '랜덤 포레스트' 모델을 이용해서 학습했다. 따로 처리를 해준것은 아무것도 없이 그냥 칼럼 갯수를 맞춰서 그대로 데이터를 사용해서 학습하고 예측했다.
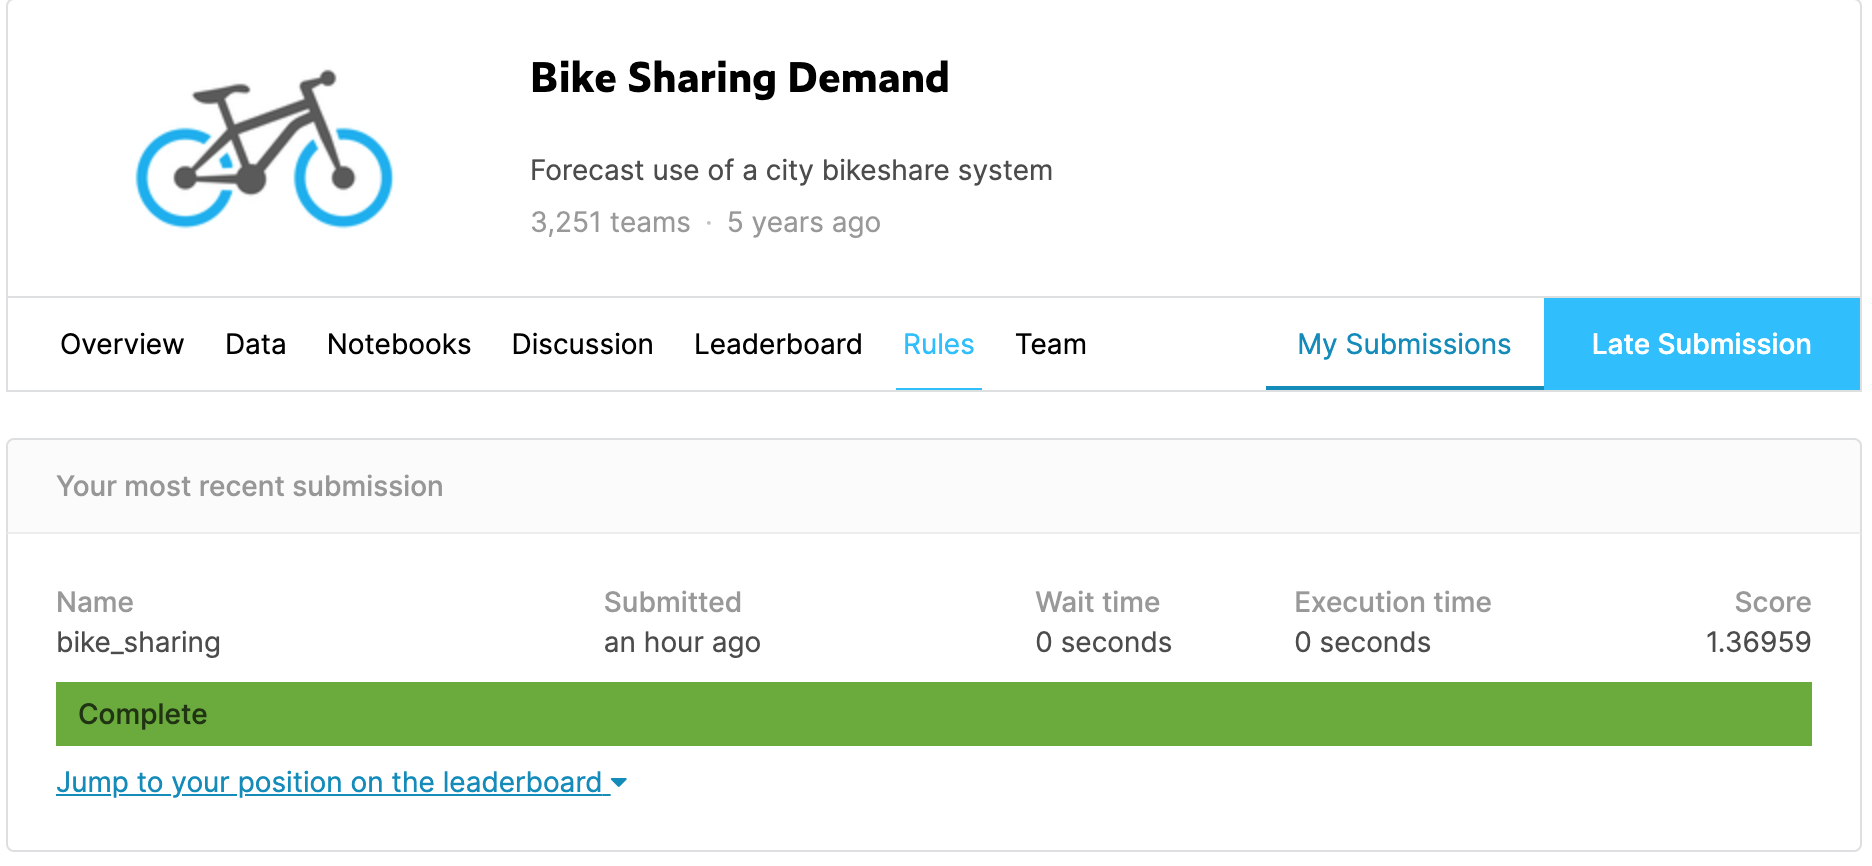
제출결과 점수가 1.36959로 총 3251개의 참가팀중 약 3039등정도로 낮은 등수 이지만 기본 데이터만 가지고 학습을 한 결과 치고는 괜찮은 점수이다.
- 나보다 낮은 등수가 있는 이유
- 데이터 전처리에서 실수 하는 경우
- 적합한 모델을 사용하지 않음
크게 이 두가지 경우라고 생각한다. 이후 포스트에서는 점수를 올리는 방법을 써볼 예정이다. 캐글을 접하고 공부한지 거의 두달이 다되가는데 이제써야 써본 포스트이다. 더 늦어서 힘들게 배운 지식을 까먹기 전에 포스트를 꾸준히 써야겠다.