pandas
DataFrame
데이터 셋의 정보를 활용하여 데이터 프레임을 생성
import pandas as pd
df = pd.DataFrame({"name": ['Bulbasaur', 'Charmander','Squirtle','Caterpie'],
"evolution": ['Ivysaur','Charmeleon','Wartortle','Metapod'],
"type": ['grass', 'fire', 'water', 'bug'],
"hp": [45, 39, 44, 45],
"pokedex": ['yes', 'no','yes','no']})
df
| evolution | hp | name | pokedex | type |
|---|---|---|---|---|
| Ivysaur | 45 | Bulbasaur | yes | grass |
| Charmeleon | 39 | Charmander | no | fire |
| Wartortle | 44 | Squirtle | yes | water |
| Metapod | 45 | Caterpie | no | bug |
순서 정렬
df[['name', 'type', 'hp', 'evolution','pokedex']]
name type hp evolution pokedex0 Bulbasaur grass 45 Ivysaur yes
1 Charmander fire 39 Charmeleon no
2 Squirtle water 44 Wartortle yes
3 Caterpie bug 45 Metapod no
새로운 컬럼을 생성하고 임의의 값을 할당
df['place'] = ['sea','mountain','lake','forest']
name evolution type hp pokedex place0 Bulbasaur Ivysaur grass 45 yes sea
1 Charmander Charmeleon fire 39 no mountain
2 Squirtle Wartortle water 44 yes lake
3 Caterpie Metapod bug 45 no forest
각 컬럼에 대한 타입을 확인
df.info()
0 name 4 non-null object
1 type 4 non-null object
2 hp 4 non-null int64
3 evolution 4 non-null object
4 pokedex 4 non-null object
5 place 4 non-null object
hp가 40이상인 데이터를 출력
df[df['컬럼'] 조건]
df[df['hp'] >= 40]
전체 데이터 셋 중에서 name과 type만 출력
df[['name','type']]
df[['컬럼','컬럼'...]]
데이터 세트에 인덱스를 one, two, three, four로 변경하시오. (새로운 객체에 할당 할 것)
복사
df2 = df.copy()
인덱스 부여
df2.index = ['one', 'two', 'three', 'four']
df2
name evolution type hp pokedex place
one Bulbasaur Ivysaur grass 45 yes sea
two Charmander Charmeleon fire 39 no mountain
three Squirtle Wartortle water 44 yes lake
four Caterpie Metapod bug 45 no forest
name을 인덱스로 설정
df2.set_index('name', inplace=True)
evolution type hp pokedex placename
Bulbasaur Ivysaur grass 45 yes sea
Charmander Charmeleon fire 39 no mountain
Squirtle Wartortle water 44 yes lake
Caterpie Metapod bug 45 no forest
Visualization
visualization libraries
import matplotlib.pyplot as plt
import seaborn as sns
print the graphs in the notebook
%matplotlib inline
set seaborn style to white
sns.set_style("white")
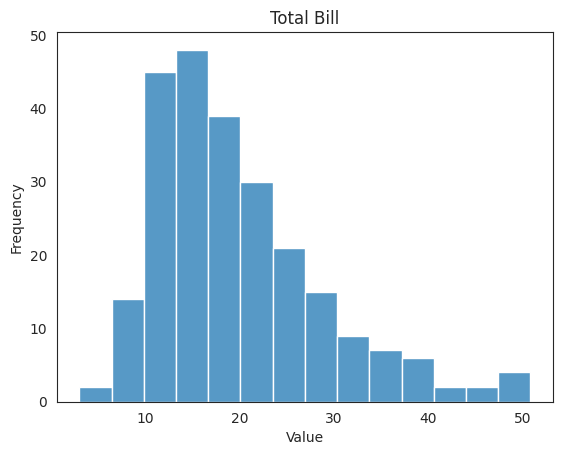
total_bill에 대해서 히스토그램
ttbill = sns.histplot(df.total_bill);
set lables and titles
x축 = Value y축 = Frequency
ttbill.set(xlabel = 'Value', ylabel = 'Frequency', title = "Total Bill");
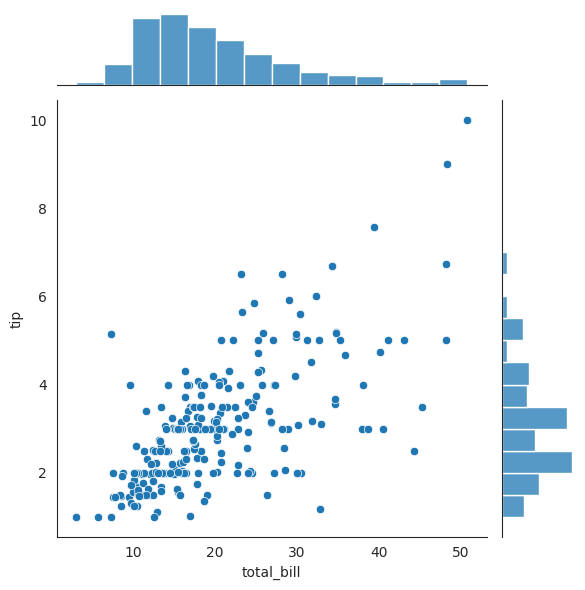
jointplot
sns.jointplot(x ="total_bill", y ="tip", data = df);
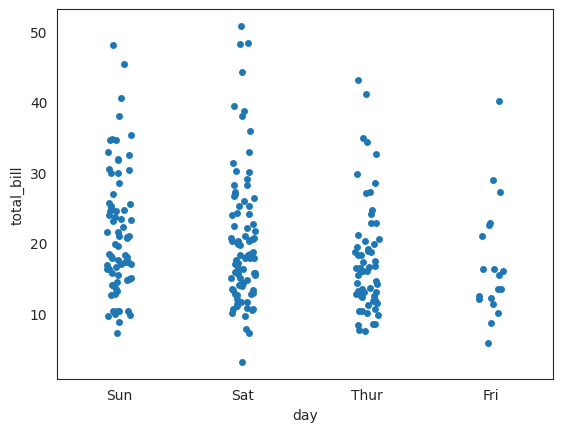
stripplot
sns.stripplot(x = "day", y = "total_bill", data = df);
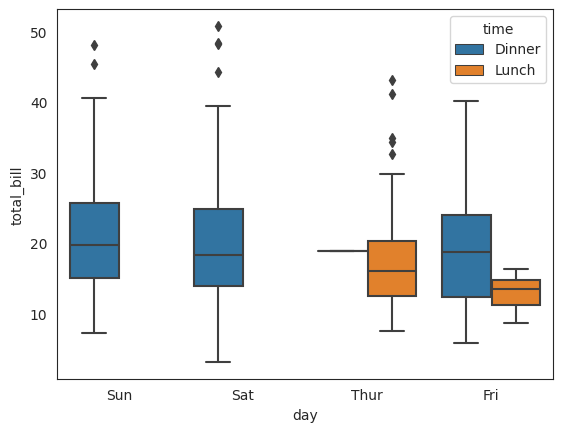
day와 time에 따라 total_bill의 관계를 파악하기 위한 boxplot을 그리시오 ( x축 - day, y축 - total_bill)
sns.boxplot(x = "day", y = "total_bill", hue = "time", data = df);
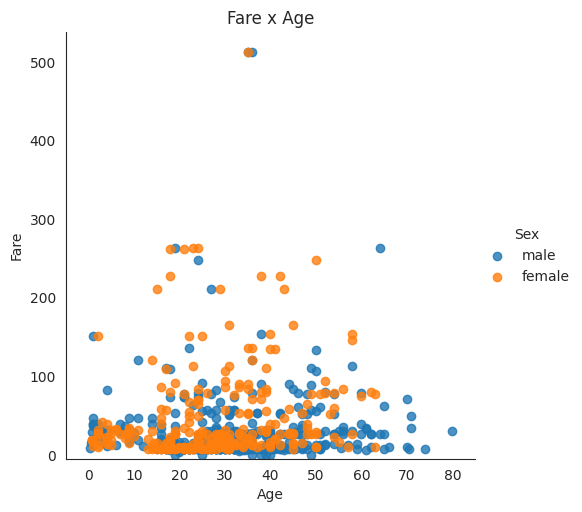
산점도
creates the plot using
lm = sns.lmplot(x = 'Age', y = 'Fare', data = df, hue = 'Sex', fit_reg=False)
set title
lm.set(title = 'Fare x Age')
get the axes object and tweak it
axes = lm.axes
axes[0,0].set_ylim(-5,)
axes[0,0].set_xlim(-5,85)
Deleting
import pandas as pd
import numpy as np
원본
sepal_length sepal_width petal_length petal_width class
0 4.9 3.0 1.4 0.2 Iris-setosa
1 4.7 3.2 1.3 0.2 Iris-setosa
2 4.6 3.1 1.5 0.2 Iris-setosa
3 5.0 3.6 1.4 0.2 Iris-setosa
4 5.4 3.9 1.7 0.4 Iris-setosa
Column별 NA값이 존재하는지 확인
df.isnull().sum()
'petal_length'의 10번째부터 29번째 행의 값을 NaN으로 변환
iloc[행,열] 행 0부터 세기 시작
df.iloc[9:29,2] = np.nan
df.head(30)
Nan값을 다시 1로 채워 넣으세요.
df.petal_length.fillna(1, inplace = True)
Class 컬럼을 삭제
del df['class']
sepal_length sepal_width petal_length petal_width
0 4.9 3.0 1.4 0.2
1 4.7 3.2 1.3 0.2
2 4.6 3.1 1.5 0.2
3 5.0 3.6 1.4 0.2
4 5.4 3.9 1.7 0.4
3개의 행에 대해서 모두 Nan값으로 변경
iloc[,: 모든 열]
df.iloc[0:3 ,:] = np.nan
sepal_length sepal_width petal_length petal_width0 NaN NaN NaN NaN
1 NaN NaN NaN NaN
2 NaN NaN NaN NaN
3 5.0 3.6 1.4 0.2
4 5.4 3.9 1.7 0.4
NaN을 가지고 있는 행을 삭제
df = df.dropna(how='any')
sepal_length sepal_width petal_length petal_width
3 5.0 3.6 1.4 0.2
4 5.4 3.9 1.7 0.4
5 4.6 3.4 1.4 0.3
6 5.0 3.4 1.5 0.2
7 4.4 2.9 1.4 0.2
index를 다시 0부터 시작할 수 있도록 수정
reset_index(drop=true)
df = df.reset_index(drop = True)
sepal_length sepal_width petal_length petal_width
0 5.0 3.6 1.4 0.2
1 5.4 3.9 1.7 0.4
2 4.6 3.4 1.4 0.3
3 5.0 3.4 1.5 0.2
4 4.4 2.9 1.4 0.2