clustering
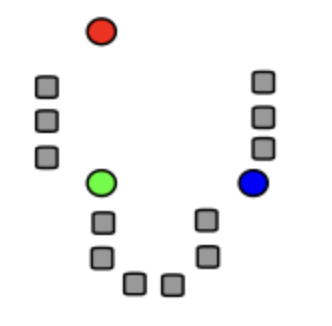
데이터 객체 들을 몇 개의 그룹으로 나누는 과정
- 거리 : 특징 벡터 X 간 거리, euclidean 등
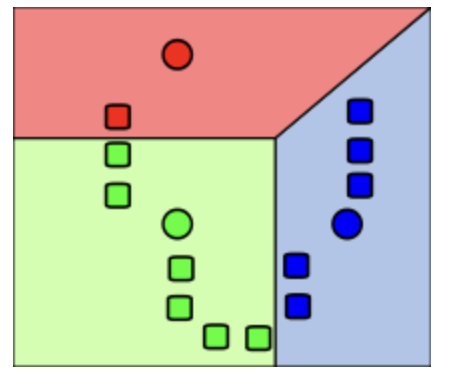
- 같은 그룹 내의 객체 간 거리는 가깝게
- 다른 그룹의 객체 간 거리는 멀게
데이터 분석 관점 : 어떤 그룹 들이 있는지
- 몇 개가 정답인지는 모름
머신러닝 관점-비지도 학습 : 학습데이터에 y 값이 없음
- 원래 분류가 안되는 데이터 vs. y값만 없는 경우
- clustering 완료 후에는 test data를 특정 cluster로 분류
클러스터링 과정
1. 데이터 df 획득
import pandas as pd
import math

retail_df = pd.read_excel('Online_Retail.xlsx')
retail_df.head()
2. 데이터 준비 및 탐색(K-mean은 데이터의 규모에 민감하기 때문에 이 단계가 중요합니다.)
고객 별 통계 구하기 (거래 건수, 총액, 최종거래일)
- agg( 집계할 변수 dict ) 함수 : groupby ( ) 와 함께 사용
- 집계할 변수 dict : {변수명:집계함수}
aggregations = {
    'InvoiceNo':'count',
    'SaleAmount':'sum',
    'InvoiceDate':'max'
}

customer_df = retail_df.groupby('CustomerID').agg(aggregations)
customer_df = customer_df.reset_index() # 하지 않으면 customrID가 index가 되어버림

customer_df.head()  #작업 확인용 출력
3. K-means clustering
입력값
- k: 클러스터 수
- D: n 개의 데이터 오브젝트를 포함하는 집합
- 출력값: k 개의 클러스터
정석 순서
1. 데이터 오브젝트 집합 D에서 k 개의 데이터 오브젝트를 임의로 추출하고, 이 데이터 오브젝트들을 각 클러스터의 중심 (centroid) 으로 설정한다. (초기값 설정)
2. 집합 D의 각 데이터 오브젝트들에 대해 1. k 개의 클러스터 중심 오브젝트와의 거리를 각각 계산하고 2. 각 데이터 오브젝트가 어느 중심점 (centroid) 와 가장 유사도가 높은지 알아낸다. 3. 그렇게 찾아낸 중심점으로 각 데이터 오브젝트들을 할당한다.
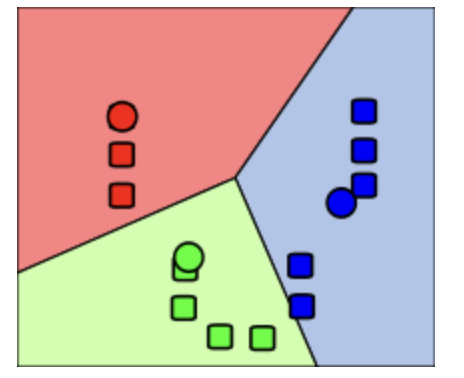
3. 클러스터의 중심점을 다시 계산한다. 즉, 2에서 재할당된 클러스터들을 기준으로 중심점을 다시 계산한다.
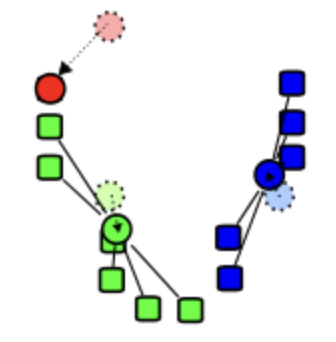
4. 각 데이터 오브젝트의 소속 클러스터가 바뀌지 않을 때까지 2, 3 과정을 반복한다.
5. K-평균 알고리즘을 실행합니다.
k-mean 라이브러리 쓴 순서
3. KMeans 모델을 만들고 적합합니다.
- 원하는 클러스터 수(K)로 KMeans 클래스를 인스턴스화하고 확장된 데이터에 모델을 맞춥니다.
k = 3  # Number of clusters
kmeans = KMeans(n_clusters=k)
kmeans.fit(scaled_data)
4. 클러스터 할당 및 중심을 얻습니다.
- 모델을 피팅한 후 각 데이터 포인트 및 최종 중심에 대한 클러스터 할당을 검색할 수 있습니다.
cluster_assignments = kmeans.labels_
centroids = kmeans.cluster_centers_
수업의 과정
from sklearn.cluster import KMeans
from sklearn.metrics import silhouette_score, silhouette_samples

X_features = customer_df[['Freq_log', 'SaleAmount_log', 'ElapsedDays_log']].values

# 정규 분포로 다시 스케일링하기
from sklearn.preprocessing import StandardScaler

X_features_scaled = StandardScaler().fit_transform(X_features)

kmeans = KMeans(n_clusters=3, random_state=0)
Y_labels = kmeans.fit_predict(X_features_scaled)
print (Y_labels)  # cluster별로 임의의 번호를 붙인 것

customer_df['ClusterLabel'] = Y_labels

customer_df.head()  #작업 확인용 출력
4. 시각화
데이터 세트가 2차원이거나 2차원으로 축소할 수 있는 경우 산점도를 사용하여 클러스터링 결과를 시각화할 수 있습니다.
from matplotlib import cm
cm.jet(1/4)

def clusterScatter(n_cluster, X_features):
    c_colors = []
    kmeans = KMeans(n_clusters=n_cluster, random_state=0)
    Y_labels = kmeans.fit_predict(X_features)

    for i in range(n_cluster):
        c_color = cm.jet(float(i) / n_cluster) #클러스터의 색상 설정
        c_colors.append(c_color)
        #클러스터의 데이터 분포를 동그라미로 시각화  , 0, 1 차원
        plt.scatter(X_features[Y_labels == i,0], X_features[Y_labels == i,1],
                     marker='o', color=c_color, edgecolor='black', s=50,
                     label='cluster '+ str(i))

    print (c_colors)
    #각 클러스터의 중심점을 삼각형으로 표시

    for i in range(n_cluster):
        plt.scatter(kmeans.cluster_centers_[i,0], kmeans.cluster_centers_[i,1],
                    marker='^', color=c_colors[i], edgecolor='w', s=200)

    plt.legend()
    plt.grid()
    plt.tight_layout()
    plt.show()
5. 최적의 k 찾기
-
k 값에 따라 clustering의 성능이 좌우됨
-
엘보우 방법 : 클러스터의 수를 순차적으로 늘려가면서 결과를 모니터링 한다. 만약 하나의 클러스터를 추가했을 때 이전보다 훨씬 더 나은 결과를 나타내지 않는다면, 이전의 클러스터의 수를 선택
평가지표 : 내부 평가 vs. 외부 평가
- 내부평가 : 클러스터링한 결과 그 자체를 놓고 평가하는 방식
- 외부평가 : 정답지와 대조
내부평가
- 클러스터 내 높은 유사도 (high intra-cluster similarity) : inertia , 클러스터 내 센트로이드 와의 거리 제곱합.
- 클러스터 간 낮은 유사도 (low inter-cluster similarity)
- 실루엣 : 각 개체 별로 (외부 cluster 멤버와의 거리 - 내부 cluster 멤버와의 거리)/ 최대거리
평균 실루엣 값이 1에 가까운 것이 좋음
inerita(관성) 이란?
- 다양한 K 값에 대한 관성 값을 플로팅하면 종종 최적의 클러스터 수에 해당하는 "팔꿈치 점"을 식별할 수 있습니다. => 최고퀄 클러스터를 판별하기 위함.
- But 과적합이 발생할 수 있어 실루엣 점수가 좀더 괜춘하다.
- 데이터 포인트가 해당 클러스터 중심에서 얼마나 떨어져 있는지 측정한 것입니다.
- k가 증가할 수록 낮아지고, 관성이 낮을수록 클러스터가 더 작고 잘 정의됩니다.
inerita 구하는 과정
distortions = []

for i in range(1, 6):
    kmeans_i = KMeans(n_clusters=i, random_state=0)  # 모델 생성
    kmeans_i.fit(X_features_scaled)   # 모델 훈련
    distortions.append(kmeans_i.inertia_) #  클러스터 내 센트로이드와의 거리 제곱합

plt.plot(range(1,6), distortions, marker='o')
plt.xlabel('Number of clusters')
plt.ylabel('Distortion')
plt.show()
silhouette 이란?
- 실루엣 점수는 K-평균 클러스터링에서 최적의 클러스터 수(K)를 결정하는 데 도움! => 최고퀄 클러스터를 판별하는 점수
- 실루엣 점수의 범위는 -1에서 1까지이며 값이 높을수록 클러스터링 품질이 우수함을 나타냅니다.
- 실루엣 점수가 높을수록 클러스터 내의 데이터 포인트가 서로 더 유사하고 다른 클러스터와 잘 분리되어 있음을 의미합니다.
silhouette 구하는 과정
- 클러스터링 후에 ㄱ
silhouette_values = silhouette_samples(X_features, Y_labels, metric='euclidean')
print (silhouette_values)
print (silhouette_values.mean())