9. 데이터의 표현 배열, 표
9-1. 들어가며
학습목표
- 데이터를 배열로 저장하는 것에 대해 이해하고 list, NumPy의 사용법을 학습
- 구조화된 데이터를 저장하는 것을 이해하고 dictionary와 Pandas 사용법을 학습
- 이미지 데이터를 NumPy 배열로 저장하는 것을 이해하고 사용법을 학습
- 학습한 자료 구조를 활용해서 통계 데이터를 어떻게 계산하는지 학습
목차
-
배열은 가까이에~ 기본 통계 데이터를 계산해 볼까?
- 평균 계산하기
- 배열을 활용한 평균, 표준편차, 중앙값 계산
-
끝판왕 등장! NumPy로 이 모든 걸 한방에!
- NumPy 소개
- NumPy 주요 기능
- NumPy로 기본 통계 데이터 계산해 보기
-
데이터의 행렬 변환
- 데이터의 행렬 변환
- 이미지의 행렬 변환
-
구조화된 데이터란?
- 구조화된 데이터란?
- 딕셔너리(dictionary)를 활용한 간단한 판타지 게임 logic 설계
-
구조화된 데이터와 Pandas
- Series, DataFrame
-
Pandas와 함께 EDA 시작하기
9-2 기본 통계 데이터를 계산 (1) 평균 계산하기
평균 계산하기
평균 계산 하기 위한 알고리즘
-
평균은 숫자들의 합을 총 숫자의 개수로 나눈 값
- 숫자들의 합을
total, 숫자의 개수는count로 변수명을 정하고 0으로 초깃값을 할당
- 숫자들의 합을
-
사용자가 입력하는 숫자는
input함수를 사용해 받기, 숫자를 입력하지 않으면 종료 -
while 문으로 조건 지정 반복문을 설정
- 숫자를 입력하지 않으면 종료
- 조건은
input함수에서 받은 값이 ""이 되면False→ while 문을 빠져나오게 코딩
- 조건은
- 숫자를 입력하지 않으면 종료
-
while 문의 조건이
True면count와total이 갱신- 반복문이 실행될 때마다 count를 1씩 증가시키기 위해 증감 연산자를 사용
total에는input으로 받은 숫자를 더하기input함수가 return하는 값의 자료형은 문자열str이니float로 맏드시 타입 변환
-
혹시라도 사용자가 숫자가 아닌 엉뚱한 문자열을 입력하면 어떻게 할까요?
- 사용자로부터 숫자가 아닌 것을 입력받을 때는 예외 처리를 하기
실행코드
# 1
total = 0
count = 0
# 2
numbers = input("Enter a number :  (<Enter Key> to quit)")
# 3
while numbers != "":
    # 5
    try:
        # 4
        x = float(numbers)
        count += 1
        total = total + x
    except ValueError:
        print('NOT a number! Ignored..')
    numbers = input("Enter a number :  (<Enter Key> to quit)")
avg = total / count
print("\n average is", avg)
9-3 배열은 가까이에~ 기본 통계 데이터를 계산
(2) 배열을 활용한 평균, 표준편차, 중앙값 계산
1. 배열의 의미
- 리스트 : 데이터 값 전체를 하나의 객체에 순서대로 모아 놓을 수 있는 객체
- X = [x1, x2, x3,....xn]
2. 사용자가 입력한 숫자들을 배열로 만들기
<실행코드>
# 2개 이상의 숫자를 입력받아 리스트에 저장하는 함수
def numbers():
    X=[]    # X에 빈 리스트를 할당합니다.
    while True:
        number = input("Enter a number (<Enter key> to quit)")
        while number != "":
            try:
                x = float(number)
                X.append(x)    # float형으로 변환한 숫자 입력을 리스트에 추가합니다.
            except ValueError:
                print('>>> NOT a number! Ignored..')
            number = input("Enter a number (<Enter key> to quit)")
        if len(X) > 1:  # 저장된 숫자가 2개 이상일 때만 리턴합니다.
            return X

X = numbers()

print('X :', X)
✨ 동적 배열(Dynamic Array) : 임의의 데이터 타입을 담을 수 있는 가변적 연속열(Sequence)형
- 파이썬 지원
import array as arr

mylist = [1, 2, 3]   # 이것은 파이썬 built-in list입니다.
print(type(mylist))

mylist.append('4')  # mylist의 끝에 character '4'를 추가합니다.
print(mylist)

mylist.insert(1, 5)  # mylist의 두번째 자리에 5를 끼워넣습니다.
print(mylist)

myarray = arr.array('i', [1, 2, 3])   # 이것은 array입니다. import array를 해야 쓸 수 있습니다.
print(type(myarray))

# 아래 라인의 주석을 풀고 실행하면 에러가 납니다.
#myarray.append('4')    # myarray의 끝에 character '4'를 추가합니다.
print(myarray)

myarray.insert(1, 5)    # myarray의 두번째 자리에 5를 끼워넣습니다.
print(myarray)
☀️ 파이썬에서는 List가 array보다 쓰기 편하다
3. 리스트를 활용한 평균 구하기
- 시그마를 이용한 평균 구하는 공식
- <2번에서 만든 리스트를 for문을 이용해 평균 구하는 코드>
total = 0.0
for i in range(len(X)):
    total = total + X[i]
mean = total / len(X)

print('sum of X: ', total)
4. 중앙값(Median)
: 주어진 숫자를 크기 순서대로 배치할 때 가장 중앙에 위치하는 숫자
- <2번에서 만든 리스트를 for문을 이용해 중앙값 구하는 코드>
def median(nums):  		# nums : 리스트를 지정하는 매개변수
    nums.sort()					# sort()로 리스트를 순서대로 정렬
    size = len(nums)
    p = size // 2
    if size % 2 == 0:		   # 리스트의 개수가 짝수일때
        pr = p                         # 4번째 값
        pl = p-1                      # 3번째 값
        mid= float((nums[pl]+nums[pr])/2)
    else:								# 리스트의 개수가 홀수일때
        mid = nums[p]
    return mid

print('X :', X)
median(X)						# 매개변수의 값으로 X를 사용함
5. 표준편차와 평균
- 평균을 구하는 함수
def means(nums):
    total = 0.0
    for i in range(len(nums)):
        total = total + nums[i]
    return total / len(nums)

means(X)- 표준편차를 구하는 함수
avg = means(X)

def std_dev(nums, avg):
   texp = 0.0
   for i in range(len(nums)):
       texp = texp + (nums[i] - avg)**2    # 각 숫자와 평균값의 차이의 제곱을 계속 더한 후
   return (texp/len(nums)) ** 0.5    # 그 총합을 숫자개수로 나눈 값의 제곱근을 리턴합니다.

std_dev(X,avg)
6. 전체 코드 : main()함수
위에 구현한 코드를 순서대로 사용
- 우리가 구현하고자 하는 값은 사용자가 입력한 숫자들에 대한 평균값, 중앙값, 표준편차
- 사용자가 입력한 숫자를 배열(리스트)로 만들기
- 각 숫자의 평균값과 중앙값을 구하기
- 각 숫자의 표준편차를 구하기
< 함수로 구현된 코드>
med = median(X)
avg = means(X)
std = std_dev(X, avg)
print("당신이 입력한 숫자{}의 ".format(X))
print("중앙값은{}, 평균은{}, 표준편차는{}입니다.".format(med, avg, std))
<전체코드>
def numbers():
    X=[]
    while True:
        number = input("Enter a number (<Enter key> to quit)")
        while number !="":
            try:
                x = float(number)
                X.append(x)
            except ValueError:
                print('>>> NOT a number! Ignored..')
            number = input("Enter a number (<Enter key> to quit)")
        if len(X) > 1:
            return X

def median(nums):
    nums.sort()
    size = len(nums)
    p = size // 2
    if size % 2 == 0:
        pr = p
        pl = p-1
        mid = float((nums[pl]+nums[pr])/2)
    else:
        mid = nums[p]
    return mid

def means(nums):
    total = 0.0
    for i in range(len(nums)):
        total = total + nums[i]
    return total / len(nums)

def std_dev(nums, avg):
   texp = 0.0
   for i in range(len(nums)):
       texp = texp + (nums[i] - avg) ** 2
   return (texp/len(nums)) ** 0.5

def main():
    X = numbers()
    med = median(X)
    avg = means(X)
    std = std_dev(X, avg)
    print("당신이 입력한 숫자{}의 ".format(X))
    print("중앙값은{}, 평균은{}, 표준편차는{}입니다.".format(med, avg, std))

if __name__ == '__main__':
    main()
9-4. 끝판왕 등장! NumPy로 이 모든 걸 한방에! (1) NumPy 소개
1. NumPy(Numerical Python)
- 과학 계산용 고성능 컴퓨팅과 데이터 분석에 필요한 파이썬 패키지
- 설치
- pip install numpy
- 패키지, 모듈, 라이브러리 간단히 이해할 수 있는 블로그
2. 장점
- 빠르고 메모리를 효율적으로 사용하여 벡터의 산술 연산과 브로드캐스팅 연산을 지원하는 다차원 배열
ndarray데이터 타입을 지원 - 반복문을 작성할 필요 없이 전체 데이터 배열에 대해 빠른 연산을 제공하는 다양한 표준 수학 함수를 제공
- 배열 데이터를 디스크에 쓰거나 읽기 가능(즉 파일로 저장한다는 뜻입니다)
- 선형대수, 난수발생기, 푸리에 변환 가능, C/C++ 포트란으로 쓰여진 코드를 통합
9-5. 끝판왕 numpy로 이 모든걸 한방에! (2) NumPy 주요 기능
1. ndarray만들기
import numpy as np

# 아래 A와 B는 결과적으로 같은 ndarray 객체를 생성합니다.
A = np.arange(5)
B = np.array([0,1,2,3,4])  # 파이썬 리스트를 numpy ndarray로 변환

# 하지만 C는 좀 다를 것입니다.
C = np.array([0,1,2,3,'4'])   # 하나의 원소만 문자열 -> 전체가 문자열로 변경

# D도 A, B와 같은 결과를 내겠지만, B의 방법을 권합니다.
D = np.ndarray((5,), np.int64, np.array([0,1,2,3,4]))

print(A)
print(type(A))
print("--------------------------")
print(B)
print(type(B))
print("--------------------------")
print(C)
print(type(C))
print("--------------------------")
print(D)
print(type(D))
<실행결과>
[0 1 2 3 4]
<class 'numpy.ndarray'>
--------------------------
[0 1 2 3 4]
<class 'numpy.ndarray'>
--------------------------
['0' '1' '2' '3' '4']
<class 'numpy.ndarray'>
--------------------------
[0 1 2 3 4]
<class 'numpy.ndarray'>

A, B, D는 동일
✋ numpy.ndarray는 데이터타입이 동일해야함 → 한 개의 문자열 있으면 모두 문자열로 변경
2. 크기 (size, shape, ndim)
✋ numpy의 코드형태 : 변수명.명령어
- ndarray.size : 행렬의 개수
- ndarray.shape : 행렬의 모양
- ndarray.ndim : 행렬의 축의 개수
- reshape() : 행렬의 모양 바꾸기
A = np.arange(10).reshape(2, 5)   # 길이 10의 1차원 행렬을 2X5 2차원 행렬로 바꿔봅니다.

print("행렬의 모양:", A.shape)
print("행렬의 축 개수:", A.ndim)
print("행렬 내 원소의 개수:", A.size)

<실행결과>
행렬의 모양: (2, 5)
행렬의 축 개수: 2
행렬 내 원소의 개수: 10
✋ 행렬의 모양과 원소의 개수가 맞지 않으면 에러
3. type
NumPy 라이브러리 내부의 자료형들은 파이썬 내장함수와 동일
: 헷갈리는 메서드 → dtype, type()
- NumPy : numpy, array, dtype
- 파이썬 : type()
int(A)
print(A.dtype)
print(type(A))
print("-------------------------")

B = np.array([0, 1, 2, 3, 4, 5])
print(B)
print(B.dtype)
print(type(B))
print("-------------------------")

C = np.array([0, 1, 2, 3, '4', 5])
print(C)
print(C.dtype)
print(type(C))
print("-------------------------")

# dtype을 명시햐면 warring 메세지가 생성되지 않음
D = np.array([0, 1, 2, 3, [4, 5], 6], dtype=object)
print(D)
print(D.dtype)
print(type(D))- dtype: NumPy ndarray의 "원소"의 데이터 타입을 반환
- type(A) : A의 자료형이 반환
- object : 파이썬의 최상위 클래스
- NumPy의 장점
- Array 답게 연산속도를 최적화하도록 원소들을 관리
- 필요에 따라 가장 효율적인 방법으로 type을 변화시켜 관리
4. 특수행렬
- 단위행렬 : numpy.eye(행의수)
- 0행렬 : numpy.zeros([행, 열])
- 1행렬 : numpy.ones([행, 열])
# 단위행렬
np.eye(3)

<실행결과>
array([[1., 0., 0.],
       [0., 1., 0.],
       [0., 0., 1.]])
# 0 행렬
np.zeros([2,3])
<실행결과>
array([[0., 0., 0.],
[0., 0., 0.]])# 1행렬
np.ones([3,3])
<실행결과>
array([[1., 1., 1.],
[1., 1., 1.],
[1., 1., 1.]])5. 브로드캐스트
: ndarray와 상수, 또는 서로 크기가 다른 ndarray끼리 산술연산이 가능한 기능
: 원소끼리 연산
- ndarray의 열의 수가 같아야 하고, 행은 실수배가 가능할 때 연산 가능
A = np.arange(9).reshape(3,3)
A

<실행결과>
array([[0, 1, 2],
       [3, 4, 5],
       [6, 7, 8]])
# ndarray A에 2를 상수배 했을 때,
A * 2
<실행결과>
array([[ 0, 2, 4],
[ 6, 8, 10],
[12, 14, 16]])# 3 X 3 행렬에 1 X 3 행렬을 더했을 때
A = np.arange(9).reshape(3,3)
B = np.array([1, 2, 3])
print("A:", A)
print("B:", B)
print("\nA+B:", A+B)
<실행결과>
A: [[0 1 2]
[3 4 5]
[6 7 8]]
B: [1 2 3]
A+B: [[ 1 3 5]
[ 4 6 8]
[ 7 9 11]]6. 슬라이스와 인덱싱
: 파이썬 내장 리스트와 비슷한 슬라이스와 인덱싱 연산을 제공
# 3 X 3 행렬의 첫번째 행을 구해 봅시다.
A = np.arange(9).reshape(3,3)
print("A:", A)
B = A[0]
print("B:", B)

<실행결과>
A: [[0 1 2]
 [3 4 5]
 [6 7 8]]
B: [0 1 2]
# 0, 1을 인덱싱 하면 A의 첫번째 행에서 두번째 값을 참조합니다.
# 아래 두 결과는 정확히 같습니다.
print(A[0, 1])
print(B[1])
<실행결과>
1
1# 슬라이싱도 비슷합니다.
A[:-1]
<실행결과>
array([[0, 1, 2],
[3, 4, 5]])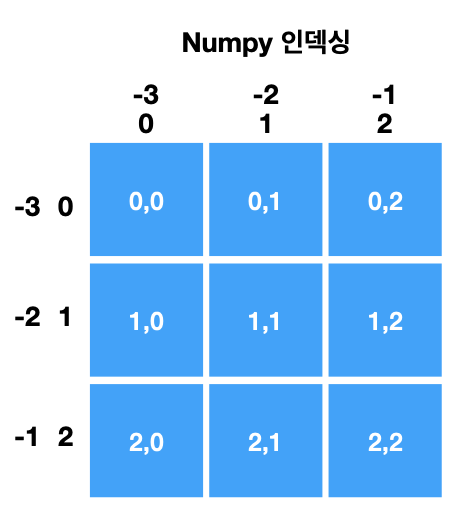
# 이 슬라이싱의 결과는
print(A[:,2:])   # print(A[:,-1:]) 같은의미
<실행결과>
[[2]
 [5]
 [8]]

print(A[:,1:])    # print(A[:,-2:])
<실행결과>
[[1 2]
 [4 5]
 [7 8]]

print(A[:,:])   # print(A[:,-3:])
<실행결과>
[[0 1 2]
 [3 4 5]
[6 7 8]]✋[행 , 열] → 행의 내부(시작 : 종착), 열의 내부(시작 : 종착)
**전체선택 → : (수는 적지 않고 클론만)**

**단독선택 :  행 → [인덱스번호]   열 → [ : , 인덱스번호]**
7. random
: 난수 지원 , np.random 패키지
- np.random.randint() : 1개 정수형 난수 하나를 생성
- 범위 지정 가능 : np.random.randint(0, 10) = np.random.randint(10)
- np.random.choice() : 리스트에 주어진 값 중 하나를 랜덤하게 선택
- np.random.permutation() : 무작위 배열 생성
- np.random.permutation(원소의 개수) → 0부터 시작
- np.random.permutation(리스트)
- np.random.normal() : 정규분포를 따르는 표본 추출
- 매개변수
- loc : 평균, scale : 표준편차, size : 추출개수
- 매개변수
- np.random.uniform() : 균등분포를 따르는 표본 추출
- 매개변수
- low : 최소값, high : 최대값, size : 추출개수
- 매개변수
# 0에서 1사이의 실수형 난수 하나를 생성합니다.
print(np.random.random())
-> 0.2523880029246135

# 0~9 사이 1개 정수형 난수 하나를 생성합니다.
print(np.random.randint(0,10))
-> 8
# 리스트에 주어진 값 중 하나를 랜덤하게 골라줍니다.
print(np.random.choice([0,1,2,3,4,5,6,7,8,9]))
-> 3

# 무작위로 섞인 배열을 만들어 줍니다.
# 아래 2가지는 기능면에서 동일합니다.
print(np.random.permutation(10))
-> [8 2 3 4 6 5 7 1 9 0]

print(np.random.permutation([0,1,2,3,4,5,6,7,8,9]))
-> [8 3 9 6 0 7 5 4 1 2]

# 어떤 분포를 따르는 변수를 임의로 표본추출

# 정규분포
# 평균(loc), 표준편차(scale), 추출개수(size)
print(np.random.normal(loc=0, scale=1, size=5))
-> [-1.17108058 -0.25100672 -0.11313579  3.75621283 -0.48516592]

# 균등분포
# 최소(low), 최대(high), 추출개수(size)
print(np.random.uniform(low=-1, high=1, size=5))
-> [ 0.57023623 -0.53225445  0.51310595 -0.85032188 -0.77446376]
8. 전치행렬
: 행, 열의 위치 바꾸기 : 배열명.T, 배열명.transpose()
- 2차원 배열 : 행, 열 위치 바꾸기
- 배열명.T == 배열명.transpose() == np.transpse(배열명)
- 3차원 배열 : 축의 순서에 따라 구조가 바뀜
- 배열명.T == 배열명.transpose((2,1,0))
- 배열명.reshape(2,3,4) → axis(0,1,2)
A = np.arange(24).reshape(2,3,4)
# A는 (2,3,4)의 shape를 가진 행렬
print("A:", A)
print("A의 전치행렬:", A.T)
# A의 전치행렬은 (4,3,2)의 shape를 가진 행렬
print("A의 전치행렬의 shape:", A.T.shape)

A:
  [[[ 0  1  2  3]
  [ 4  5  6  7]
  [ 8  9 10 11]]

 [[12 13 14 15]
  [16 17 18 19]
  [20 21 22 23]]]

A의 전치행렬:
[[[ 0 12]
  [ 4 16]
  [ 8 20]]

 [[ 1 13]
  [ 5 17]
  [ 9 21]]
B = np.transpose(A, (2,0,1))
# A는 (2,3,4)의 shape를 가진 행렬
print("A:", A)
# B는 A의 3, 1, 2번째 축을 자신의 1, 2, 3번째 축으로 가진 행렬
print("B:", B)
# B는 (4,2,3)의 shape를 가진 행렬
print("B.shape:", B.shape)
<실행결과>
A:
[[[ 0 1 2 3]
[ 4 5 6 7]
[ 8 9 10 11]]
[[12 13 14 15]
[16 17 18 19]
[20 21 22 23]]]
B:
[[[ 0 4 8]
[12 16 20]]
[[ 1 5 9]
[13 17 21]]
[[ 2 6 10]
[14 18 22]]
[[ 3 7 11]
[15 19 23]]]
B.shape: (4, 2, 3)✋ 전치행렬 참고 블로그
9-6. 끝판왕 등장! NumPy로 이 모든 걸 한방에! (3) NumPy로 기본 통계 데이터 계산해 보기
: NumPy에서 제공하는 함수들을 이용해서 위에서 계산한 평균, 표준편차, 중앙값을 계산
import numpy as np

def numbers():
    X = []
    number = input("Enter a number (<Enter key> to quit)")
    # 하지만 2개 이상의 숫자를 받아야 한다는 제약조건을 제외하였습니다.
    while number != "":
        try:
            x = float(number)
            X.append(x)
        except ValueError:
            print('>>> NOT a number! Ignored..')
        number = input("Enter a number (<Enter key> to quit)")
    return X

def main():
    nums = numbers()       # 이것은 파이썬 리스트입니다.
    num = np.array(nums)   # 리스트를 Numpy ndarray로 변환합니다.
    print("합", num.sum())
    print("평균값",num.mean())
    print("표준편차",num.std())
    print("중앙값",np.median(num))   # num.median() 이 아님에 유의해 주세요.

main()

Enter a number (<Enter key> to quit) 10
Enter a number (<Enter key> to quit) 20
Enter a number (<Enter key> to quit) 30
Enter a number (<Enter key> to quit) 40
Enter a number (<Enter key> to quit) 50
Enter a number (<Enter key> to quit)
합 150.0
평균값 30.0
표준편차 14.142135623730951
중앙값 30.0
9-7. 데이터의 행렬 변환 (1)
1. 배열 형태의 데이터를 다루기 위해 NumPy의 ndarray를 활용하면 코딩 용이
2. 영상, 이미지, 텍스트, 소리 등 다양한 형태의 데이터를 숫자, 혹은 행렬 형태로 표현
3. NumPy를 이용한 다양한 데이터의 표현 방법을 정리한 블로그
4. 다양한 데이터의 표현 방법에 대한 질문들
-
소리 데이터의 경우 NumPy로 어떻게 표현하나요?
예시답안
1차원 array로 표현한다. CD음원파일의 경우, 44.1kHz의 샘플링 레이트로 -32767 ~ 32768의 정수 값을 갖는다.
-
흑백 이미지의 경우 NumPy로 어떻게 표현 하나요?
예시답안
이미지 사이즈의 세로X 가로 형태의 행렬(2차원 ndarray)로 나타내고, 각 원소는 픽셀별로 명도(grayscale)를 0~255 의 숫자로 환산하여 표시한다. 0은 검정, 255는 흰색이다.
-
컬러 이미지의 경우 NumPy로 어떻게 표현 하나요?
예시답안
이미지 사이즈의 세로 X 가로x3 형태의 3차원 행렬이다. 3은 Red, Green, Blue계열의 3 색을 의미한다.
-
Q4. 자연어(블로그에서는 Language로 표기)의 경우 NumPy로 어떻게 표현 하나요?
예시답안
임베딩(Embedding)이라는 과정을 거쳐 ndarray로 표현될 수 있다. 블로그의 예시에서는 71,290개의 단어가 들어있는 (문장들로 이루어진) 데이터셋이 있을때, 이를 단어별로 나누고 0 - 71,289로 넘버링했다. 이를 토큰화 과정이라고 한다. 이 토큰을 50차원의 word2vec embedding 을 통해 [batch_size, sequence_length, embedding_size]의 ndarray로 표현할 수 있다.
9-8. 데이터의 행렬 변환 (2) 이미지의 행렬 변환
1. 픽셀과 이미지
1) 디지털로 표현되는 이미지는 수많은 점(픽셀)으로 구성
2) 필셀의 변화에 따른 이미지의 해상도

[https://en.wikipedia.org/wiki/Image_resolution](https://en.wikipedia.org/wiki/Image_resolution)3) 이미지와 픽셀의 관계에 관한 기본적인 사실만 나열
- 이미지는 수많은 점(픽셀)들로 구성
- 각각의 픽셀은 R, G, B 값 3개 요소의 튜플로 색상이 표시 (Red, Green, Blue의 값)
- 흰색(W) : (255,255,255)
- 검정색(B) : (0, 0, 0)
- 빨간색(R) : (255, 0, 0)
- 파란색(B) : (0, 0, 255)
- 녹색(G) : (0, 128, 0)
- 노란색(Y) : (255, 255, 0)
- 보라색(P) : (128, 0, 128)
- 회색(Gray) : (128, 128, 128)
- 흑백의 경우에는 Gray 스케일로 나타내는데, 0~255 범위의 숫자 1개의 튜플 값
- Color는 투명도를 포함하는 A(alpha)를 포함해 RGBA 4개로 표시
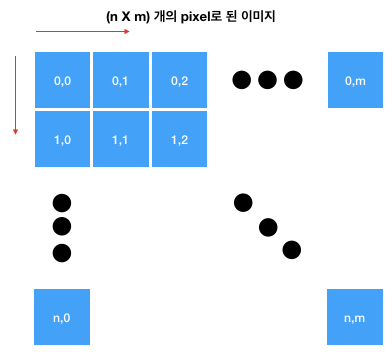
- 아래 그림처럼 Image의 좌표는 보통 왼쪽 위를 (0, 0)으로 표시하고, 오른쪽과 아래로 내려갈수록 좌표가 증가
2. 이미지와 관련된 파이썬 라이브러리
- matplotlib
- PIL
- 이미지 파일을 열고, 자르고, 복사하고, rgb 색상 값을 가져오는 등 이미지 파일과 관련된 몇 가지 작업을 수행합니다. 이렇게 처리한 파일을 NumPy를 이용해 행렬로 빠르게 연산해서 이미지를 더 빠르게 작업
import matplotlib as mpl
import PIL

print( f'# matplotlib: {mpl.__version__}' )
print(f'# PIL:  {PIL.__version__}')

<실행결과>
# matplotlib: 3.4.3
# PIL:  8.3.2
3. 간단한 이미지 조작
1) 이미지 조작에 쓰이는 메서드
- open :
Image.open() - size :
Image.size - filename :
Image.filename - crop :
Image.crop((x0, y0, xt, yt)) - resize :
Image.resize((w,h)) - save :
Image.save()
2) open
Cloud Shell에서~/aiffel/data_represent/image디렉터리에 이미지가 준비$ mkdir -p ~/aiffel/data_represent/image $ ln -s ~/data/newyork.jpg ~/aiffel/data_represent/imagefrom PIL import Image, ImageColor import os img_path = os.getenv("HOME") + "/aiffel/data_represent/image/newyork.jpg" img = Image.open(img_path) print(img_path) print(type(img)) img <실행결과> /aiffel/aiffel/data_represent/image/newyork.jpg <class 'PIL.JpegImagePlugin.JpegImageFile'>

3. size
W, H = img.size
print((W, H))

<실행결과>
(212, 300) #가로X세로가 각각 튜플 값으로 반환print(img.format)
print(img.size)
print(img.mode)
<실행결과>
JPEG
(212, 300)
RGB4. 이미지 자르기
: .crop() 메서드를 이용, 인자로 튜플값, 가로 세로의 시작점과 가로, 세로의 종료점 총 4개를 입력
img.crop((30,30,100,100))
5. 저장
: .save() 메서드를 사용하고, 매개변수로 파일 이름을 넣어 줍니다.
# 새로운 이미지 파일명
cropped_img_path = os.getenv("HOME") + "/aiffel/data_represent/image/cropped_img.jpg"
img.crop((30,30,100,100)).save(cropped_img_path)
print("저장 완료!")
<저장경로확인>
!ls ~/aiffel/data_represent/image/cropped_img.jpg

<실행결과?
/aiffel/aiffel/data_represent/image/cropped_img.jpg
6. 행렬로 변환
: Pillow 라이브러리는 손쉽게 이미지를 Numpy ndarray로 변환 가능
import numpy as np
img_arr = np.array(img)
print(type(img))
print(type(img_arr))
print(img_arr.shape)
print(img_arr.ndim)

<실행결과>
<class 'PIL.JpegImagePlugin.JpegImageFile'>
<class 'numpy.ndarray'>
(300, 212, 3)
3
7. 흑백 모드
: Image.open().convert('L')로 모드를 이용하면 흑백모드로 open
img_g = Image.open(img_path).convert('L')
img_g
# 행렬로 변환
img_g_arr = np.array(img_g)
print(type(img_g_arr))
print(img_g_arr.shape)
print(img_g_arr.ndim)

<실행결과>
<class 'numpy.ndarray'>
(300, 212)
2
8. get color
: getcolor()는 각 색상이 RGB 값으로 어떻게 표현되는지를 반환
red = ImageColor.getcolor('RED','RGB')
reda = ImageColor.getcolor('red','RGBA')
yellow = ImageColor.getcolor('yellow','RGB')
print(red)
print(reda)
print(yellow)

<실행결과>
(255, 0, 0)
(255, 0, 0, 255)
(255, 255, 0)
📌 Data augmentation : 딥러닝에서 데이터의 개수를 늘릴 때 사용되는 기법
9-9. 구조화된 데이터란?
1. 해시(hash) - 키(key)를 사용해 데이터에 접근하는 데이터 구조
- Key와 Value로 구성되어 있는 자료 구조로 두 개의 열만 갖지만 수많은 행을 가지는 구조체

2. Python dictionay
- 중괄호
{}를 이용하고키 : 값의 형태
# 파이썬 dict 로 표현한 전화번호부입니다.
Country_PhoneNumber = {'Korea': 82, 'America': 1, 'Swiss': 41, 'Italy': 39, 'Japan': 81, 'China': 86, 'Rusia': 7}
# 키를 가지고 값을 조회
Country_PhoneNumber['Korea']

<실행결과>
82
9-10. 딕셔너리(dictionary)를 활용한 간단한 판타지 게임 logic 설계
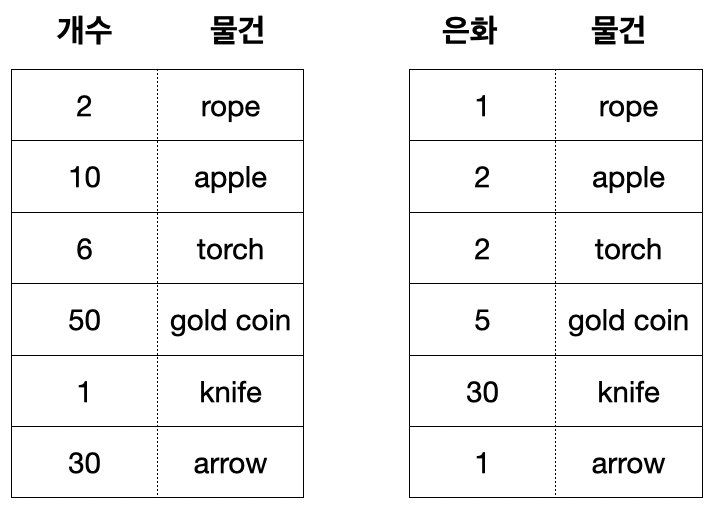
1. 보물 상자 안에 물품, 물품의 개수, 은화의 관계 보기
2. 플레이어가 습득한 물건을 은화로 바꾸기 프로그램 설계
1) 보물상자 딕셔너리로 만들기, 물품을 보여주는 함수
# 보물상자 물품 딕셔너리 만들기
treasure_box = {'rope':2,
                'apple':10,
                'torch': 6,
                'gold coin': 50,
                'knife': 1,
                'arrow': 30}

# 딕셔너리 물품을 for문을 이용해 출력 - 딕셔너리명.items()이용
# 딕셔너리명.items() - key, value 반환 - ()이기 때문에 튜플반환
def display_stuff(treasure_box):
    print("Congraturation!! you got a treasure box")
    for k, v in treasure_box.items():
        print("you have {} {}pcs".format(k, v))

# 함수 호출
display_stuff(treasure_box)

<실행결과>
Congraturation!! you got a treasure box
you have rope 2pcs
you have apple 10pcs
you have torch 6pcs
you have gold coin 50pcs
you have knife 1pcs
you have arrow 30pcs
2) 물품을 통해 얻을 은화를 보여주는 함수
# 물뭎 개당 은화 수
coin_per_treasure = {'rope':1,
        'apple':2,
        'torch': 2,
        'gold coin': 5,
        'knife': 30,
        'arrow': 1}

# 함수 정의
def total_silver(treasure_box, coin_per_treasure):
    total_coin = 0
    for treasure in treasure_box:
        coin = coin_per_treasure[treasure] * treasure_box[treasure]
        print("{} : {}coins/pcs * {}pcs = {} coins".format(
          treasure, coin_per_treasure[treasure], treasure_box[treasure], coin))
        total_coin += coin
    print('total_coin : ', total_coin)

total_silver(treasure_box, coin_per_treasure)
➡️ 보물 상자 안의 물품과 개수와 은화를 각각의 딕셔너리 형태로 저장하고, 동일한 단어를 키로 사용해서 각각의 데이터 값을 매칭
3) 딕셔너리의 딕셔너리 : 데이터를 하나의 변수에 저장
treasure_box = {'rope': {'coin': 1, 'pcs': 2},
                'apple': {'coin': 2, 'pcs': 10},
                'torch': {'coin': 2, 'pcs': 6},
                'gold coin': {'coin': 5, 'pcs': 50},
                'knife': {'coin': 30, 'pcs': 1},
               	'arrow': {'coin': 1, 'pcs': 30}
               }
treasure_box['rope']

<실행결과>
{'coin': 1, 'pcs': 2}
<참고>
📌 for문을 이용해 딕셔너리 key, value 구하기
treasure_box = {'rope':2,
                'apple':10,
                'torch': 6,
                'gold coin': 50,
                'knife': 1,
                'arrow': 30}

# i는 key값, 딕셔너리[i]는 value
for i in treasure_box:
  print(i, treasure_box[i])

<실행결과>
rope 2
apple 10
torch 6
gold coin 50
knife 1
arrow 30
📌 list for문을 이용한 값 출력
lst = ['H', 'e', 'l', 'l', 'o']

for i in lst:
	print(i, end="")

<실행결과>
Hello
📌 for ~ in문
- 리스트, 튜플 : 값출력
- 딕셔너리 : 키값 출력
9-11. 구조화된 데이터와 pandas (1) Series
pandas라는 파이썬 라이브러리는 Series와 DataFrame이라는 자료 구조를 제공해요. 이 데이터 타입을 활용하면 구조화된 데이터를 더 쉽게 다룰 수 있습니다.
-
pandas의 특징
- NumPy기반에서 개발되어 NumPy를 사용하는 애플리케이션에서 쉽게 사용 가능
- 축의 이름에 따라 데이터를 정렬할 수 있는 자료 구조
- 다양한 방식으로 인덱싱(indexing)하여 데이터를 다룰 수 있는 기능
- 통합된 시계열 기능과 시계열 데이터와 비시계열 데이터를 함께 다룰 수 있는 통합 자료 구조
- 누락된 데이터 처리 기능
- 데이터베이스처럼 데이터를 합치고 관계 연산을 수행하는 기능
-
pandas pip을 이용해서 설치
- pip install pandas
1. Series
1) 1차원 배열과 비슷한 자료 구조
- 리스트, 튜플, 딕셔너리 또는 NumPy 자료형(정수형, 실수형 등)으로 생성 가능
import pandas as pd
ser = pd.Series(['a','b','c',3])
ser

<실행결과>
0    a
1    b
2    c
3    3
dtype: object
2) Series의 인덱스(Index)
- pandas의 Series에는
index와value가 존재 index는 순서를 나타낸 숫자,value는 배열로 표현된 실제 데이터의 값-
Series객체의values를 호출 →array형태로 반환ser.values <실행결과> array(['a', 'b', 'c', 3], dtype=object) -
인덱스는
RangeIndex(정수형 인덱스)가 반환ser.index <실행결과> RangeIndex(start=0, stop=4, step=1)
-
3) 인덱스 설정 : Series의 인자로 넣어주는 방법
- 조화된 데이터를 표현할 수 있는 이유는 인덱스에 다른 값을 넣을 수 있기 때문
- 인덱스 설정 하는 방법(1) : Series의 인자로 넣어주기
ser2 = pd.Series(['a', 'b', 'c', 3], index=['i','j','k','h'])
ser2

<실행결과>
i    a
j    b
k    c
h    3
dtype: object
- 인덱스 설정 하는 방법(2) : 할당 연산자
ser2.index = ['Jhon', 'Steve', 'Jack', 'Bob'] ser2 <실행결과> Jhon a Steve b Jack c Bob 3 dtype: object - index를 조회
ser2.index <실행결과> Index(['Jhon', 'Steve', 'Jack', 'Bob'], dtype='object') - 파이썬 딕셔너리 타입의 데이터를
Series객체로 생성 : 딕셔너리의 키가 인덱스로 설정
Country_PhoneNumber = {'Korea': 82, 'America': 1, 'Swiss': 41, 'Italy': 39, 'Japan': 81, 'China': 86, 'Rusia': 7}
ser3 = pd.Series(Country_PhoneNumber)
ser3

<실행결과>
Korea      82
America     1
Swiss      41
Italy      39
Japan      81
China      86
Rusia       7
dtype: int64
📌 파이썬 딕셔너리를 사용해 생성한 Series에서는 딕셔너리의 키가 인덱스로 설정
- "0부터 시작하는 정수 형태"에서는 리스트, "값이 할당된" 인덱스에서는 딕셔너리와 유사
-
값이 할당된 인덱스 형태에 대해서 슬라이싱(slicing) 기능을 지원
ser3['Korea'] <실행결과> 82ser3['Italy':] <실행결과> Italy 39 Japan 81 China 86 Rusia 7 dtype: int64
-
4) Series의 Name
Series객체의name속성을 이용해서Series객체의 이름을 설정Series인덱스의name속성을 이용해 인덱스 이름을 설정
ser3.name = 'Country_PhoneNumber'
ser3.index.name = 'Country_Name'
ser3

<실행결과>
Country_Name
Korea      82
America     1
Swiss      41
Italy      39
Japan      81
China      86
Rusia       7
Name: Country_PhoneNumber, dtype: int64
9-12. 구조화된 데이터와 pandas (2) DataFrame
1. DataFrame
- 표(table)와 같은 자료 구조
- DataFrame : 여러 개의 컬럼 존재
- Series : 한 개의 인덱스 컬럼과 값 컬럼(2개의 컬럼만 존재)
- 딕셔너리 : 키 컬럼과 값 컬럼(2개의 컬럼만 존재)
- csv 파일이나 excel 파일을 DataFrame으로 많이 변환.
1) 딕셔너리를 Series로 변환
data = {'Region' : ['Korea', 'America', 'Chaina', 'Canada', 'Italy'],
        'Sales' : [300, 200, 500, 150, 50],
        'Amount' : [90, 80, 100, 30, 10],
        'Employee' : [20, 10, 30, 5, 3]
        }
s = pd.Series(data)
s

<실행결과>
Region      [Korea, America, Chaina, Canada, Italy]
Sales                      [300, 200, 500, 150, 50]
Amount                        [90, 80, 100, 30, 10]
Employee                         [20, 10, 30, 5, 3]
dtype: object
2) 딕셔너리를 DataFrame으로 변환
d = pd.DataFrame(data)
d
<실행결과>

3) Index와 Column Index도 설정 가능 → Series의 name == DataFrame의 Column 명
d.index=['one','two','three','four','five']
d.columns = ['a','b','c','d']
d
<실행결과>
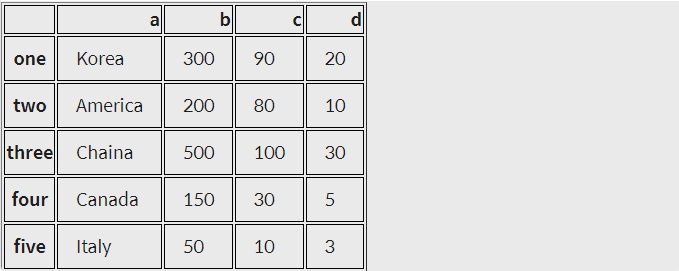
4) 구조화된 데이터의 표현법
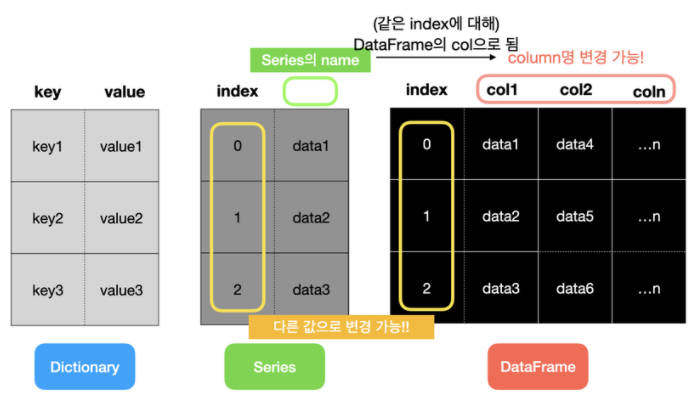
9-13. pandas와 함께 EDA 시작하기
EDA(Exploratory Data Analysis) - 데이터를 탐색
- EDA의 기본 : 데이터의 대푯값과 분산을 구하는 것
✋ Pandas 라이브러리는 수학 메서드와 통계 메서드 제공
1. 이탈리아 코로나바이러스 현황 데이터를 가지고 간단한 EDA를 연습
1) 데이터 준비하기
$ mkdir -p ~/aiffel/data_represent/data
$ ln -s ~/data/covid19_italy_region.csv  ~/aiffel/data_represent/data
2) CSV 파일 읽기
- csv 파일을 DataFrame 객체로 읽기
type()으로 확인해 보면 자료형은 DataFrame
import pandas as pd
import os

csv_path = os.getenv("HOME") + "/aiffel/data_represent/data/covid19_italy_region.csv"
data = pd.read_csv(csv_path)
type(data)

<실행결과>
pandas.core.frame.DataFrame
3) 데이터의 출력
- .head() : 데이터셋의 처음 5개 행 출력
- .tail() : 데이터셋의 마지막 5개 행 출력
- .column : 데이터셋에 존재하는 컬럼명을 확인
- .info() : 컬럼별로 Null값과 자료형을 보여주는 메서드
- .describe()
- 컬럼별로 기본 통계 데이터를 보여주는 메서드
- 개수(Count), 평균(mean), 표준편차(std), 최솟값(min), 4분위수(25%, 50%, 75%), 최댓값(max)
- .isnull().sum()
- isnull() : 결측값(Missing value) 확인
- sum() : missing 데이터 개수의 총합 구하기
data

<실행결과>
데이터 프레임 구조로 전체 데이터 출력data.head() # 데이터셋의 처음 5개 출력
data.tail() # 데이터셋의 마지막 5개 출력data.columns # **컬럼명을 확인
<실행결과>**
Index(['SNo', 'Date', 'Country', 'RegionCode', 'RegionName', 'Latitude',
'Longitude', 'HospitalizedPatients', 'IntensiveCarePatients',
'TotalHospitalizedPatients', 'HomeConfinement', 'CurrentPositiveCases',
'NewPositiveCases', 'Recovered', 'Deaths', 'TotalPositiveCases',
'TestsPerformed'],
dtype='object')data.info() # Null값과 자료형 출력
<실행결과>
<class 'pandas.core.frame.DataFrame'>
RangeIndex: 798 entries, 0 to 797
Data columns (total 17 columns):
# Column Non-Null Count Dtype
--- ------ -------------- -----
0 SNo 798 non-null int64
1 Date 798 non-null object
2 Country 798 non-null object
3 RegionCode 798 non-null int64
4 RegionName 798 non-null object
5 Latitude 798 non-null float64
6 Longitude 798 non-null float64
7 HospitalizedPatients 798 non-null int64
8 IntensiveCarePatients 798 non-null int64
9 TotalHospitalizedPatients 798 non-null int64
10 HomeConfinement 798 non-null int64
11 CurrentPositiveCases 798 non-null int64
12 NewPositiveCases 798 non-null int64
13 Recovered 798 non-null int64
14 Deaths 798 non-null int64
15 TotalPositiveCases 798 non-null int64
16 TestsPerformed 798 non-null int64
dtypes: float64(2), int64(12), object(3)
memory usage: 106.1+ KB
data.describe() # 개수, 평균, 표준편차, 최솟값, 4분위수, 최댓값 출력<실행결과>
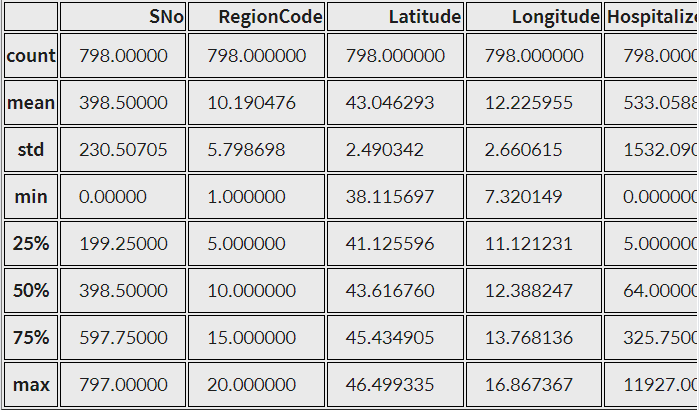
data.isnull().sum()     # 결측치를 더한 값 출력

<실행결과>
SNo                          0
Date                         0
Country                      0
RegionCode                   0
RegionName                   0
Latitude                     0
Longitude                    0
HospitalizedPatients         0
IntensiveCarePatients        0
TotalHospitalizedPatients    0
HomeConfinement              0
CurrentPositiveCases         0
NewPositiveCases             0
Recovered                    0
Deaths                       0
TotalPositiveCases           0
TestsPerformed               0
dtype: int64
4) EDA - 통계
- .value_counts() : 범주(Case 또는Category)의 개수 구하기
- .value_counts().sum() : 컬럼별 통계 수치의 합
- .sum() : 컬럼 값의 총합(컬럼 단독, 컬럼 전체도 가능)
- .corr() : 상관관계
- 상관관계는 2개의 매개변수가 필요
# 범주 컬럼 개수 구하기
data['RegionName'].value_counts()

# 범주형 컬럼 총합 구히기
data['RegionName'].value_counts().sum()

# 수치형 총합구하기
print("총 감염자", data['TotalPositiveCases'].sum())

# 각 컬럼별 총합 구히기
data.sum()

# 2개 컬럼의 상관관계
print(data['TestsPerformed'].corr(data['TotalPositiveCases']))

# 전체 컬럼 상관관계
data.corr()

# 컬럼 지우기
data.drop(['Latitude','Longitude','Country','Date','HospitalizedPatients',  'IntensiveCarePatients', 'TotalHospitalizedPatients','HomeConfinement','RegionCode','SNo'], axis=1, inplace=True)
5) pandas 통계 관련 메서드
count(): NA를 제외한 수를 반환describe(): 요약 통계를 계산min(), max(): 최소, 최댓값을 계산sum(): 합을 계산mean(): 평균을 계산median(): 중앙값을 계산var(): 분산을 계산std(): 표준편차를 계산argmin(),argmax(): 최소, 최댓값을 가지고 있는 값을 반환idxmin(),idxmax(): 최소, 최댓값을 가지고 있는 인덱스를 반환cumsum(): 누적 합을 계산pct_change(): 퍼센트 변화율을 계산

