
Motivation
I was curious about how Spring Boot manages threads, and through studying and applying this, I discovered many interesting facts. I wanted to document this experience in writing.
Contents
First of all, What is a thread?
Thread
A unit of execution within a program
A thread is a unit of execution within a process. Each thread has its own stack area, but shares the code, data, and heap areas with other threads in the same process. This means that variables with state (instance variables managed by the heap) can be shared between threads, which may lead to concurrency issues. When dealing with threads directly, it's crucial to handle these shared resource problems. However, Spring abstracts these complexities and handles threading for us, which is why we might not have given much thought to threads until now. Before exploring how Spring manages multiple requests through threading, let's briefly understand the concept of a thread pool, which will provide useful context.
Thread Pool
A thread pool is a collection of pre-instantiated threads that are maintained and ready to execute tasks as needed.
Reasons for Using a Thread Pool
Simply put, the purpose is to reduce the cost of creating threads. Creating or destroying threads incurs significant overhead. In versions of Tomcat prior to 3.2, a new thread was created for each incoming user request and destroyed once the request was processed. This approach caused issues such as server downtime under high load, as it was difficult to manage multiple concurrent requests. To address these problems, Tomcat introduced thread pools.
Behavior of Tomcat Thread Pool
- When the first request comes in, it creates idle threads up to the core size (thread.min-spare).
- The number of requests that can be handled concurrently is determined by the max-connection setting.
- Idle threads handle incoming requests.
- If there are no idle threads available, new threads are created up to the maximum allowed (threads max setting) to handle the requests.
- If the number of requests exceeds max-connection, the excess requests are queued.
- The size of the queue is managed by the accept-count setting.
- If the queue becomes full, a connection-refused error is returned.
You might wonder, “What does Tomcat have to do with Spring Boot?”
Spring boot and Tomcat
Spring Boot supports Tomcat as an embedded servlet container. Thanks to Tomcat, Spring Boot can easily handle multiple requests simultaneously. 😳
How does Spring boot handle multiple requests?
Spring itself doesn't handle multiple requests; rather, it is the embedded Tomcat in Spring Boot that manages multiple requests. Therefore, we can easily adjust thread settings in configuration files like application.yml or application.properties.
ex) Default Thread Setup in Spring boot Tomcat
server:
  tomcat:
    accept-count: 100
    max-connections: 8192

    threads:
      	max: 200
		min-spare: 10
threads.max
- Maximum number of threads that can be used
- The default setting is 200.
threads.min-spare
- The number of idle threads that are always active.
- The default setting is 10.
max-connections
- The maximum number of connections the server can accept and handle at a given time.
- When this number is reached, the server will accept additional connections but will not process them.
- The default setting is 8192.
accept-count
- The size of the work queue.
- When more requests arrive than the number specified in maxConnections, the excess requests are queued in the work queue. The size of this work queue is the accept count.
- The default setting is 100.
The default settings can be checked in the ServerProperties.java file.
So, let's adjust these settings to better fit our project. Having too many threads can cause contention for CPU resources, which may slow down processing, while having too few threads may lead to suboptimal use of CPU resources and similarly slow down processing. To determine the optimal settings, we conducted a load test. But what exactly is a load test?"
Load Test
A load test is a type of performance testing that measures metrics such as throughput and latency to determine how many requests the server can handle before it reaches its limits.
We can improve service's performance through performance metrics obtained from load testing
Throughput
Throughput per hour
It's called TPS(Transaction Per Second) or RPS(Request Per Second).
Latency
Time taken for the server to handle a request and send a response to the client
Simply put, Latency is a metric that indicates how quickly a service can process a task.
So, why did we conduct the load test?
We performed the load test for the following reasons:
-
To assess the performance metrics (Throughput, Latency) with the default Tomcat settings for the maximum requests we need to handle.
-
To adjust the thread settings to better suit our project while minimizing resource waste, without compromising the performance observed in step 1.
-
To gather valuable data that can be used not only for thread configuration but also for meaningful insights during future optimizations, such as query improvements and refactoring.
Load Testing Process
Now, let's dive into our load testing process.
Load Testing Tool
Locust
Before conducting the load test, we carefully considered which tool to use. Our options included jMeter, Locust, and nGrinder. jMeter had the advantage of supporting multiple protocols and plugins, while nGrinder had a strong user base in Korea, providing plenty of Korean-language references. However, we ultimately chose Locust for the following reasons: it offers the specific features we needed for our tests (such as RPS and Median Response Time) while being lightweight. Additionally, Locust allows us to write scripts using Python, making it easier to customize our tests. The availability of extensive references and detailed official documentation also played a key role in our decision.
Test Environment
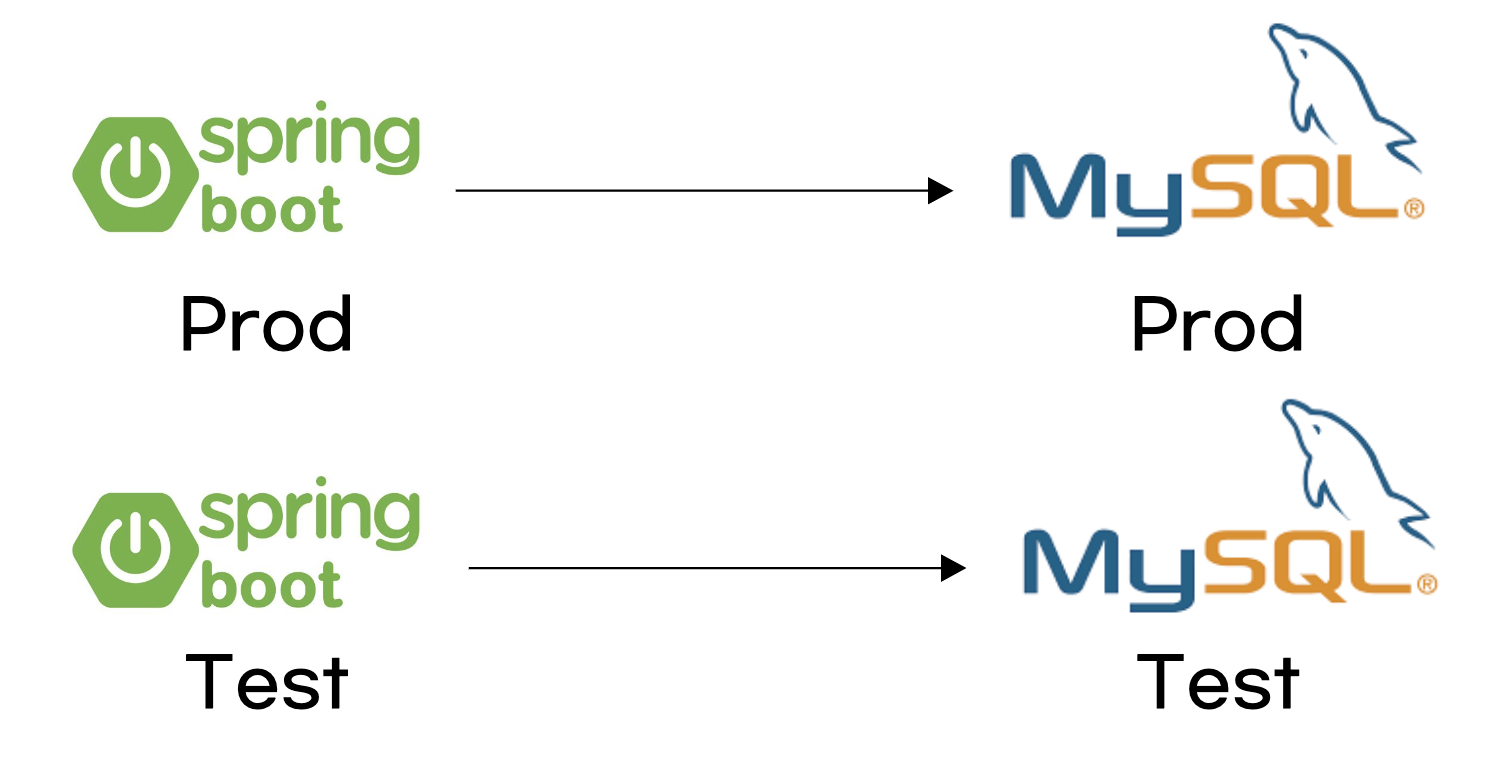
1. Executed on a test server with the same specifications as the production server
2. Assumed a maximum of 150 concurrent users
To ensure that the test was conducted in an environment as similar to the production server as possible, we created a test server with the same specifications as the production server.
We also prepared the test environment by generating dummy data and storing it in a test database, simulating a scenario where all interviews for a batch of WooTech students had been completed. The maximum number of concurrent users was set to 150, based on the current number of WooTech students and coaches, with some margin to accommodate the service's characteristics.
Modified threads.max
default setting (threads.max=200, max connections= 8192, acceptCount=100)
The purpose of the test was to appropriately adjust three key settings:
- threads.max
- tomcat.max-connections
- tomcat.accept-count
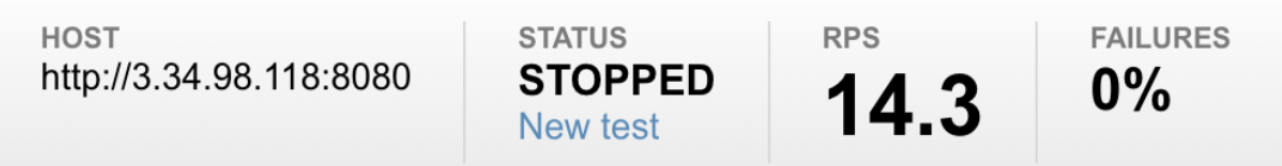
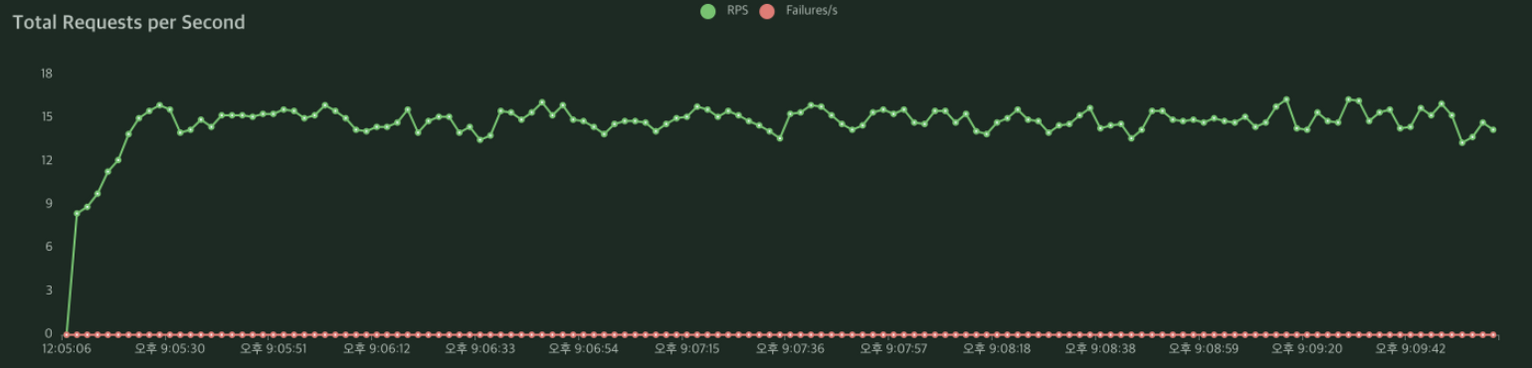
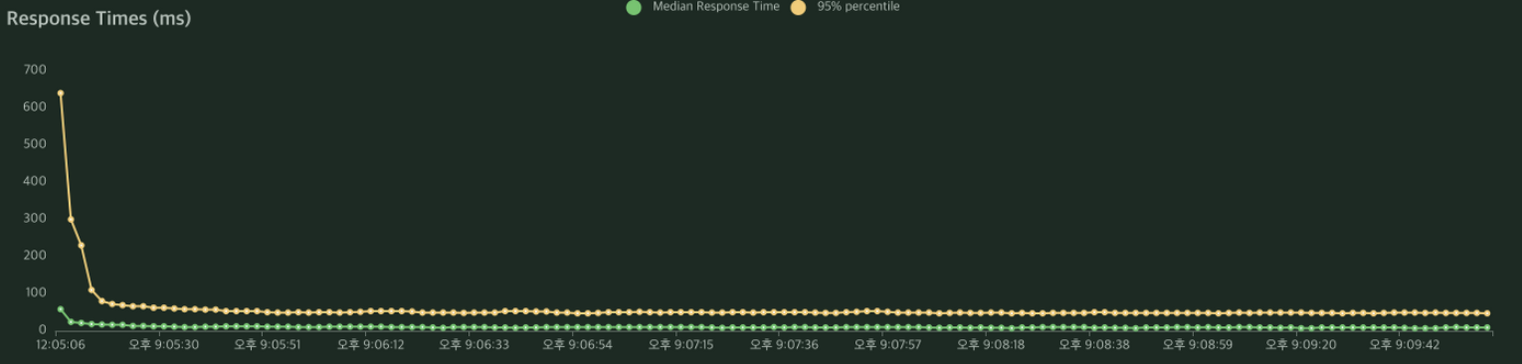
When tested with the default settings, the server could handle approximately 14 requests per second, with each request taking about 10 milliseconds to respond.
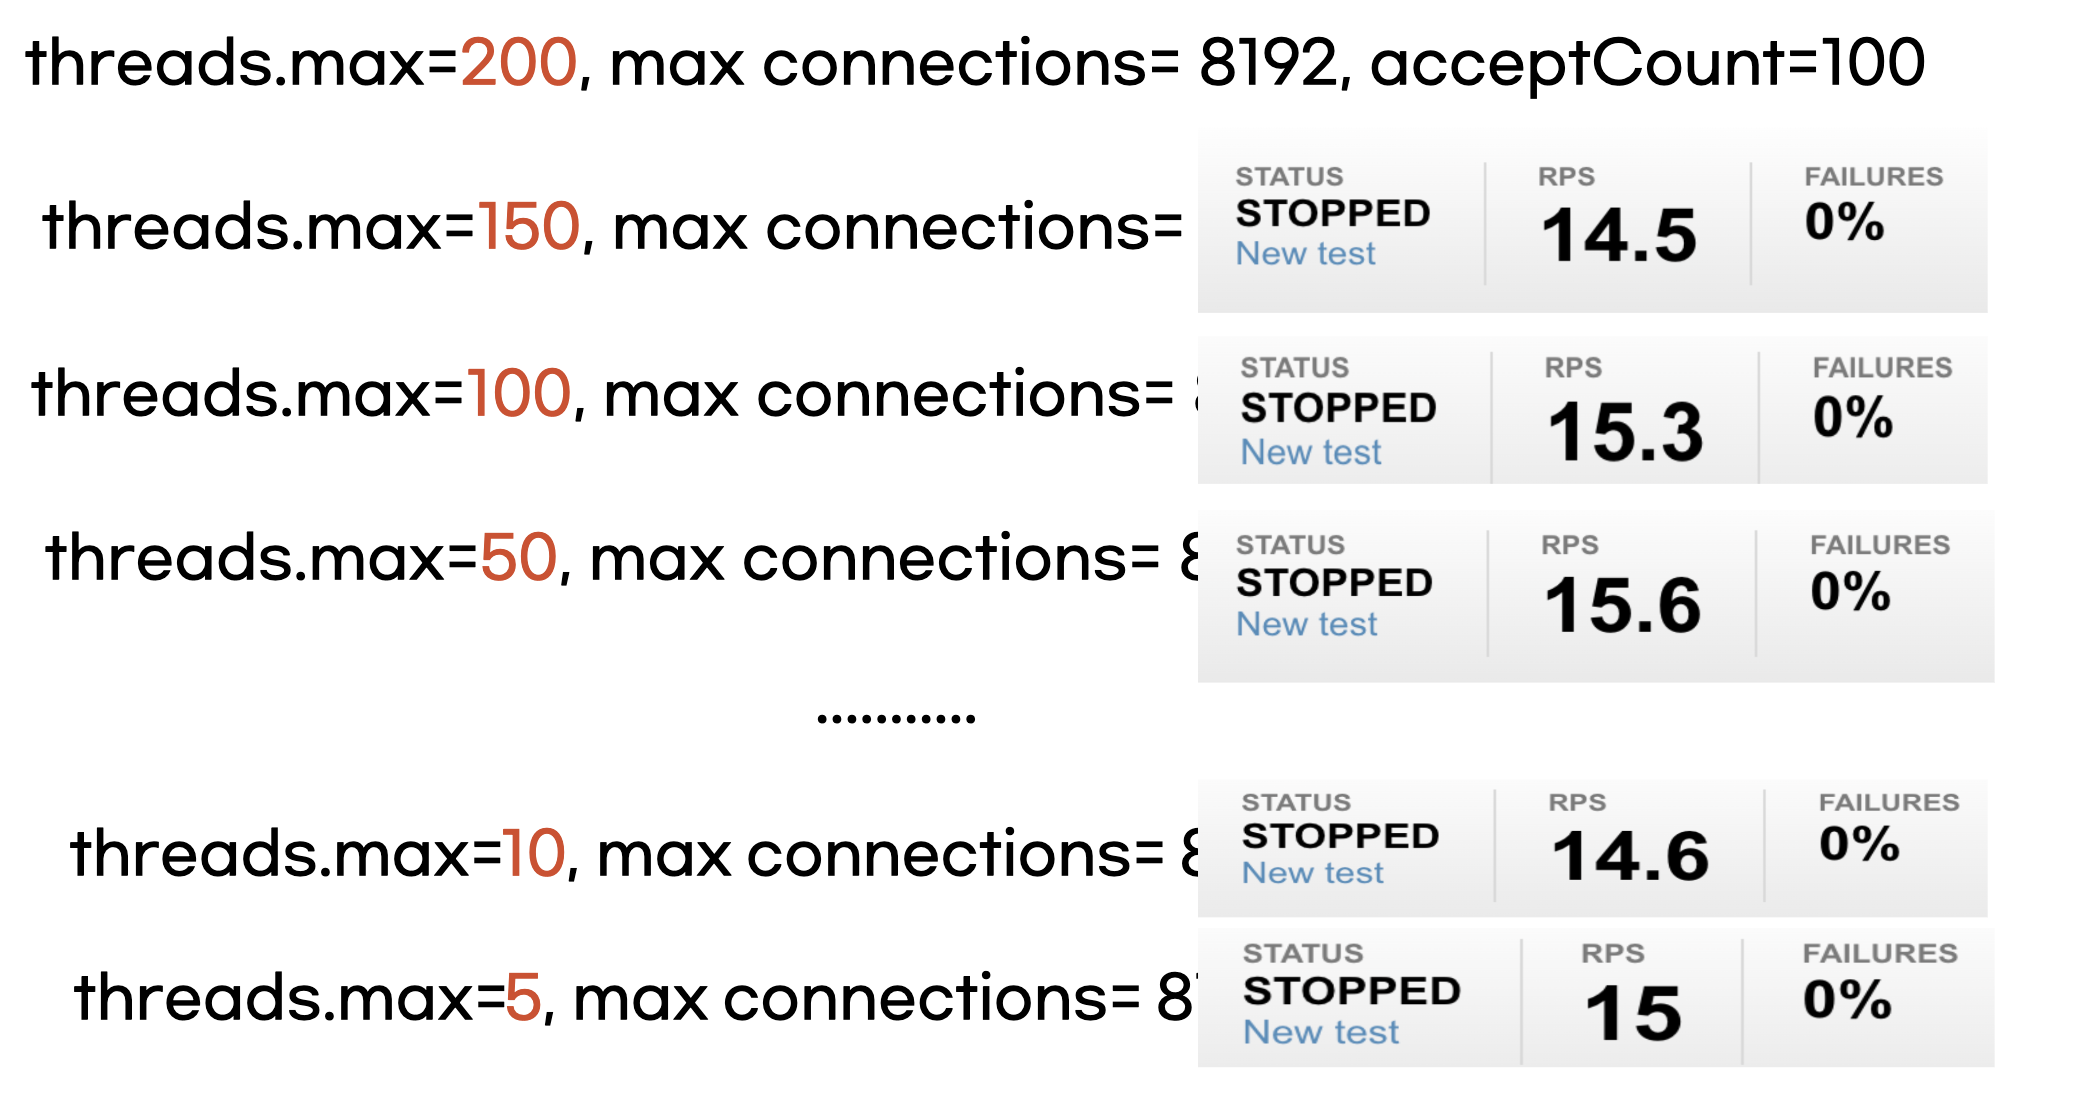
Initially, considering that there were 150 concurrent users, we set the max connections to 200 and the accept count to 100, leaving ample room. We then tested by gradually reducing the max thread value, trying 150, 100, 50, 30, 10, and 5. We found that there was no significant performance difference (based on RPS and median response time). We hypothesized that this was because the 150 users' requests could be sufficiently handled by the default idle thread count of 10 (threads.min-spare). The reason 10 threads could handle 150 requests might be explained by the thread handling method of NIO connections.
Modified max connections & accept count
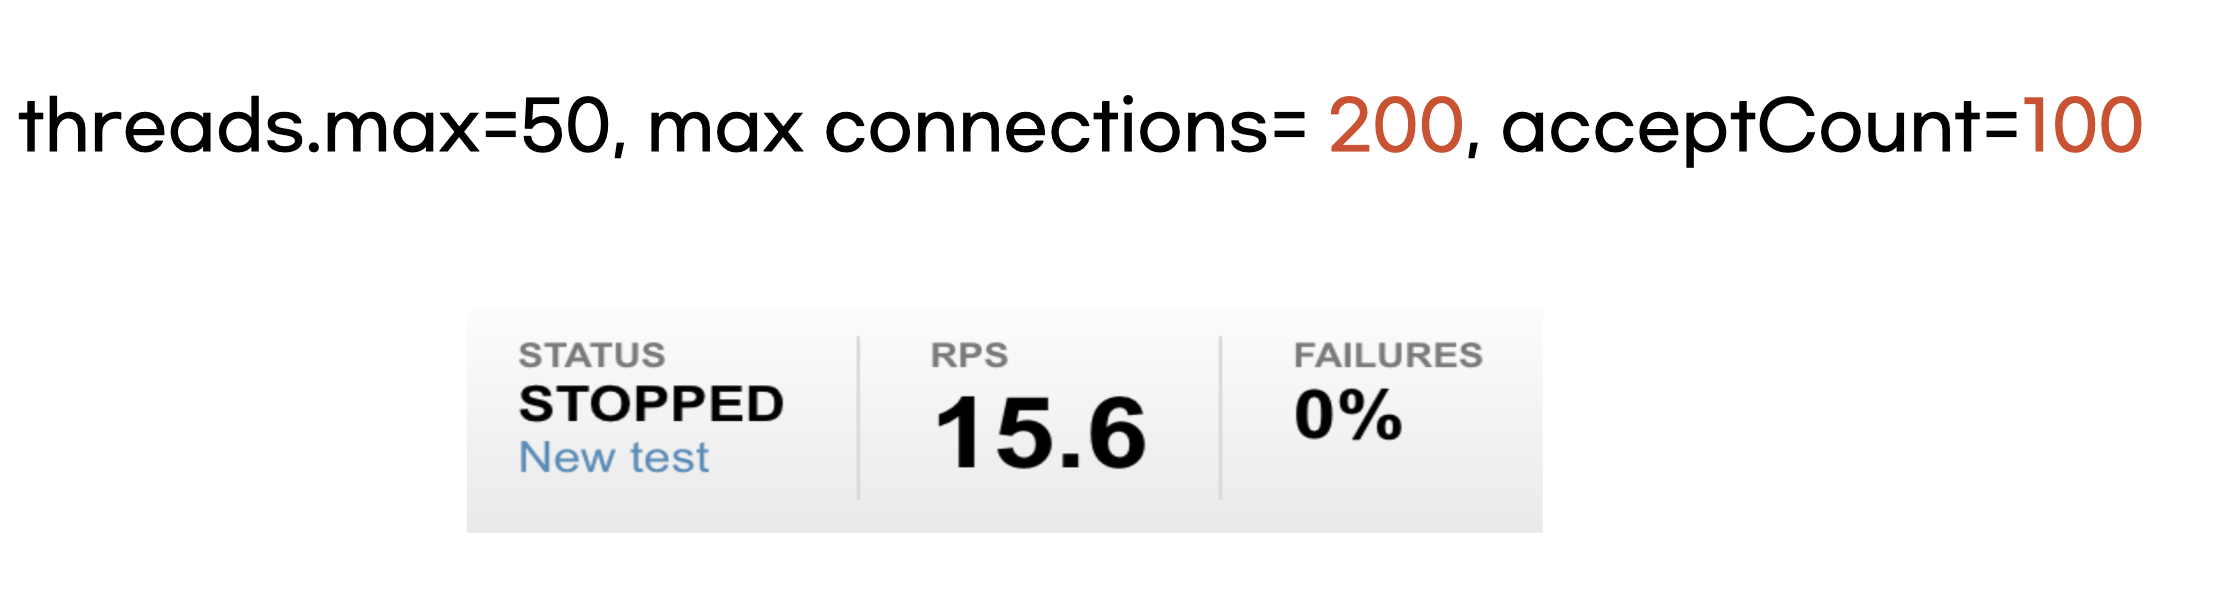
Therefore, we decided to set the threads.max value generously at 50 and then proceeded to test by varying the max connections and accept count settings.
threads.max=50, max connections= 150, acceptCount=50
First, we reduced max connections from 200 to 150 and acceptCount from 100 to 50 and then conducted the tests.

We found that there was no significant performance difference compared to when max connections was set to 200 and acceptCount was set to 100.
threads.max=50, max connections= 100, acceptCount=50
Next, we tested by reducing max connections from 150 to 100.

Although latency remained unchanged, we observed that the RPS performance dropped to 2/3. This degradation in performance appears to be due to the requests queuing up as a result of reducing max connections to 100.
Conclusion
threads.max=50, max connections= 150, acceptCount=50
We decided to set threads.max to a generous 50, max connections to 150, and accept count to 50.