7 Sampling distributions
7.1 Sampling distributions from a normal distribution
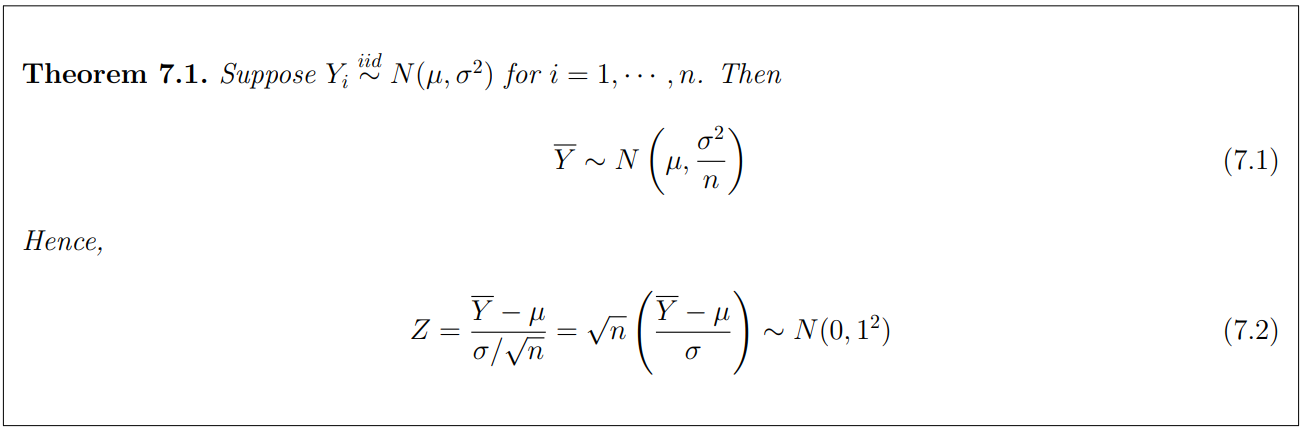
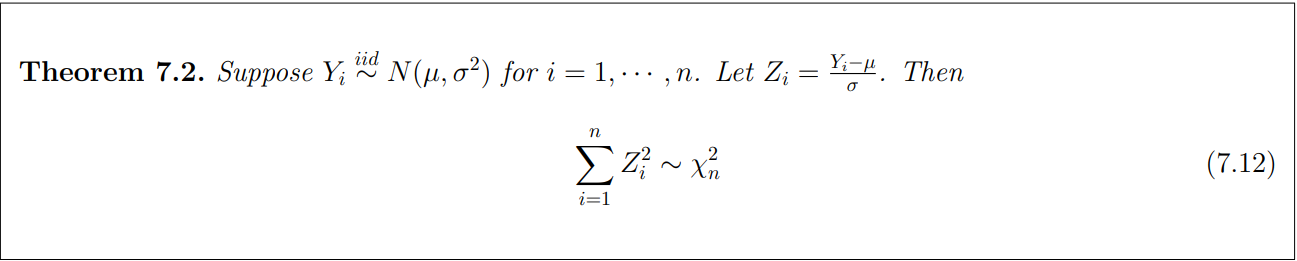
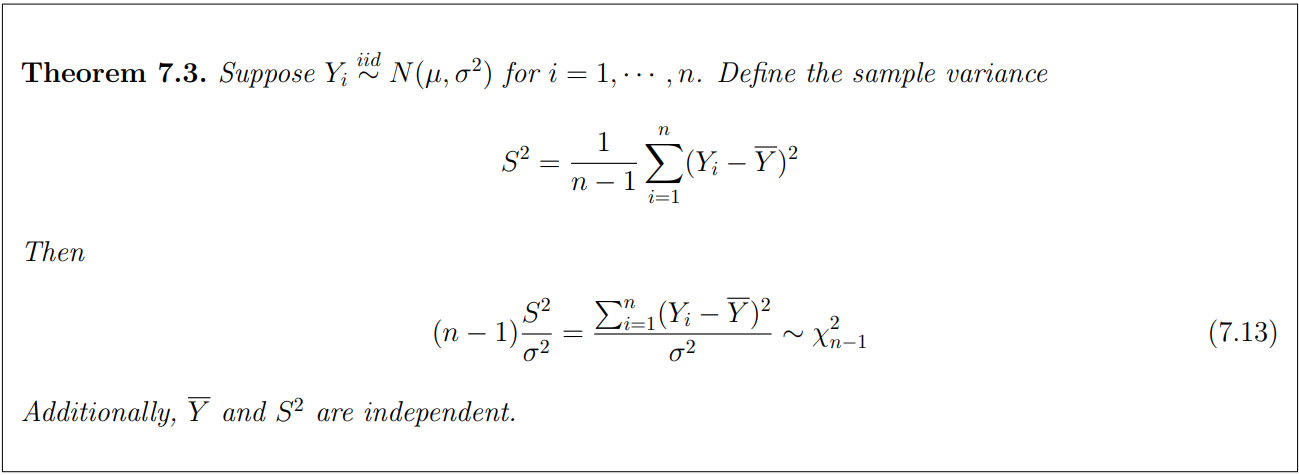
By MGF method we can prove this.
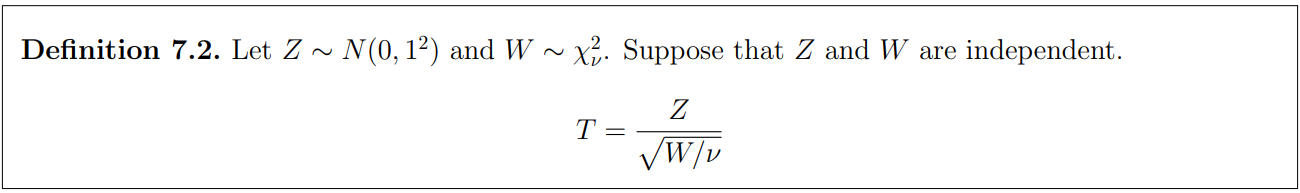
7.1.1 Student's t-distribution
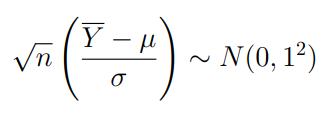
When a random sample of size n is selected from a normally distributed popultation, the standardized sample mean has a standard normal distribution.
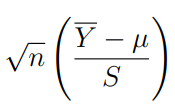
Commonly, the population standard deviation σ is unknown and we may replace it with the sample standard deviation S

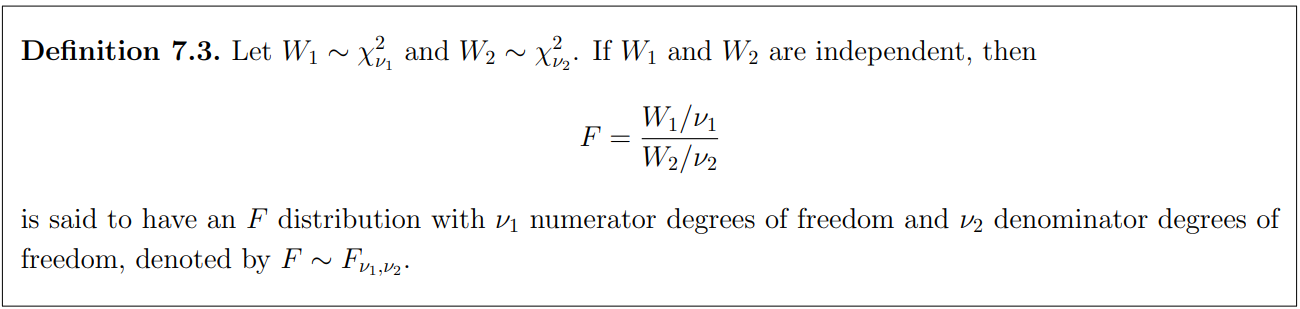
7.1.2 Snedecor's F-distribution
When two random samples are independently selected from two normally distributed populations, we may want to compare two population variances. The following quantity
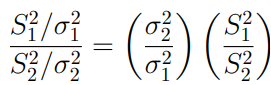
may be used for the inference about two normal variances.
7.2 Central Limit Theorem(CLT)
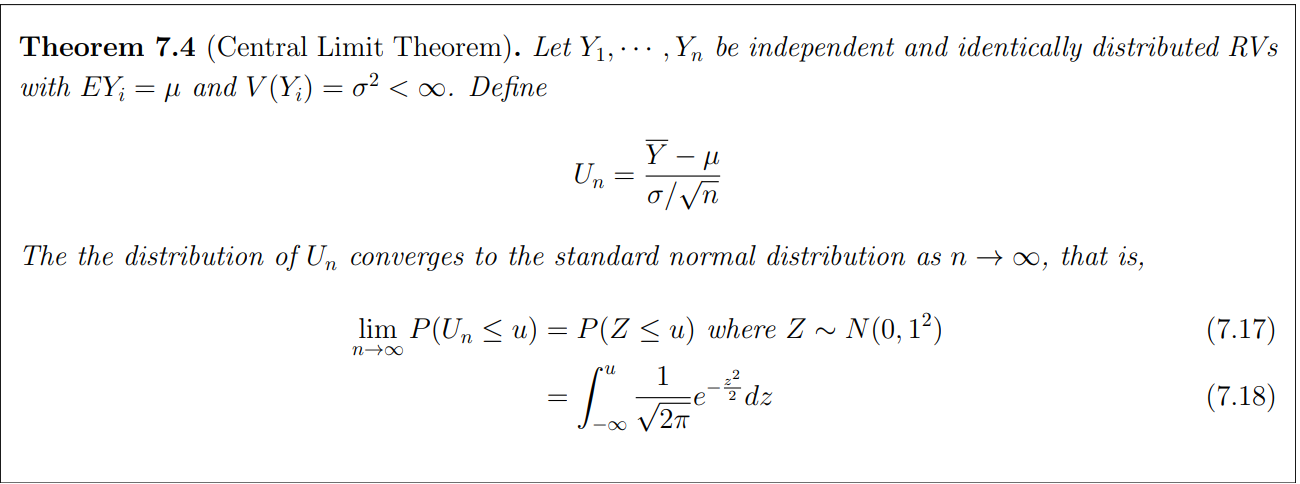
Using MGF&Talyor expansion we can prove this.
The distribution of the mean of n independent probability variables with the same probability distribution (don't know the distribution) is closer to the normal distribution if n is moderately large
8 Estimation
- Parameter : numerical characteristic of a population, a descriptive measure of characteristics of the population
- Estimation : the process of finding an estimate, which is a value of the parameter of interest (target parameter) that is usable for some purpose even if input data may be incomplete uncertain, or unstable.
- A point estimation is the estimation that produces a single value for the target parameter while an interval estimation is the estimation gernerating a lower and/or upper bound for the target parameter with some statistical accuracy.
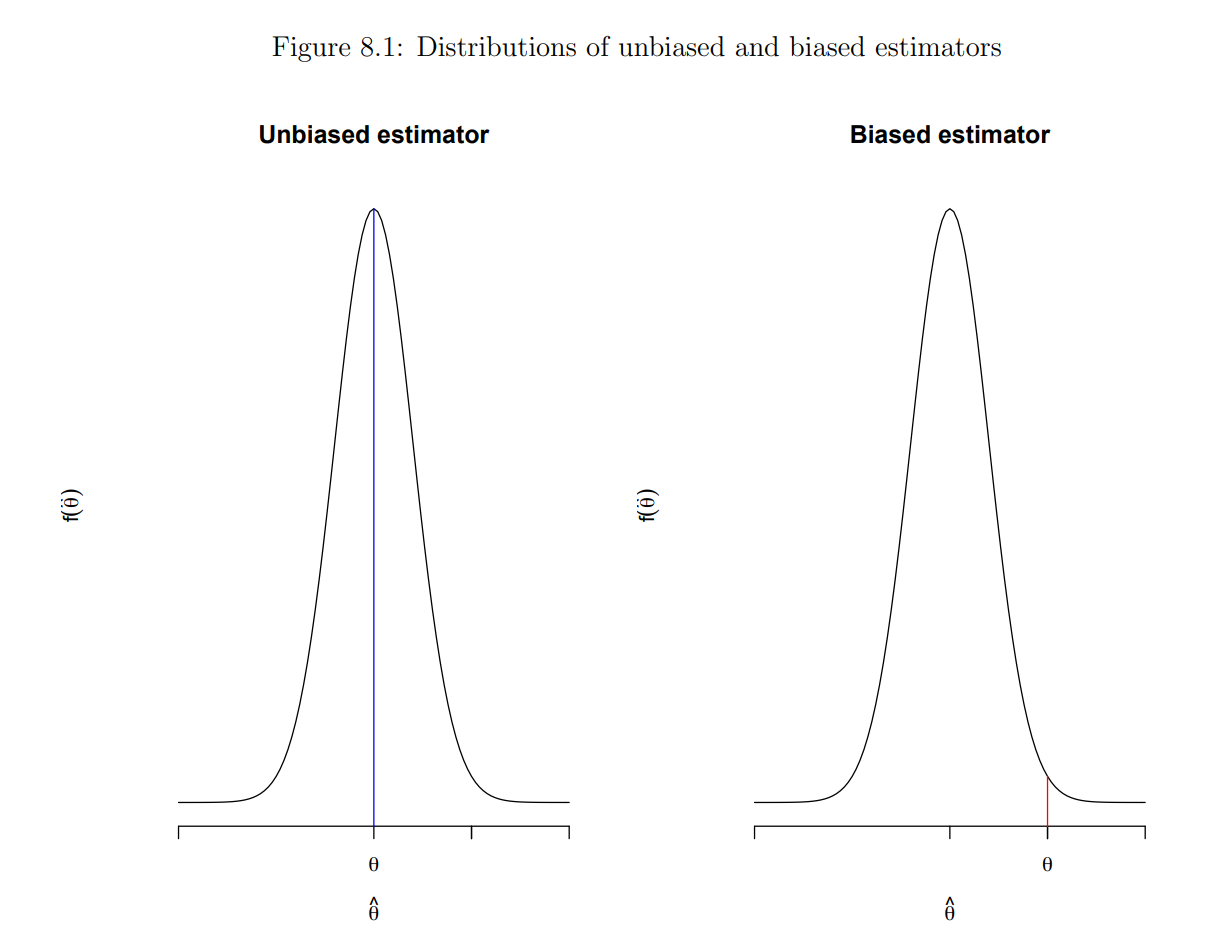
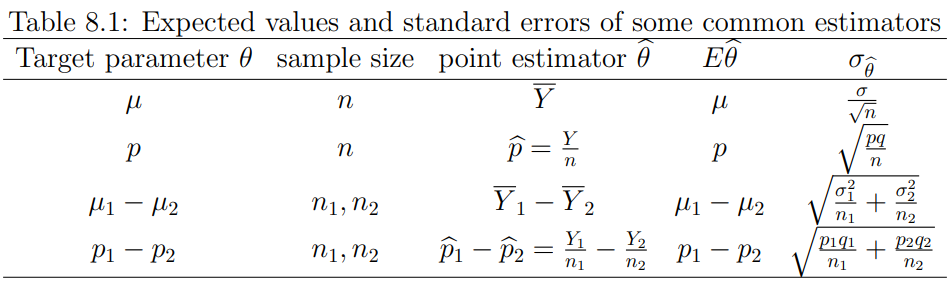
8.2 Bias, variance and Mean square error(MSE)
Since there are many possible estimators for a target parameter, which estimator would be best? What does it mean by "best"?
Q. How to measure how good or bad an estimator is?
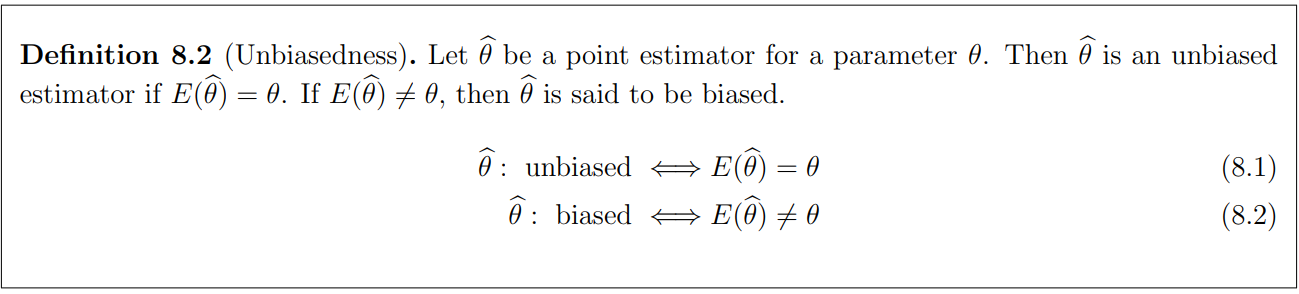
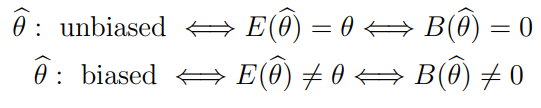
They are all unbiased!
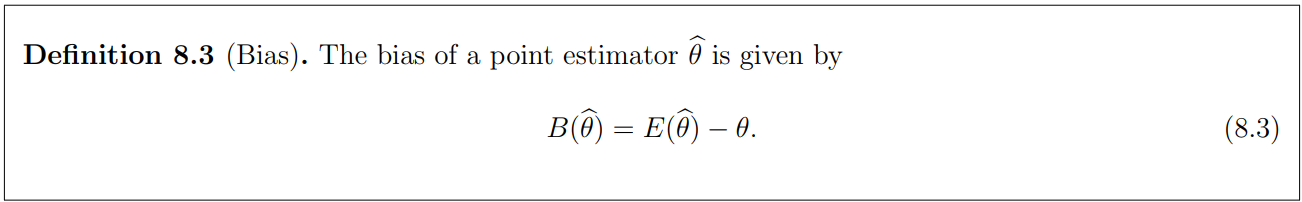
Bias
MSE
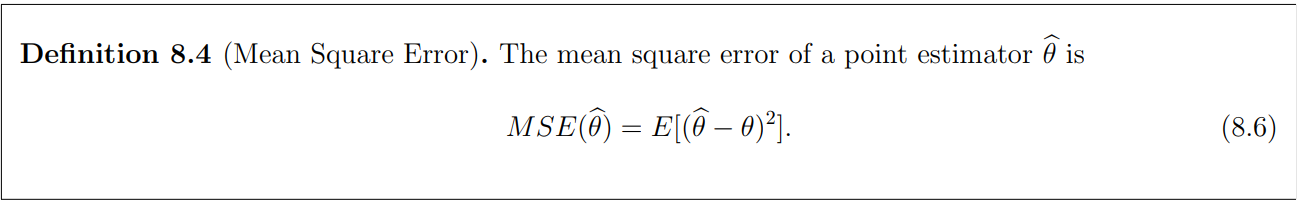
= +
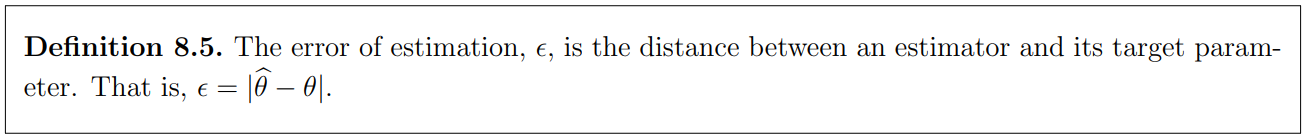
8.3 Measure of goodness of a point estimator
How to evalutate the error of estimation?
Apply Chebyshev's inequality
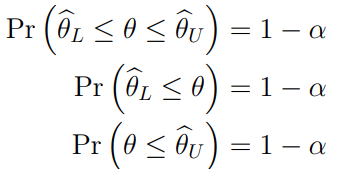
8.4 Confidence Intervals(CIs)
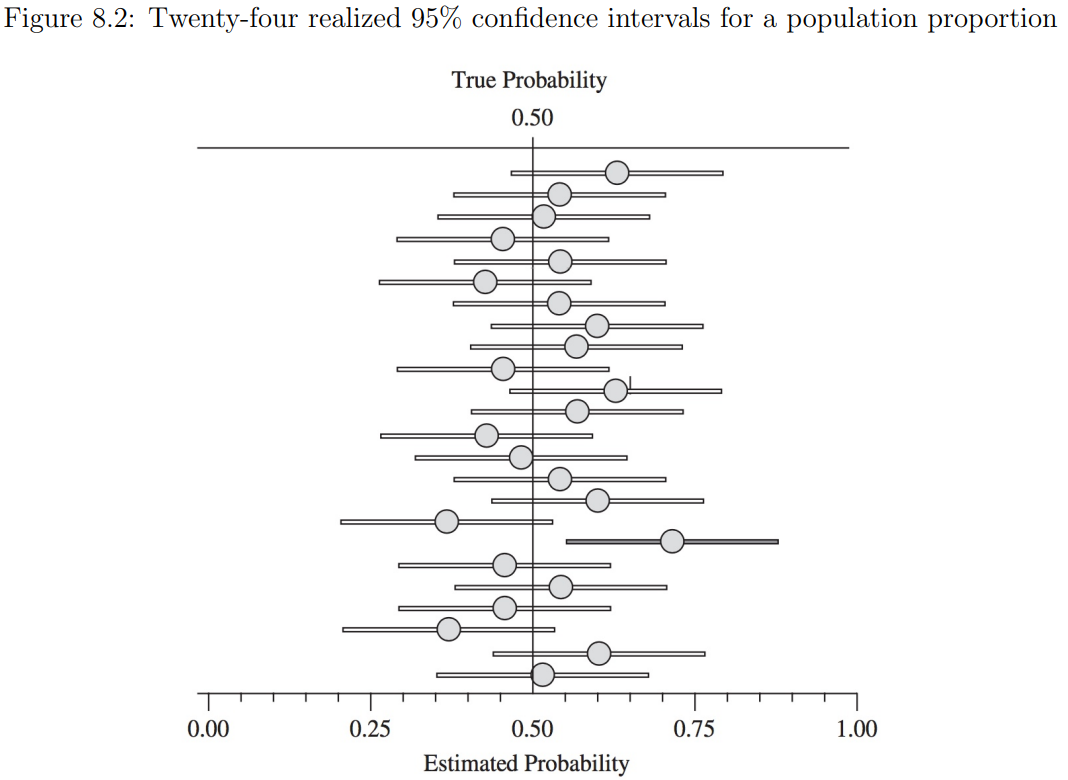
It means that out of 100 CIs, 95 CIs contain true values, rather than 95% probability that each CI contains a true value
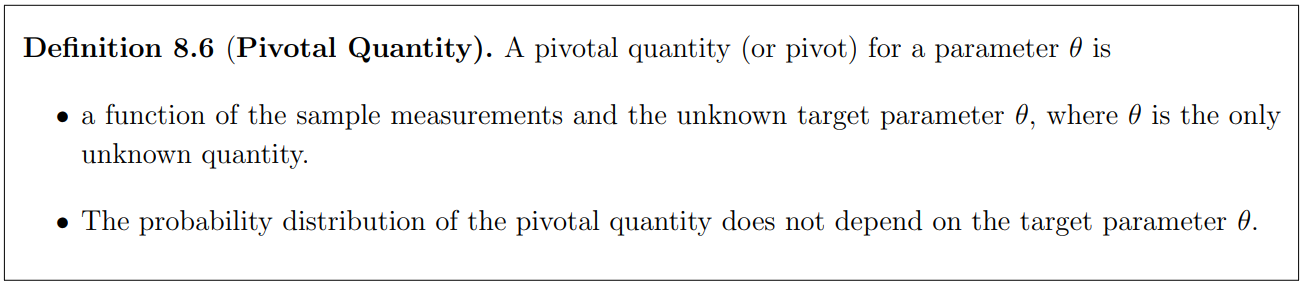
One of frequently used methods to construct a confidence interval is based on a pivotal quantity.
8.5 Large Sample Confidence Intervals
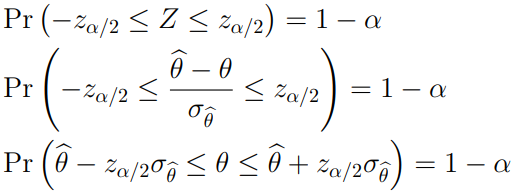
In some cases when the sample size n is large, the sampling distribution of the point estimator has a normal distribution from the central limit theorem(CLT). We may construct an approximate confidence interval by finding an approximate pivotal quantity.
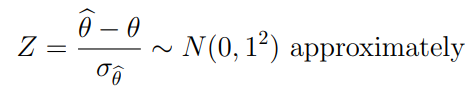
An approximate 100(1-)% confidence interval may be constructed by
8.7 Small sample confidence intervals for mean
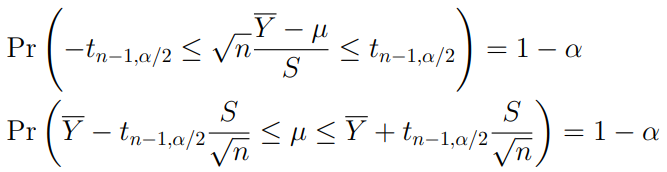
When the population variance is unknown and the sample size n is not large enough to apply the CLT,
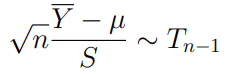
is a pivotal quantity for as long as we assume that the population has a normal distribution.
9 Properties of Point Estimators and Methods of Estimation
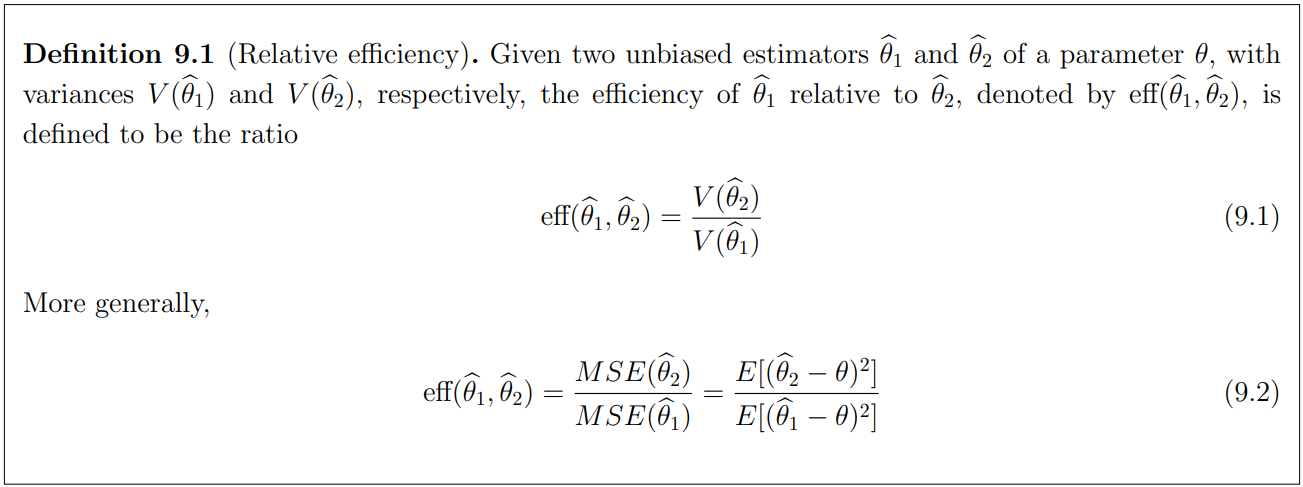
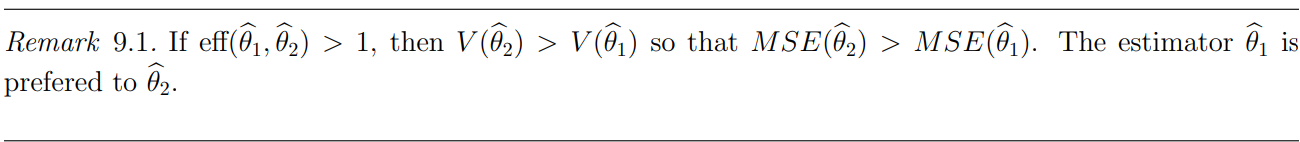
- Relative efficiency to compare two unbiased estimators
- Consistent estimators
- Sufficient statistics that contain all information of the parameters
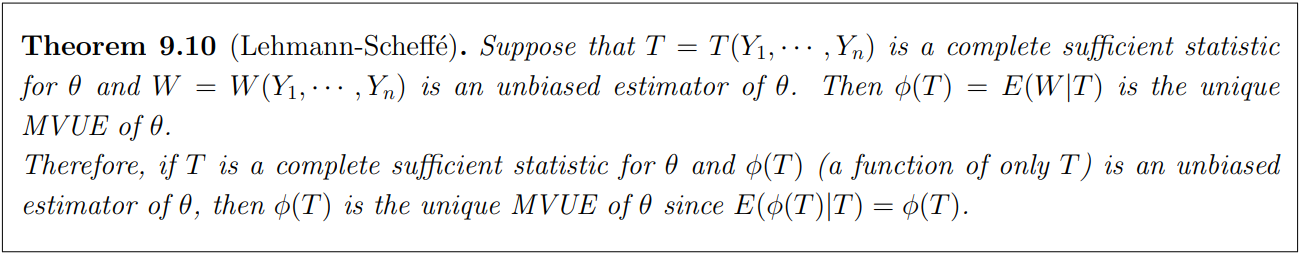
- Rao-Blackwell theorem and MVUE
- Method of moments
- Maximum likelihood estimators(MLEs)
9.2 Relative Efficiency: How to compare two estimators?
Relative efficiency
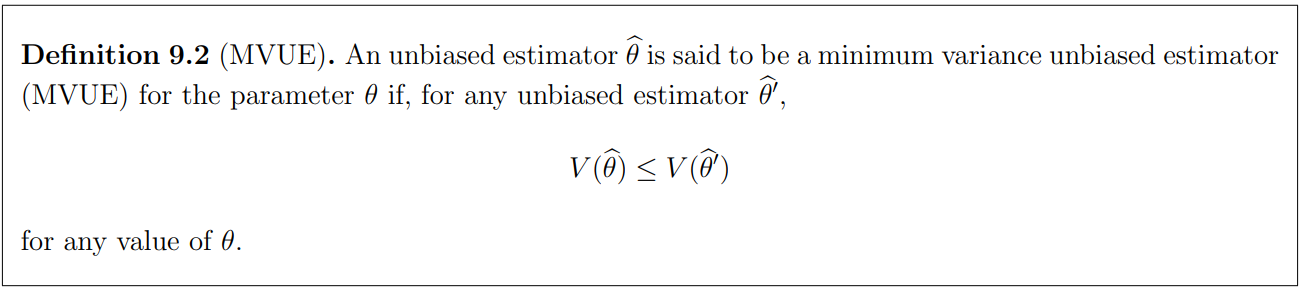
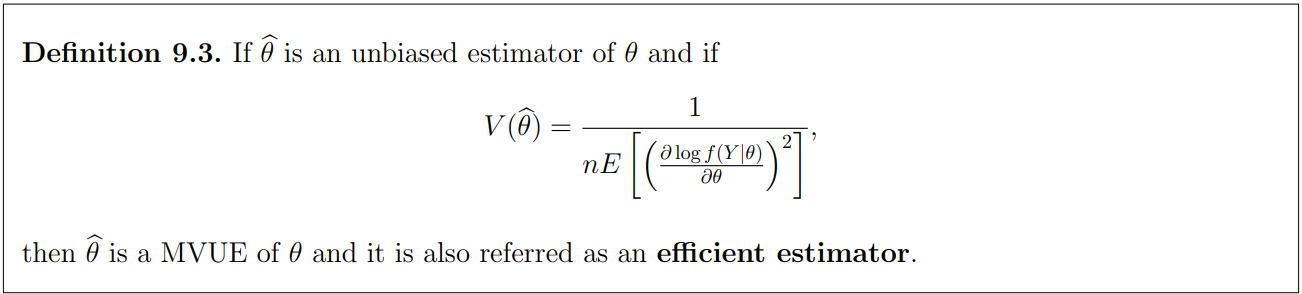
MVUE
However it is not always easy to find MVUE for a paramter. However, we can obtain a lower bound for the variance of any unbiased estimator.
Cramer-Rao Lower Bound
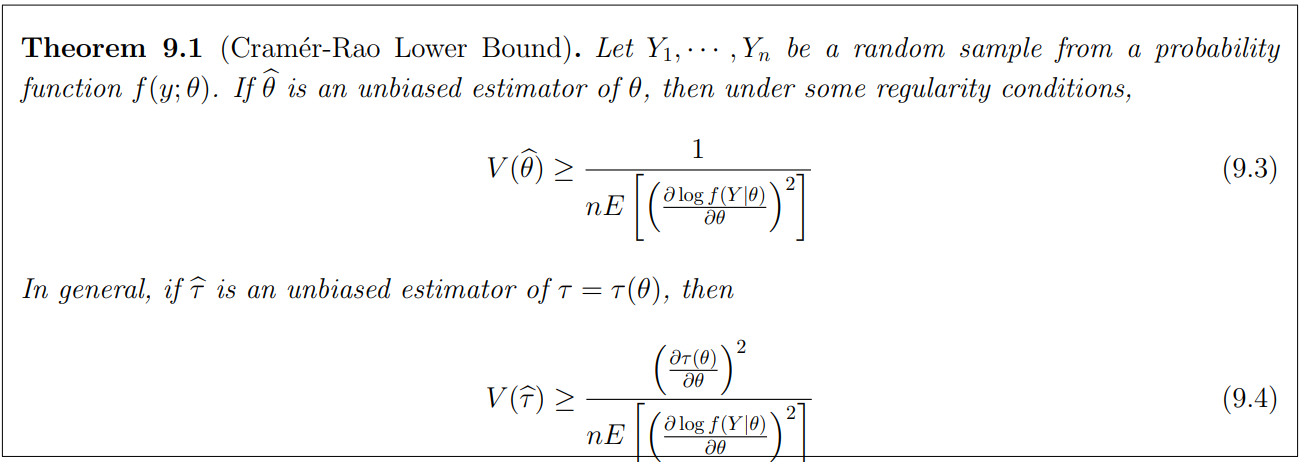
The right hand sides of the above inequalities are said to be the Cramer-Rao lower bound for the variance of any unbiased estimator.
9.3 Consistency
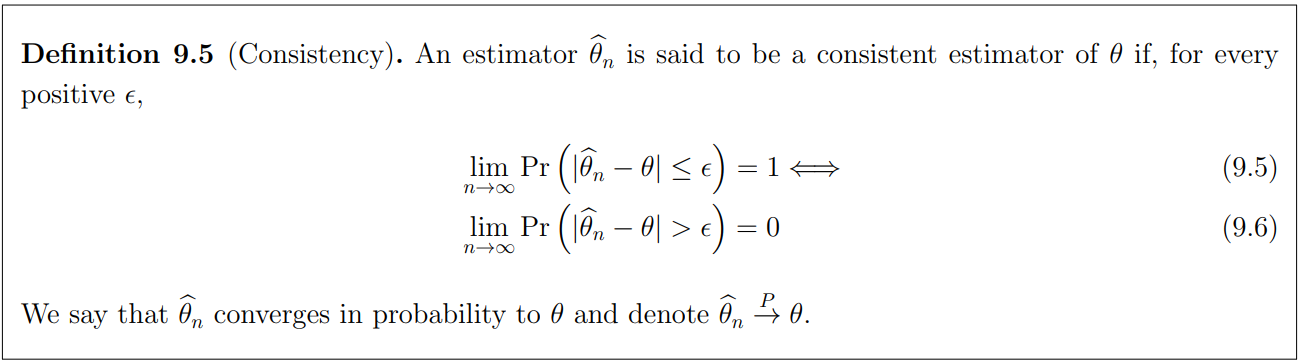
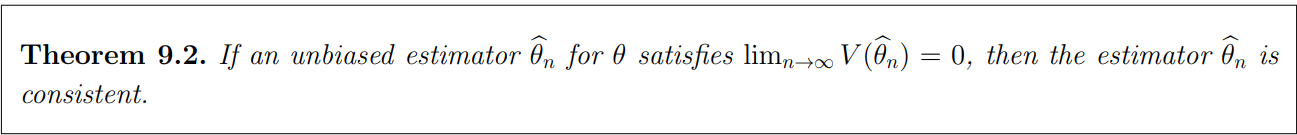
Apply Chebyshev's inequality
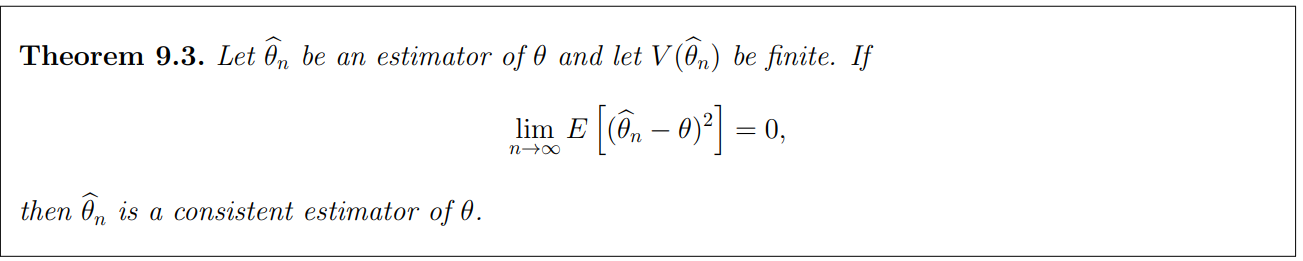
By Markov's inequality
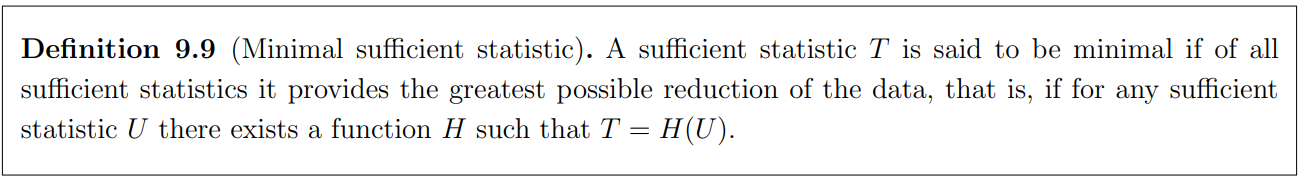
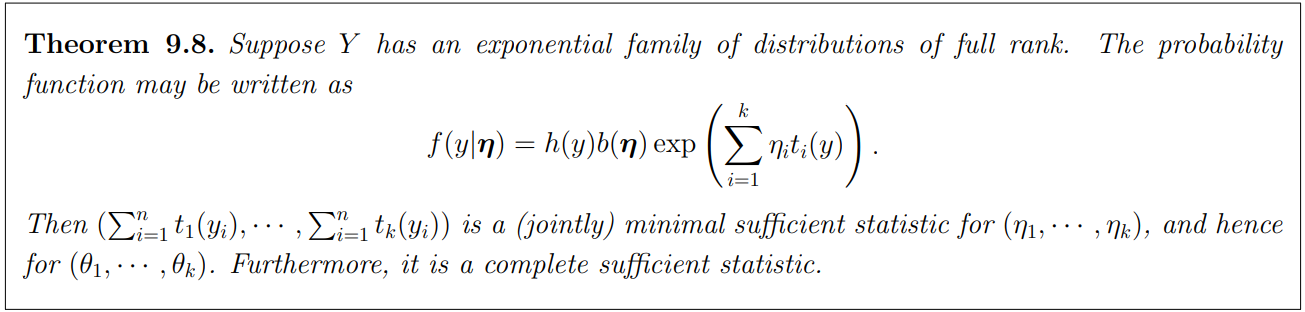
9.4 Sufficiency
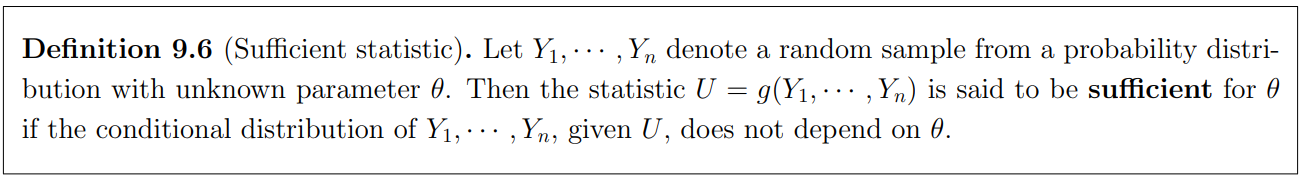
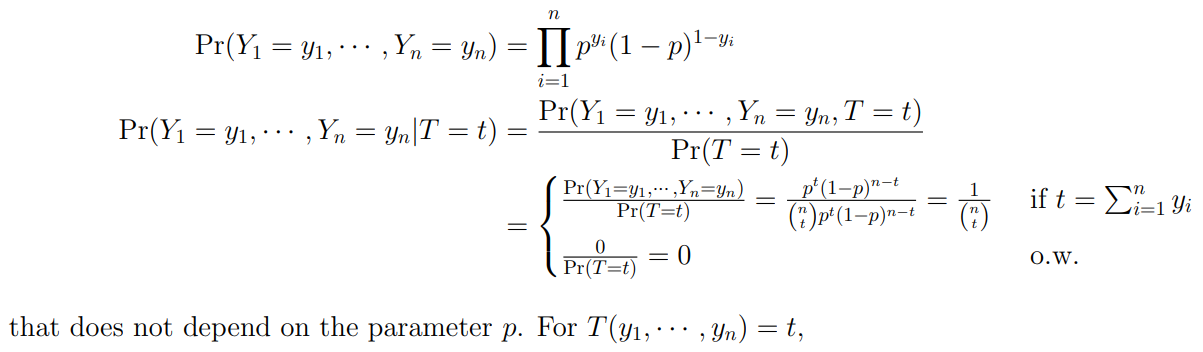
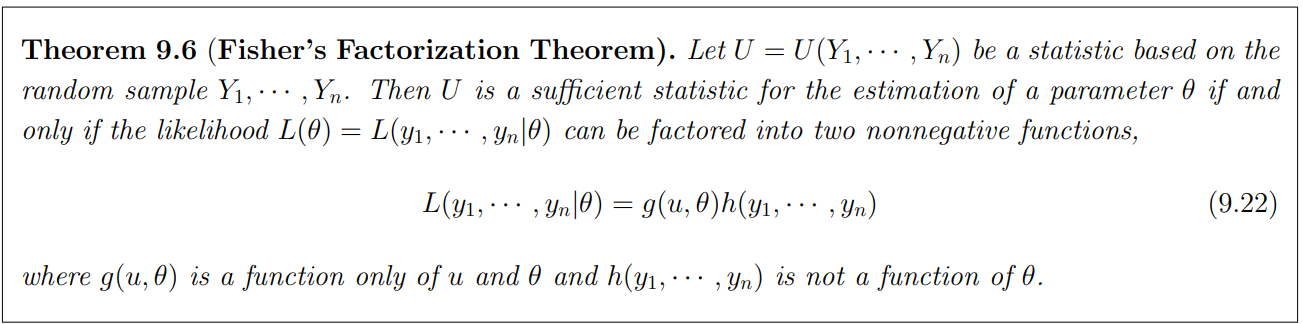
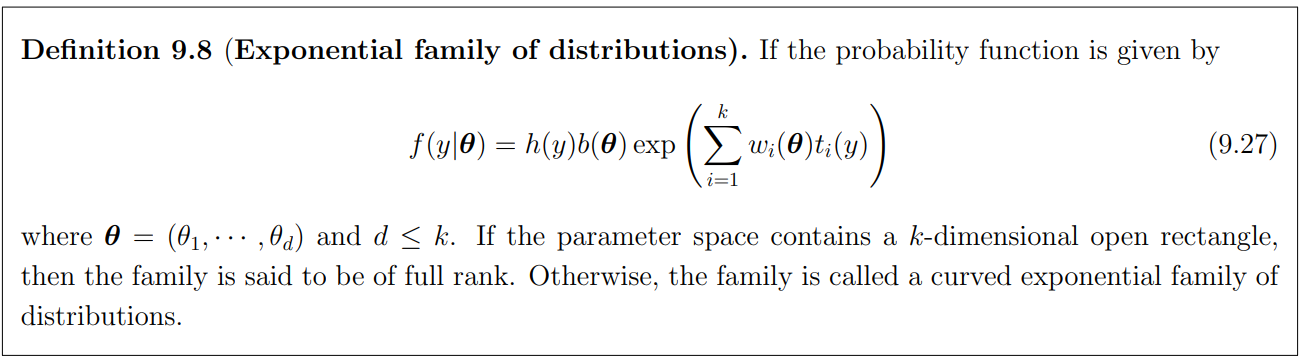
We will use this to get the CSS.
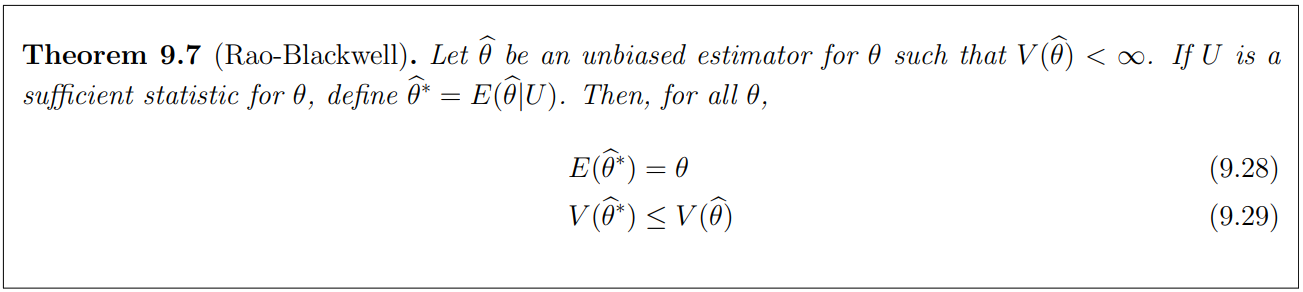
9.5 Rao-Blackwell Theorem and Minimum Variance Unbiased Estimators(MVUEs)
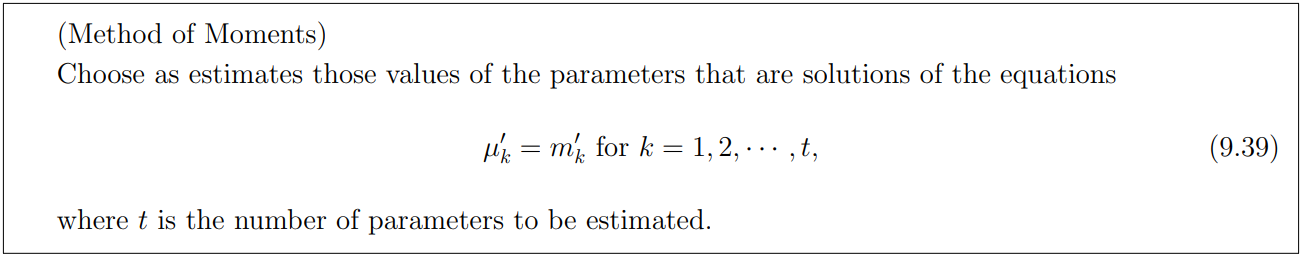
9.6 The Method of Moments
Recall that the kth moment of a random variable is
=
=
The corresponding kth sample moment is the average
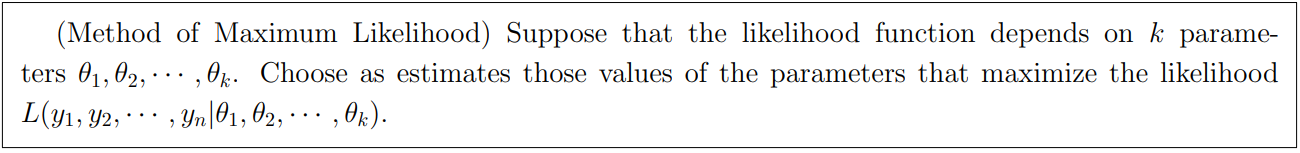
9.7 The Method of Maximum Likelihood
- In practical problems, it is not easy to find a MVUE and the estimators from the method of moments are not usually best estimators.
- In this section, we present the method of maximum likelihood that often leads to MVUEs. Even when the maximum likelihood estimators(MLEs) do not lead to the best esimators or MVUEs, the often asymptotically close to the MVUEs.
- The idea of the method of maximym likelihood function is that we choose the value at which the probability function is maximized given data.
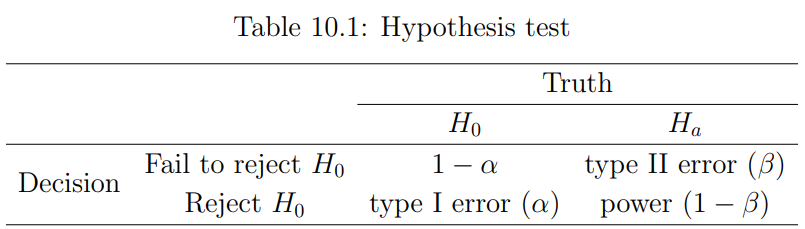
10 Hypothesis Testing
10.2 Elements of a Statistical Test
- The null hypothesis is the hypothesis to be tested, denoted by . It is the hypothesis to be accepted unless we observe enough evidence against the hypothesis.
- The alternative hypothesis is the competing hypothesis, denoted by or . It is usually the hypothesis that we seek to support on the basis of the information contained in the sample.
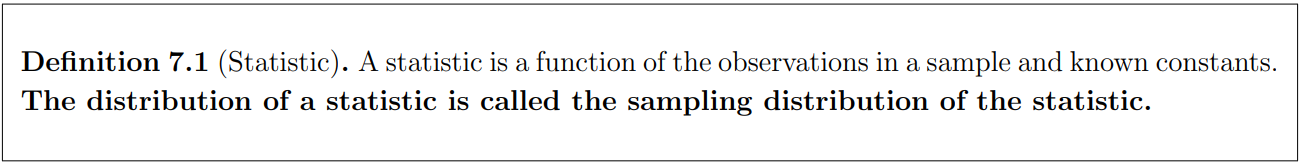
- The test statistic (like an estimator) is a function of the sample measurements on which the statistical decision will be based.
- The rejection region, denoted by RR, specifies the values of the test statistic for which the null hypothesis is to be rejected in favor of the alternative hypothesis.
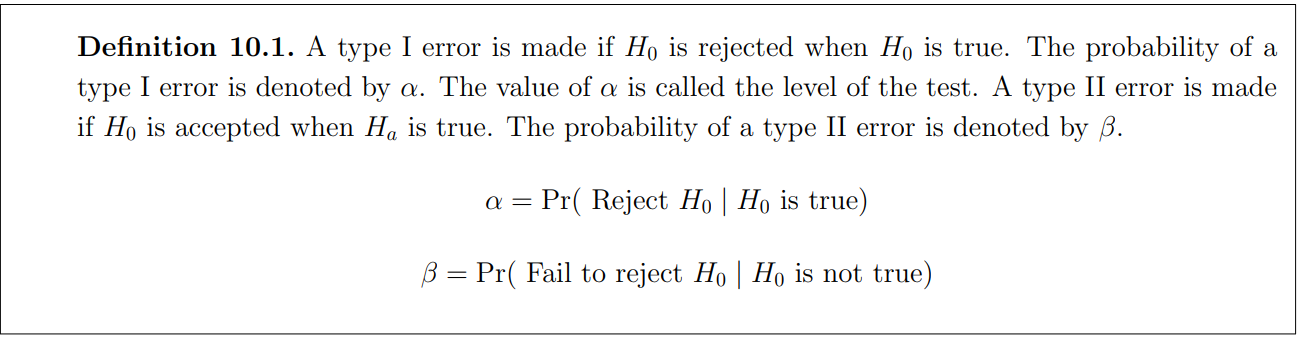
- Type I and type II errors
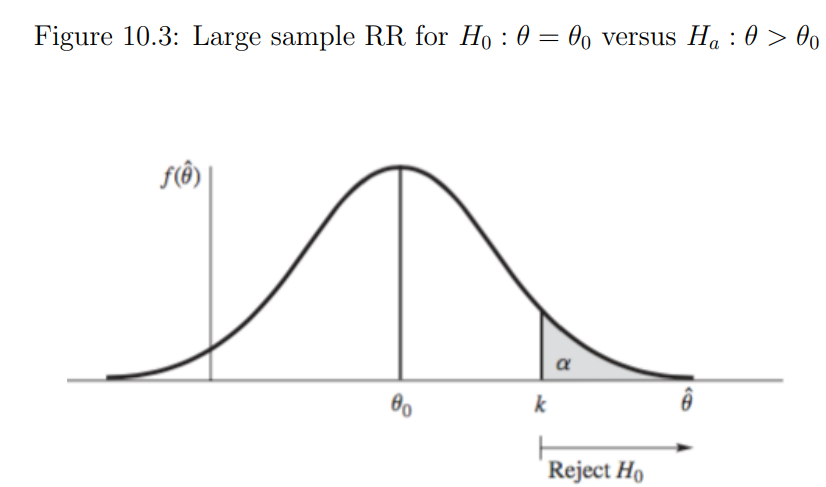
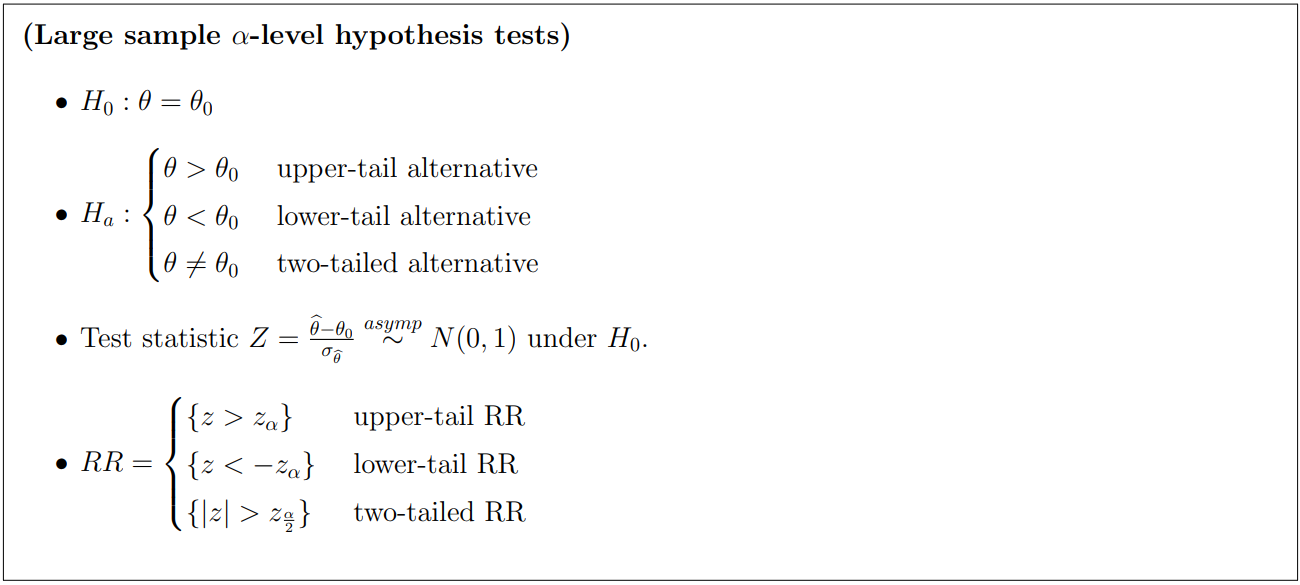
10.3 Common Large-Sample Tests
- Develop hypothesis testing procedures that are based on an estimator that has an normal sampling distribution with mean and standard error
- For a specific value , wish to test : versus :
- RR={ k} is a resonable choice.
- The value of k in the rejection region RR is determined by fixing the type I error probability and choosing k accordingly.

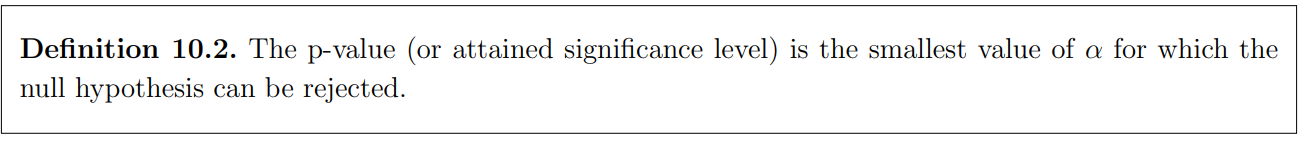
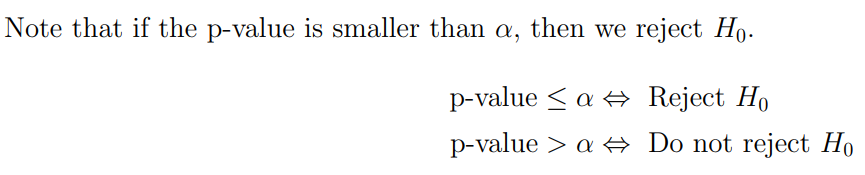
10.6 Another Way to Report the Results of a Statistical Test: Attained Significance Levels, or p-Values
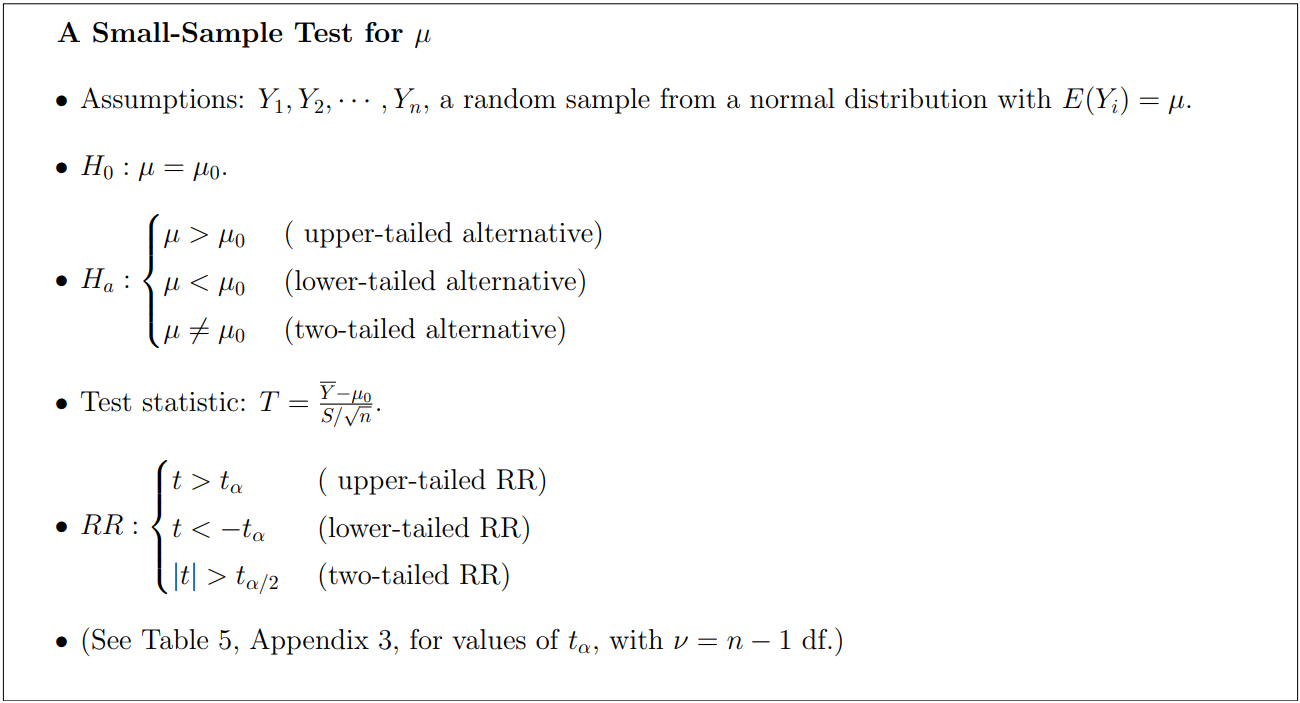
10.8 Small-Sample Hypothesis Testing for
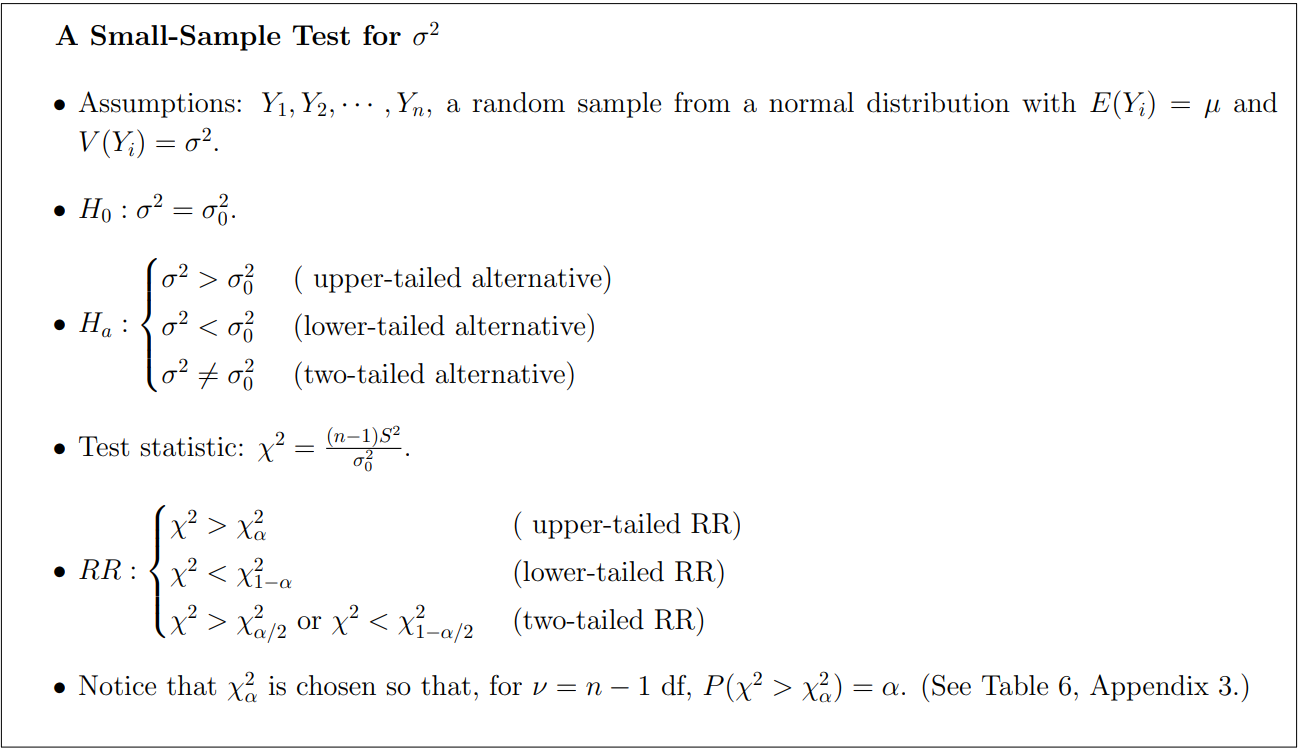
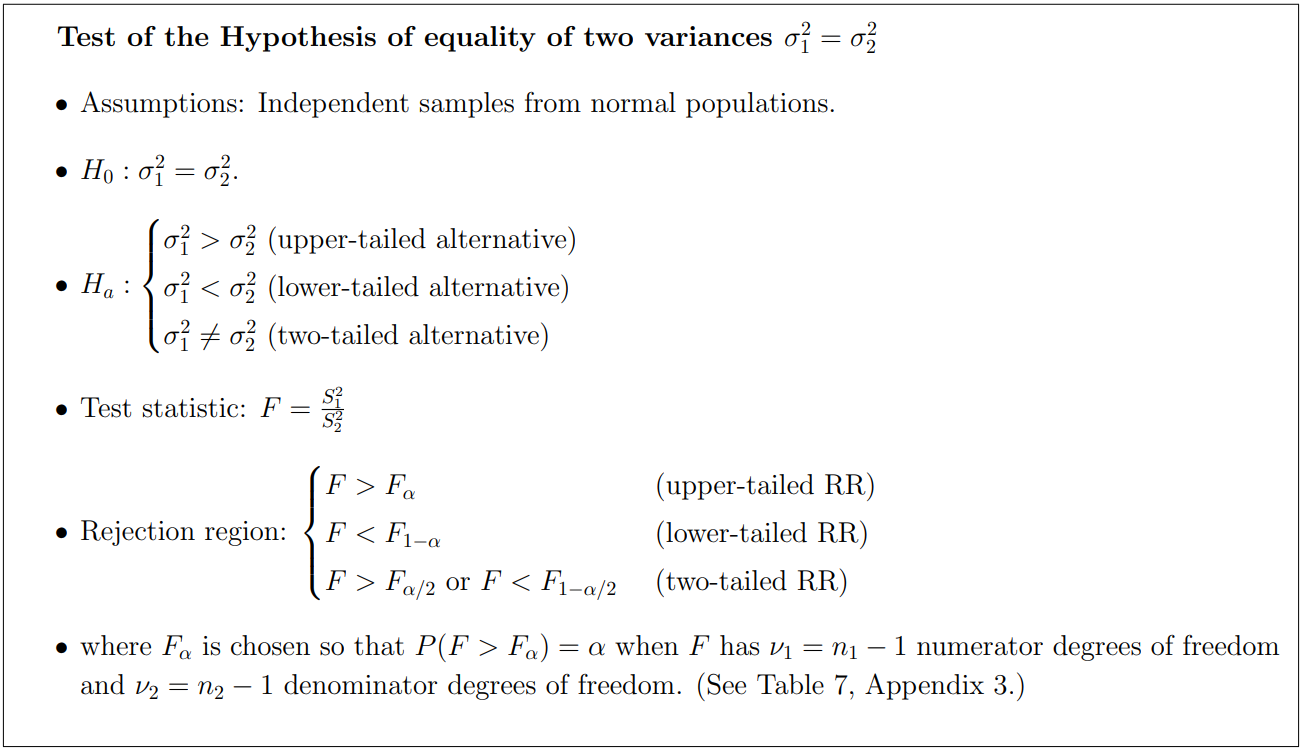
10.9 Testing Hypotheses Concerning Variances
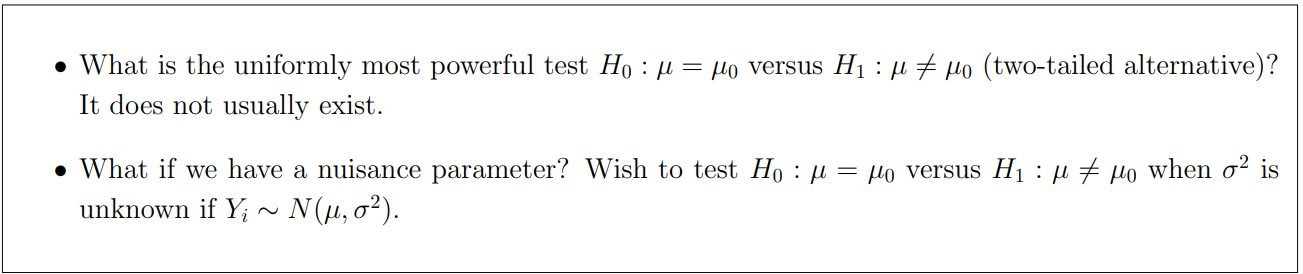
10.10 Power of Tests and the Neyman-Pearson Lemma
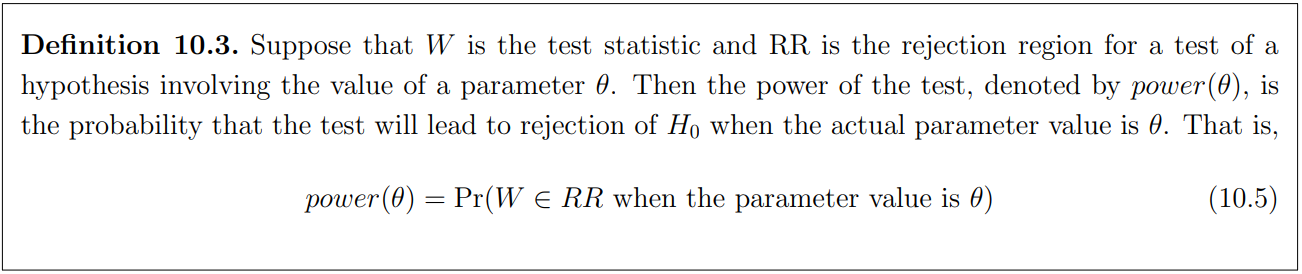
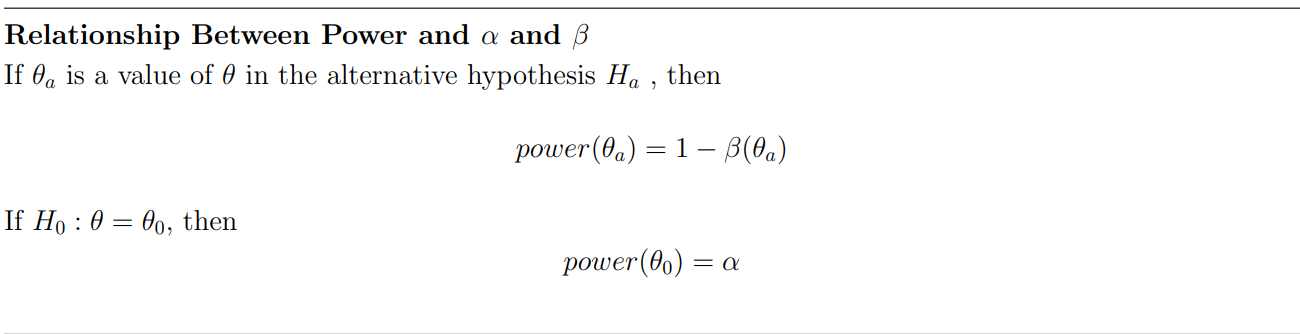
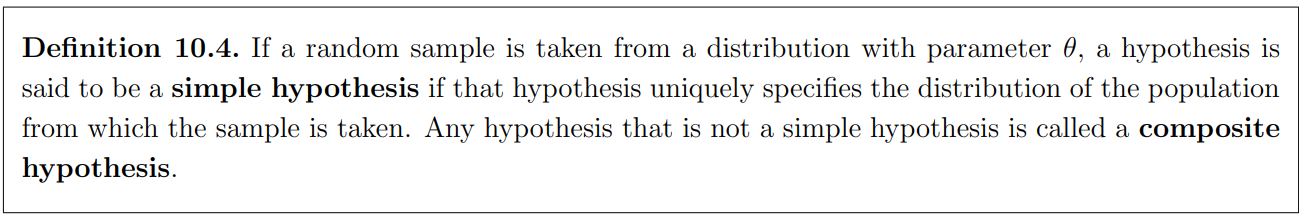
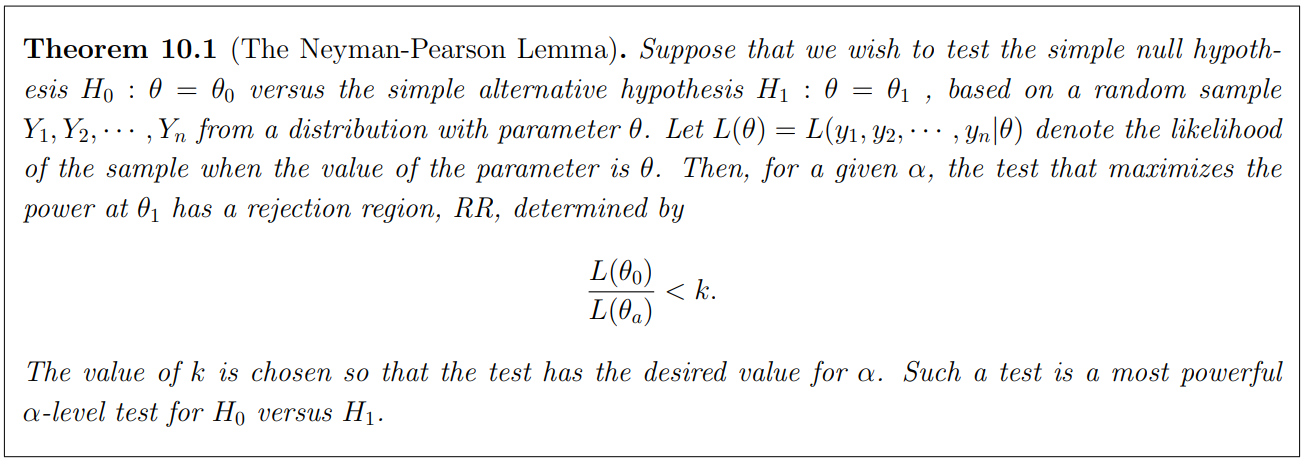
Only Simple null hypothesis!!
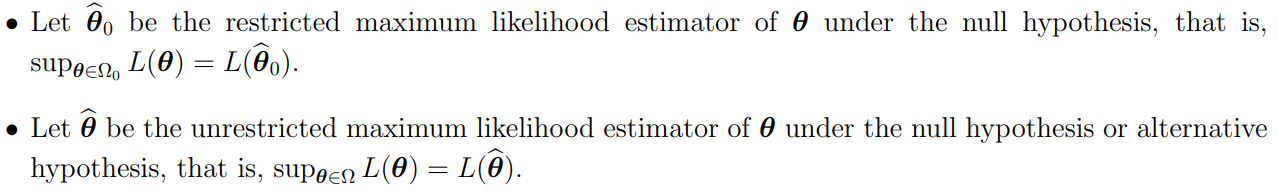
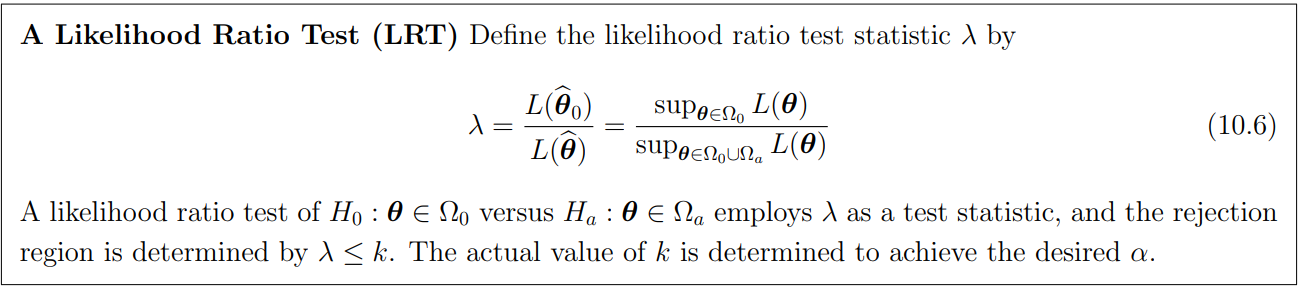
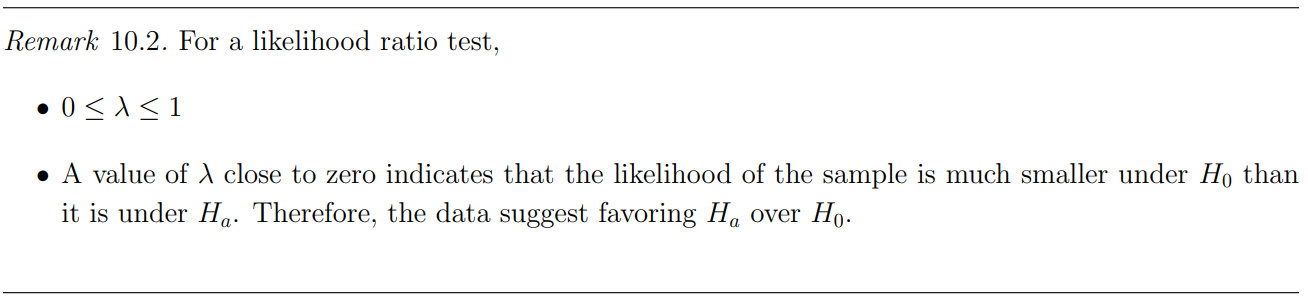
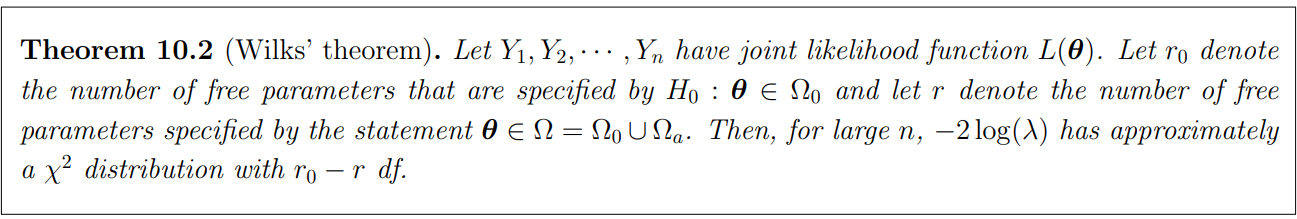
10.11 Likelihood Ratio Tests(LRTs)