본 글은 졸업프로젝트인 PBL의 과정 중 하나입니다.
GAN
적대적 생성 모델
일반적인 머신 러닝 모델이 생성하는 것: class에 대한 예측값, continuous random variable에 대한 interval prediction 등의 가장 높은 probability or likerlihood를 찾아냄.
GAN은 ‘데이터의 형태’를 만들어냄.
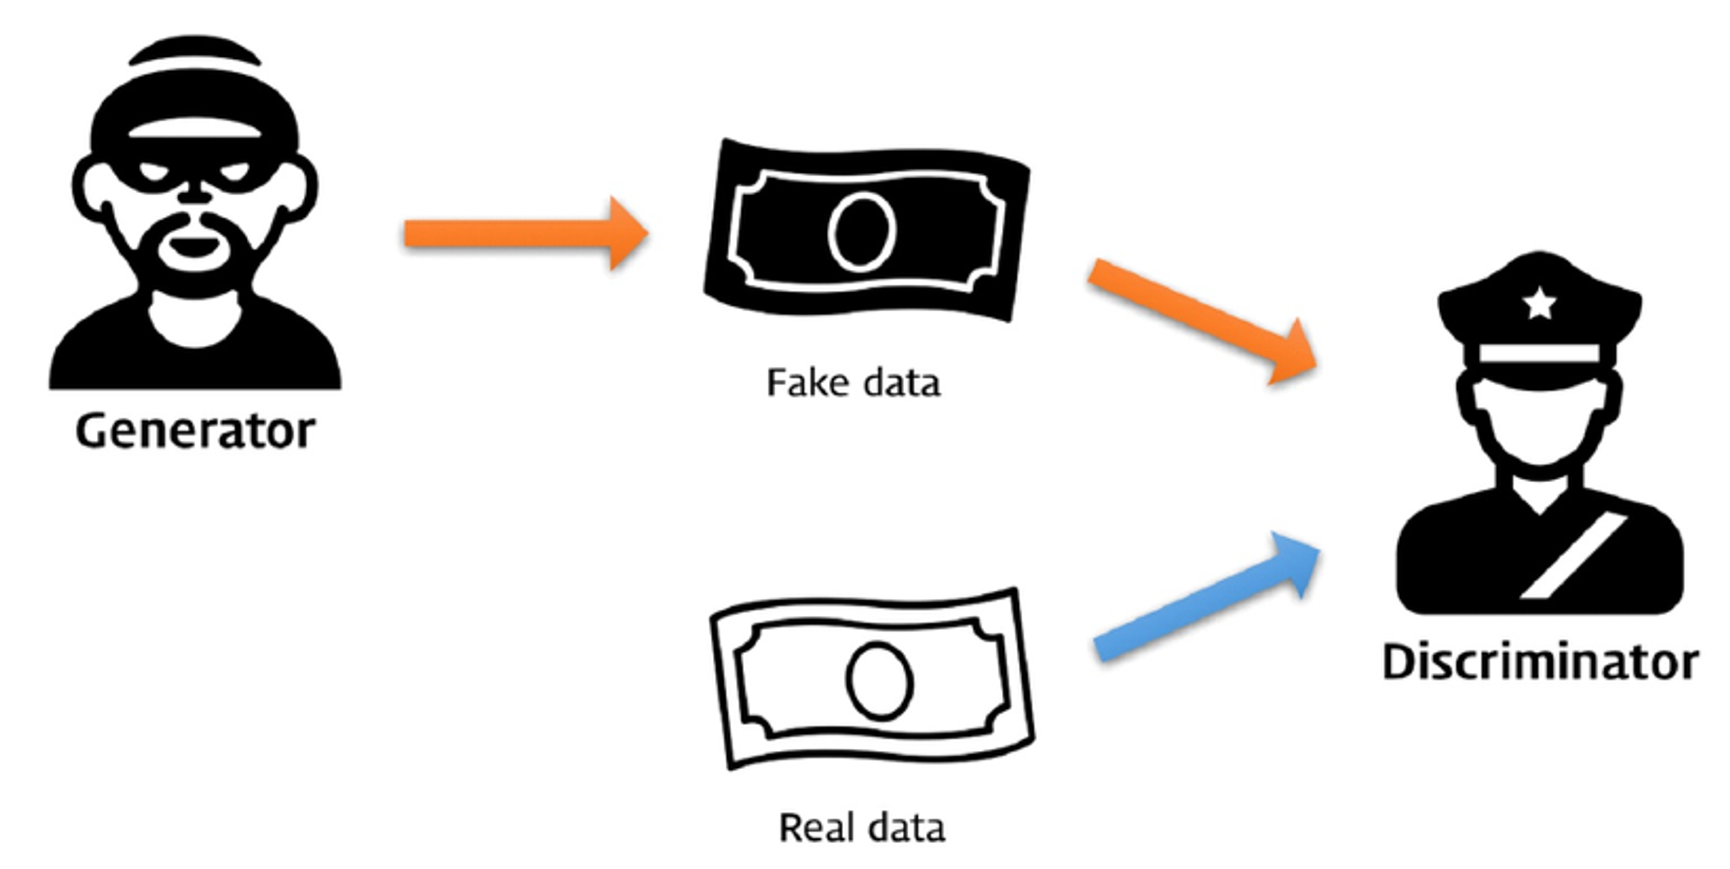
처음에는 generator도, discriminator도 낮은 기술력으로 위조지폐를 생성하고, 판별했음.
하지만 점점 g’가 위조하고, d’가 판별하는 과정을 반복할수록 점점 서로의 능력이 향상됨. 이것이 적대적 생성모델인 GAN의 핵심 아이디어.
- GAN의 학습방법
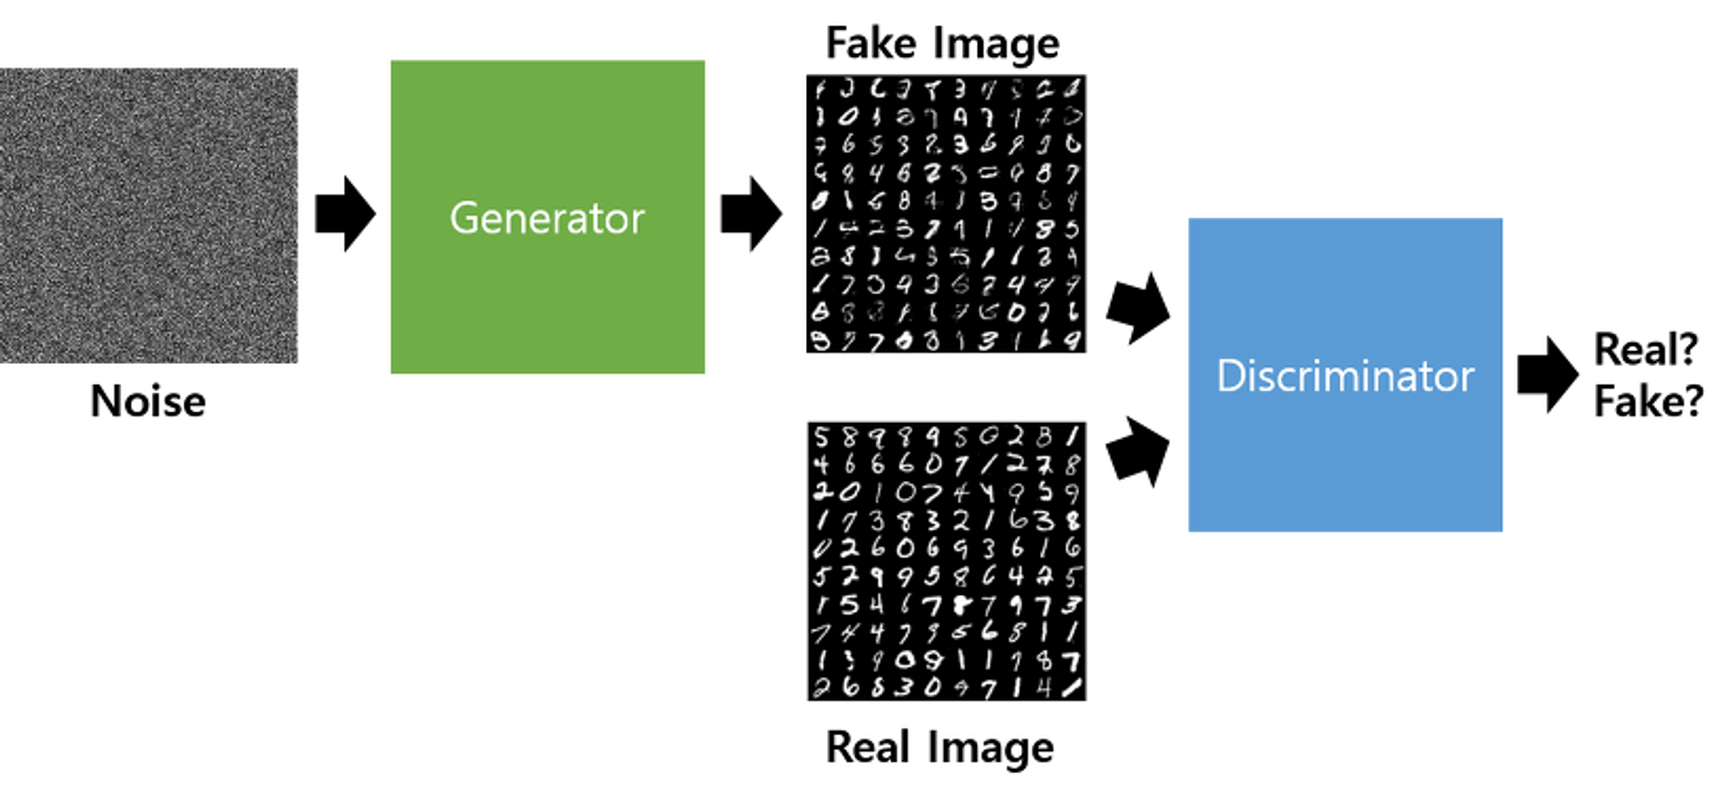
G는 random한 noise를 생성해내는 vector z를 input으로 하고,
D가 판별하고자 하는 input image (여기서는 28X28의 mnist 이미지) 를 output으로 하는 neural network unit이다.
학습과정 1. 실제 mnist 이미지, Real Image를 D로 하여금 '진짜'라고 학습시킴
학습과정 2. vector z와 G에 의해 생성된 Fake Image를 '가짜'라고 학습시킴
*D가 두번 학습되고 G는 1번 학습되는 것이 아니라, 1번과정에서 real image와 fake image를 D의 x input으로 합쳐서 학습하는 것.
- Keras code
def train_D(self):
        """
        train Discriminator
        """

        # Real data
        real = self.data.get_real_sample()

        # Generated data
        z = self.data.get_z_sample(self.batch_size)
        generated_images = self.gan.G.predict(z)

        # labeling and concat generated, real images
        x = np.concatenate((real, generated_images), axis=0)
        y = [0.9] * self.batch_size + [0] * self.batch_size

        # train discriminator
        self.gan.D.trainable = True
        loss = self.gan.D.train_on_batch(x, y)
        return loss

    def train_G(self):
        """
        train Generator
        """

        # Generated data
        z = self.data.get_z_sample(self.batch_size)

        # labeling
        y = [1] * self.batch_size

        # train generator
        self.gan.D.trainable = False
        loss = self.gan.GD.train_on_batch(z, y)
        return loss
D.trainable을 사용하여, D는 한번만 학습되도록 구현함.
코드에서 D(G(z))에서 D의 학습을 False로 한다면, 결국 G만 학습이 됨.
'x = np.concatenate((real, generated_images), axis=0)' 이 부분을 통해 진짜이미지와 가짜이미지를 D에게 한번에 학습시킴
VAE
- AE vs VAE
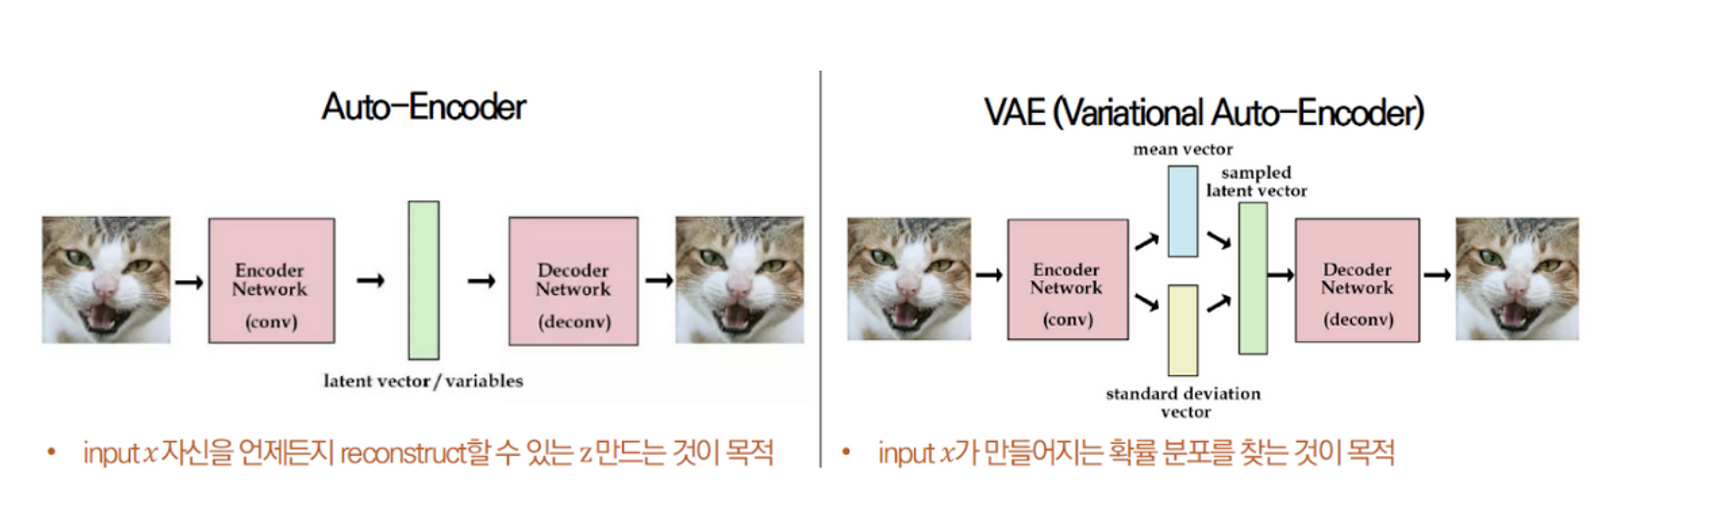
공통점: 오토인코더 (력 변수(x)가 Encoder를 거쳐 Latent Variable인 z에 매핑되고, 이 z가 Decoder를 거쳐 x가 출력되도록 학습되는 형태)
AE (는 애초에 제너레이티브 모델은 아님) : 원래의 데이터를 복원하는 것. Z를 잘 임베딩 하는 것.
VAE : 원래의 데이터를 새로운 유사한 데이터로 재생성
- VAE 구조
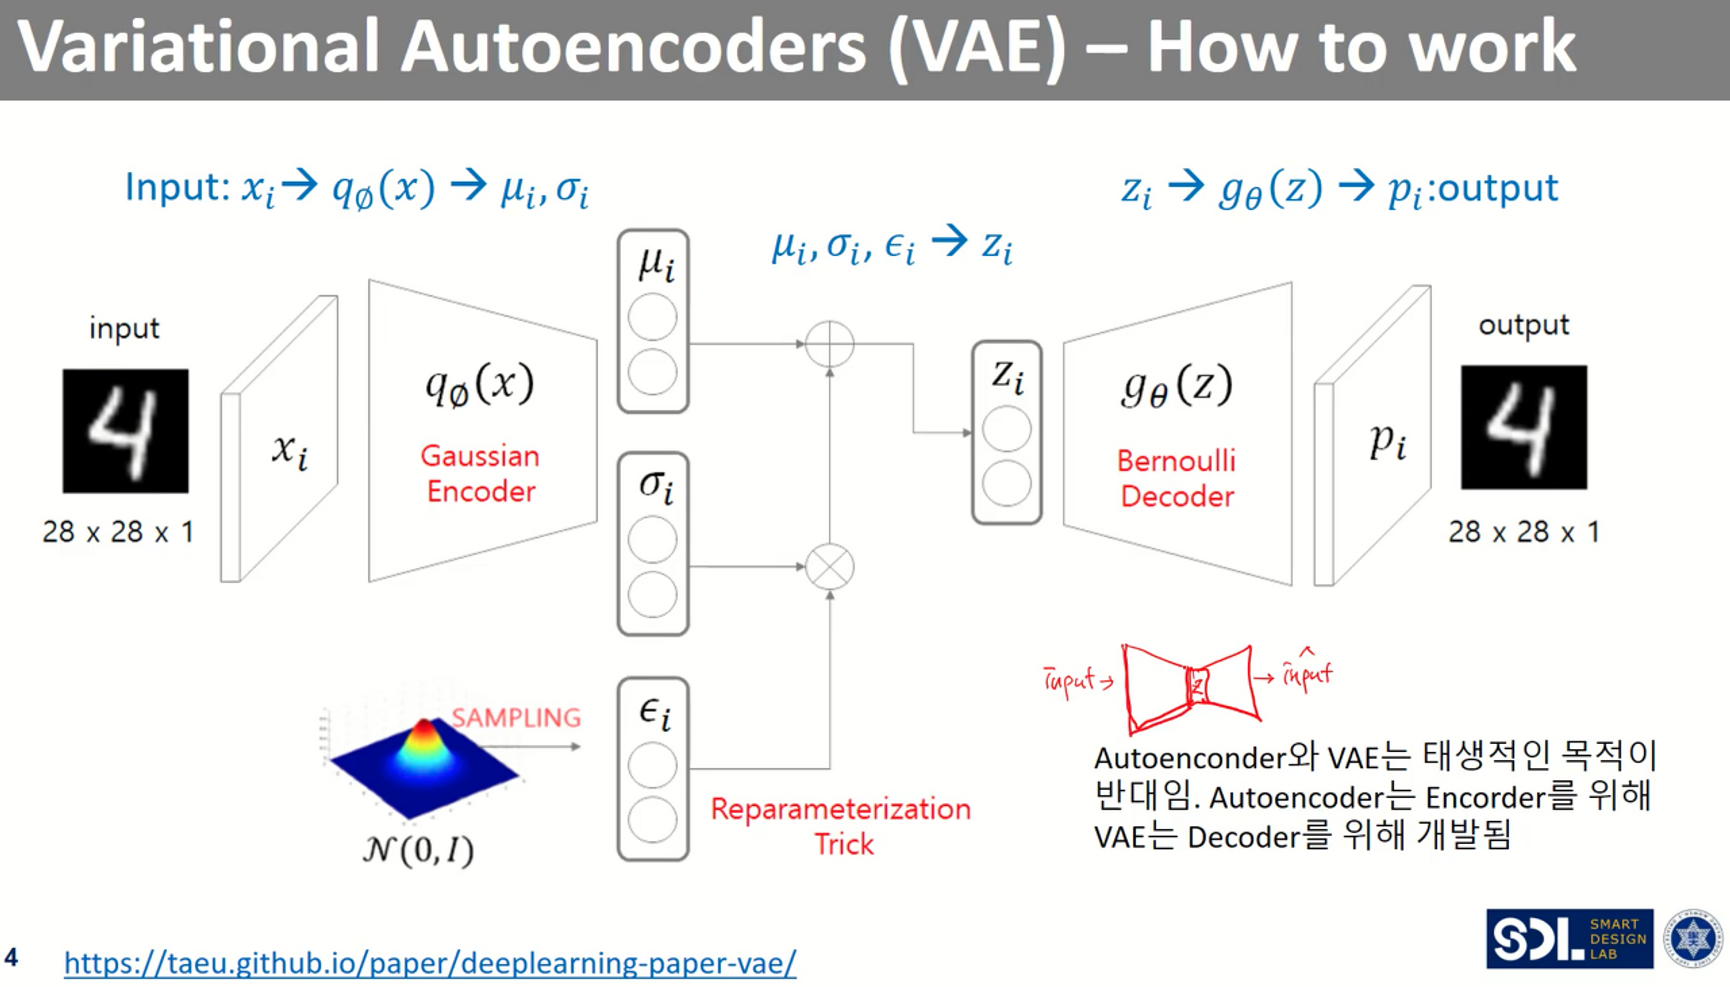
이전 Auto-encoder는 deterministic하게 latent variable을 고정했다면,
Variational Auto-encoder는 latent variable에 zero-mean Gaussian Noise를 추가해서
본 이미지에서 살짝씩 달라지는 형태
- VAE 코드
from keras.layers import Lambda, Input, Dense
from keras.models import Model
from keras.datasets import mnist
from keras.losses import mse, binary_crossentropy
from keras.utils import plot_model
from keras import backend as K
import numpy as np
import matplotlib.pyplot as plt
import os
from keras import objectives
# reparameterization trick
# instead of sampling from Q(z|x), samples eps = N(0,I)
# backpropagation을 위해서, sampling은 미분이 불가능해서 backprop이 불가능!
# z = z_mean + sqrt(var)*eps
def sampling(args):
    z_mean, z_log_var = args
    batch = K.shape(z_mean)[0]
    dim = K.int_shape(z_mean)[1]
    # by default, random_normal has mean =0, std=1.0
    epsilon = K.random_normal(shape=(batch,dim))
    return z_mean +K.exp(0.5*z_log_var)*epsilon

def main():
    (X_train,Y_train), (X_test,Y_test) = mnist.load_data()
    row = 28
    col = 28
    dim = row * col
    X_train = np.reshape(X_train,[-1,dim]).astype('float32')/255
    X_test = np.reshape(X_test,[-1,dim]).astype('float32')/255

    input_shape = (dim,)
    intermediate_dim = 512
    batch_size = 128
    latent_dim = 2 # mean and standard deviation!
    epochs = 30

    # VAE model = autoencoder (encoder + decoder)
    inputs = Input(shape=input_shape,name='encoder_input')
    # train q(z|x) -> approximation
    x = Dense(intermediate_dim,activation='relu')(inputs)
    x = Dense(intermediate_dim,activation='relu')(x)
    z_mean = Dense(latent_dim,name='z_mean')(x)
    z_log_var = Dense(latent_dim,name='z_log_var')(x)

    # use reparameterization trick to push the sampling out as input
    # z_mean+sqrt(var)*eps , Adding zero-mean Gaussian noise
    z = Lambda(sampling,output_shape=(latent_dim,),name='z')([z_mean,z_log_var])

    encoder = Model(inputs,[z_mean,z_log_var,z],name='encoder')
    encoder.summary()
    plot_model(encoder,to_file='vae_mlp_encoder.jpg',show_shapes=True)

    # decoder
    # p(x|z)
    latent_inputs = Input(shape=(latent_dim,),name='z_sampling')
    x = Dense(intermediate_dim,activation='relu')(latent_inputs)
    x = Dense(intermediate_dim,activation='relu')(x)
    outputs = Dense(dim,activation='sigmoid')(x) # 0~1

    decoder = Model(latent_inputs,outputs,name='decoder')
    decoder.summary()
    plot_model(decoder,to_file='vae_mlp_decoder.jpg',show_shapes=True)

    # VAE
    outputs = decoder(encoder(inputs)[2])
    vae = Model(inputs,outputs,name='vae_mlp')

    models = (encoder,decoder)
    data = (X_train,Y_train)

    def vae_loss(x, x_decoded_mean):
        xent_loss = objectives.binary_crossentropy(x, x_decoded_mean)
        kl_loss = -0.5 * K.mean(1 + z_log_var - K.square(z_mean) - K.exp(z_log_var))
        loss = xent_loss + kl_loss
        return loss

    vae.compile(optimizer='adam',loss=vae_loss)
    vae.summary()
    plot_model(vae,to_file='vae_mlp.jpg',show_shapes=True)
    vae.fit(X_train,X_train,epochs=epochs,batch_size=batch_size,validation_data=(X_test,X_test))
    vae.save_weights('vae_mlp_mnist.h5')

    plot_results(models,data,batch_size=batch_size,model_name='vae_mlp')

def plot_results(models,
                 data,
                 batch_size=128,
                 model_name="vae_mnist"):
    """Plots labels and MNIST digits as function of 2-dim latent vector
    # Arguments:
        models (tuple): encoder and decoder models
        data (tuple): test data and label
        batch_size (int): prediction batch size
        model_name (string): which model is using this function
    """

    encoder, decoder = models
    x_test, y_test = data
    os.makedirs(model_name, exist_ok=True)

    filename = os.path.join(model_name, "vae_mean.png")
    # display a 2D plot of the digit classes in the latent space
    z_mean, _, _ = encoder.predict(x_test,
                                   batch_size=batch_size)
    plt.figure(figsize=(12, 10))
    plt.scatter(z_mean[:, 0], z_mean[:, 1], c=y_test)
    plt.colorbar()
    plt.xlabel("z[0]")
    plt.ylabel("z[1]")
    plt.savefig(filename)
    plt.show()

    filename = os.path.join(model_name, "digits_over_latent.png")
    # display a 30x30 2D manifold of digits
    n = 30
    digit_size = 28
    figure = np.zeros((digit_size * n, digit_size * n))
    # linearly spaced coordinates corresponding to the 2D plot
    # of digit classes in the latent space
    grid_x = np.linspace(-4, 4, n)
    grid_y = np.linspace(-4, 4, n)[::-1]

    for i, yi in enumerate(grid_y):
        for j, xi in enumerate(grid_x):
            z_sample = np.array([[xi, yi]])
            x_decoded = decoder.predict(z_sample)
            digit = x_decoded[0].reshape(digit_size, digit_size)
            figure[i * digit_size: (i + 1) * digit_size,
                   j * digit_size: (j + 1) * digit_size] = digit

    plt.figure(figsize=(10, 10))
    start_range = digit_size // 2
    end_range = n * digit_size + start_range + 1
    pixel_range = np.arange(start_range, end_range, digit_size)
    sample_range_x = np.round(grid_x, 1)
    sample_range_y = np.round(grid_y, 1)
    plt.xticks(pixel_range, sample_range_x)
    plt.yticks(pixel_range, sample_range_y)
    plt.xlabel("z[0]")
    plt.ylabel("z[1]")
    plt.imshow(figure, cmap='Greys_r')
    plt.savefig(filename)
    plt.show()

if __name__ == '__main__':
    main()
https://velog.io/@sjinu/VAE2 : 여기는 설명이 자세하고 (근데 어려움)
https://wewinserv.tistory.com/63 : 여기는 keras 코드가 있음