✨ 히스토그램 구하기
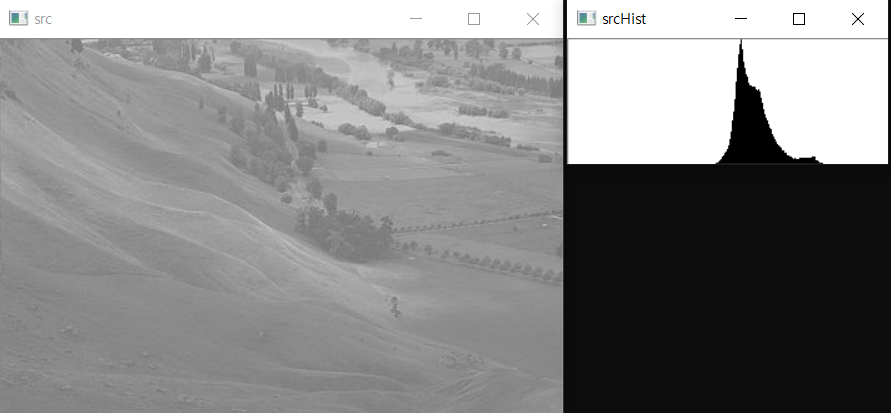
영상의 히스토그램 이란 영상의 픽셀 값 분포를 그래프 형태로 표현한 것이다. 그레이스케일 영상의 경우, 각 그레이스케일 값에 해당하는 픽셀의 개수를 구하고 이를 막대 그래프 형태로 표현할 수 있다. 컬러 영상에 대해서도 세개의 색상 성분 조합에 따른 픽셀 개수를 계산하여 히스토그램을 구할 수 있다.
✨ 그레이스케일 영상의 히스토그램
calcHist() 함수를 사용하여 히스토그램의 가로축인 빈(bin)을 조절할 수 있고, 여러장의 영상과 여러채널로 부터 히스토그램을 구할 수 있다.
void calcHist(const Mat* images, int nimages,
const int* channels, InputArray mask,
OutputArray hist, int dims,
const int* histSize, const float** ranges,
bool uniform = true, bool accumulate = false);
images : 입력 영상의 배열 또는 입력 영상의 주소
nimages : 입력 영상 개수
channels : 히스토그램을 구할 채널을 나타내는 정수형 배열
mask : 마스크영상
hist : 출력 히스토그램
dims : 출력 히스토그램의 차원수
histSize : 각 차원의 히스토그램 배열 크기를 나타내는 배열 (빈 개수를 나타내는 배열)
ranges : 각 차원의 히스토그램 범위
uniform : 히스토그램 빈의 간격이 균등한지를 나타내는 플래그
accumulate : 누적 플래그
히스토그램 구하는 함수
Mat calcGrayHist(const Mat& img) {
	CV_Assert(img.type() == CV_8UC1);
	Mat hist;
	int channels[] = { 0 };
	int dims = 1;
	const int histSize[] = { 256 };
	float graylevel[] = { 0, 256 };
	const float* ranges[] = { graylevel };
	calcHist(&img, 1, channels, noArray(), hist, dims, histSize, ranges);
	return hist;
}
히스토그램 그래프 그리는 함수
Mat getGrayHistImage(const Mat& hist) {
	CV_Assert(hist.type() == CV_32FC1);
	CV_Assert(hist.size() == Size(1, 256));
	double histMax;
	minMaxLoc(hist, 0, &histMax);
	Mat imgHist(100, 256, CV_8UC1, Scalar(255));
	for (int i = 0; i < 256; i++) {
		line(imgHist, Point(i, 100), Point(i, 100 - cvRound(hist.at<float>(i, 0) * 100 / histMax)), Scalar(0));
	}
	return imgHist;
}

