
- 데이터 불러오기
df = pd.read_excel('../data/02. sales-funnel.xlsx')
df.head()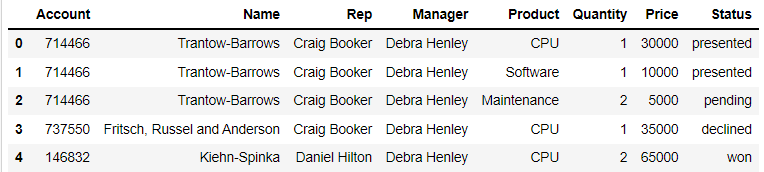
- 인덱스 설정
# Name 컬럼을 인덱스로 설정
# pd.pivot_table(df, index='Name')
df.pivot_table(index='Name') # 수치형 데이터만 value로 남음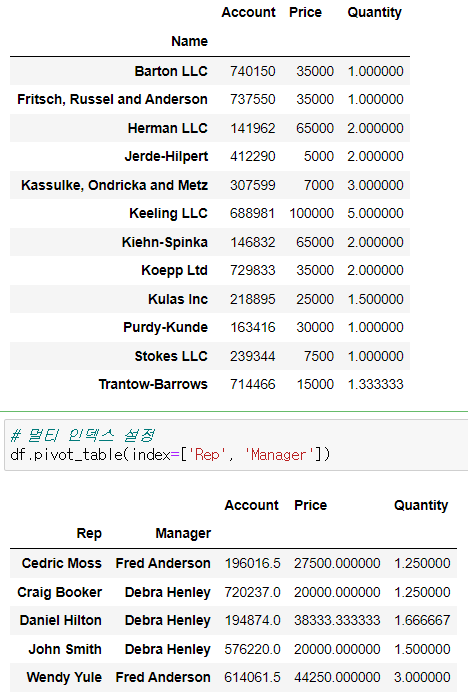
- values 설정
df.pivot_table(index=['Manager', 'Rep'], values="Price") # Price의 평균으로 반환(default)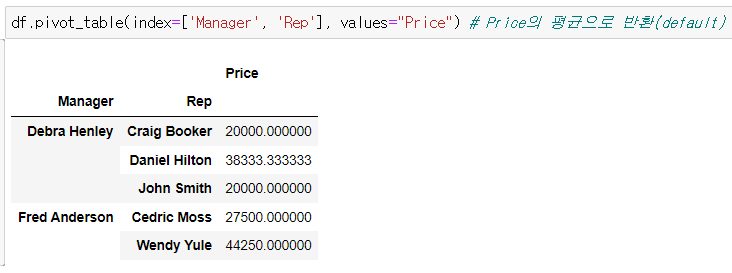
- 컬럼 연산 적용
df.pivot_table(index=['Manager', 'Rep'], values="Price", aggfunc=np.sum)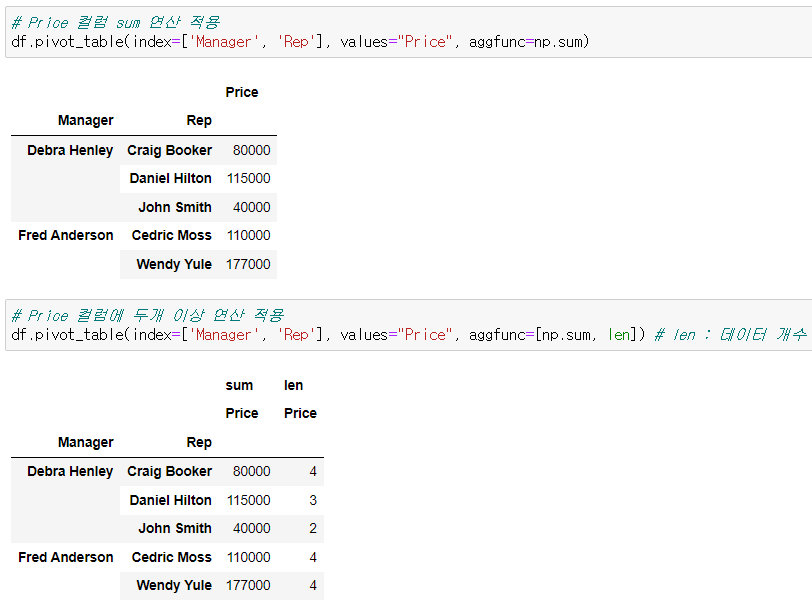
- 컬럼 설정
# 특정열 컬럼으로 지정
df.pivot_table(index=['Manager', 'Rep'], values="Price", columns="Product", aggfunc=np.sum)
# Nan 값 설정 : fill_value
df.pivot_table(index=['Manager', 'Rep'], values="Price", columns="Product", aggfunc=np.sum, fill_value=0)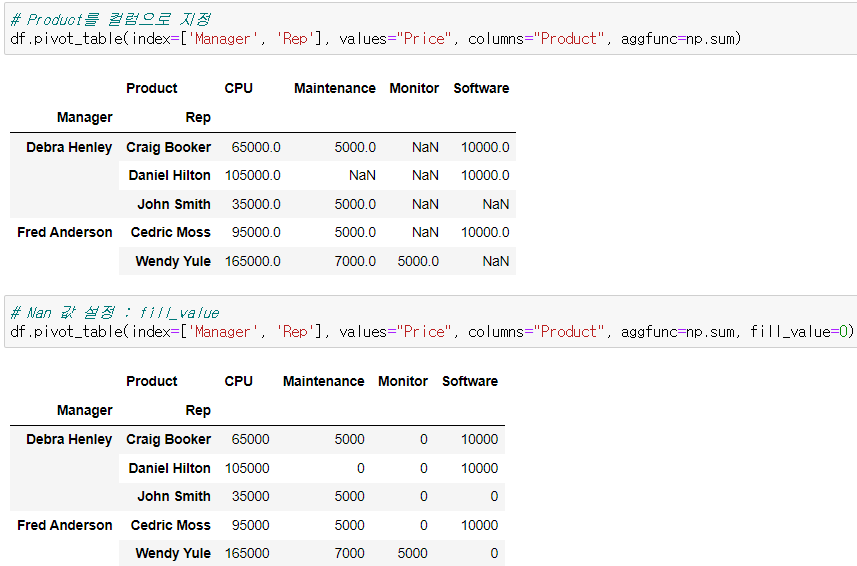
- 멀티 index, 멀티 value 설정
df.pivot_table(index=['Manager', 'Rep', 'Product'], values=["Price", 'Quantity'], aggfunc=np.sum, fill_value=0)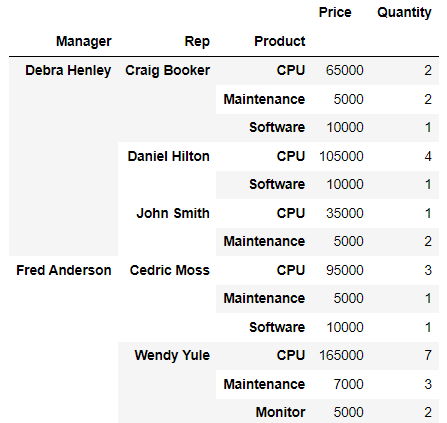
- 멀티 aggfunc 설정
df.pivot_table(
    index=['Manager', 'Rep', 'Product'],
    values=["Price", 'Quantity'],
    aggfunc=[np.sum, np.mean],
    fill_value=0,
    margins=True) # 총계(All) 값 추가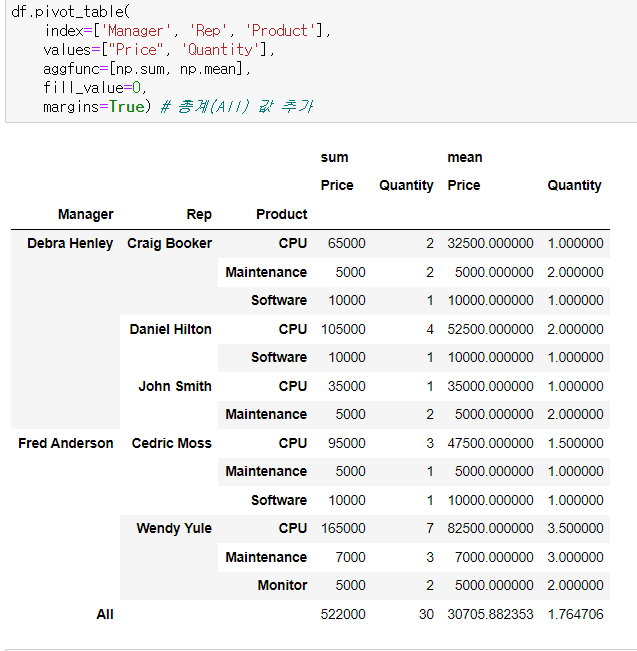

개발도상인 냄비짱