🧬 유전자 발현 데이터 시각화 및 분석 (GSE96058)
📦 사용한 라이브러리
import pandas as pd
import seaborn as sns
import matplotlib.pyplot as plt
from sklearn.preprocessing import StandardScaler
📂 1. 시리즈 매트릭스 파일 불러오기
file_path='GSE96058-GPL11154_series_matrix.txt'

try:
    #데이터 시작 지점 찾기
    with open(file_path,'r') as f:
        lines=f.readlines()

    data_start_line=0
    for i,line in enumerate(lines):
        if line.startswith('"ID_REF'):
            data_start_line=i
            print(data_start_line)
            break
    if data_start_line==0:
        print("데이터 시작 행을 찾을 수 없습니다.")

    df_raw=pd.read_csv(file_path, sep='\t', skiprows=data_start_line, index_col=0)

except FileNotFoundError:
    print(f"오류: 파일 경로 '{file_path}'를 확인해주세요.")
except Exception as e:
    print(f"데이터 처리 중 오류: {e}")
📈 2. 유전자 발현 데이터 간단 시각화 (히트맵)
# 파일 불러오기
df=pd.read_csv('GSE96058_gene_expression_3273_samples_and_136_replicates_transformed.csv.gz')

# 첫번째 열인 유전자 이름을 인덱스로 설정
df.set_index(df.columns[0], inplace=True)

# 숫자형으로 변환 + 결측값 처리 (안 하면 히트맵 오류 남)
df=df.apply(pd.to_numeric, errors='coerce')
df.fillna(0,inplace=True)

# 일부 유전자 샘플만 추출 (상위 50개 유전자의 50개 샘플)
df_subset=df.iloc[:50,:50]

# 히트맵 그리기
plt.figure(figsize=(18,10))
sns.heatmap(df_subset, cmap='viridis', cbar=True)
plt.title("Gene Expression Heatmap (ToP 50 genes x 50 samples)")
plt.xticks(rotation=45)
plt.yticks(rotation=0)
plt.tight_layout()
plt.show()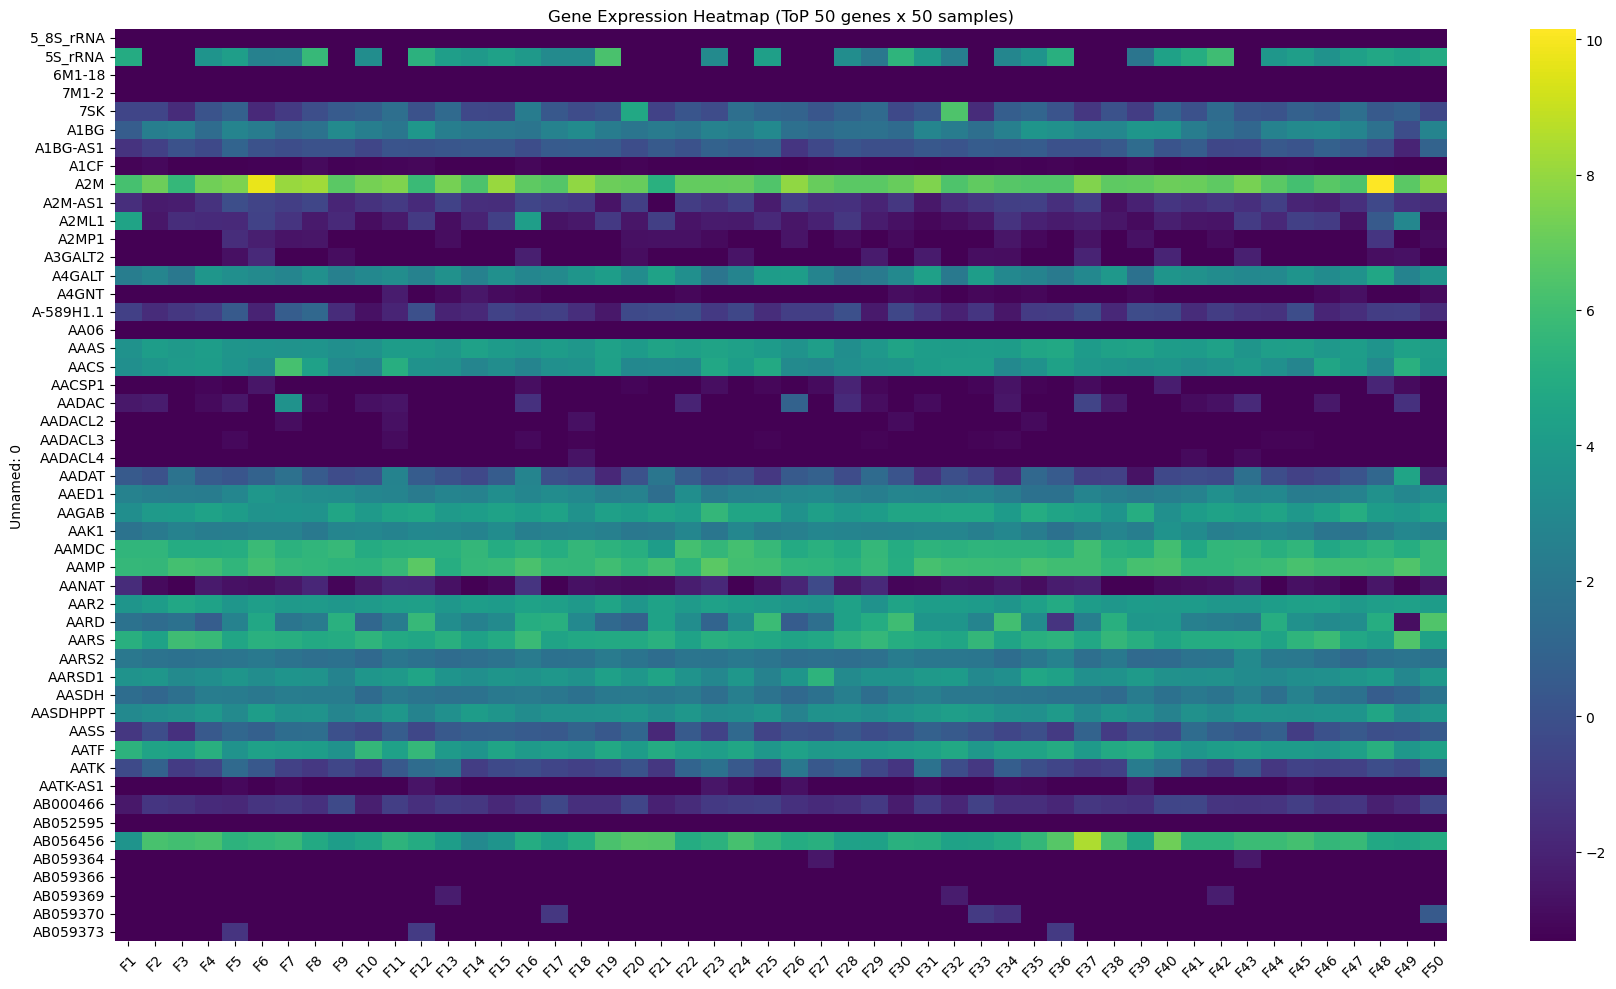
🧭 3. PCA (주성분 분석)
샘플들을 2차원 공간에서 시각화
from sklearn.decomposition import PCA
from sklearn.preprocessing import StandardScaler
import matplotlib.pyplot as plt

# 전치: 행=샘플, 열=유전자
df_T=df.T

# 표준화(각 유전자의 평균=0, 표준편차=1로 맞추기)
scaler=StandardScaler()
df_scaled=scaler.fit_transform(df_T)

# PCA(사이킷런 차원축소)
pca=PCA(n_components=2)   # 데이터의 주요 특징을 잘 설명하는 두 축(주성분)만 남김/2차원
pca_result=pca.fit_transform(df_scaled)

# 시각화
plt.figure(figsize=(10,6))
plt.scatter(pca_result[:,0],pca_result[:,1], alpha=0.6, cmap='viridis')  # 산점도(x축 주성분, y축 주성분, 점의 투명도 조절)
plt.title('PCA of Samples (based on gene expression)')
plt.xlabel('PC1')
plt.ylabel('PC2')
plt.grid(True)
plt.show()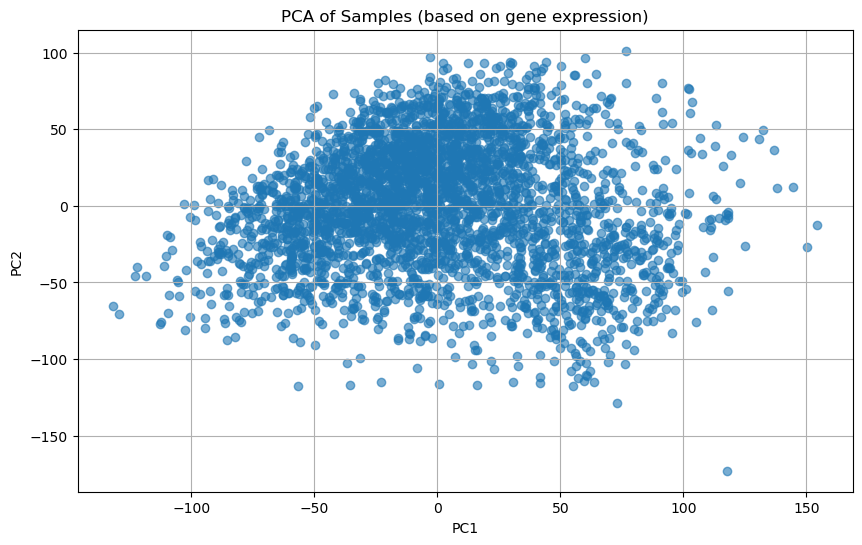
🧬 4. Clustermap
샘플 100개만 뽑아서 클러스터링된 히트맵 그리기
# 유전자 수가 너무 많으니 100개 정도 샘플링
df_subset2=df.sample(n=100,axis=0)

sns.clustermap(df_subset2, cmap="viridis", figsize=(14,10))
plt.title("Sample-Gene Clustermap")
plt.show()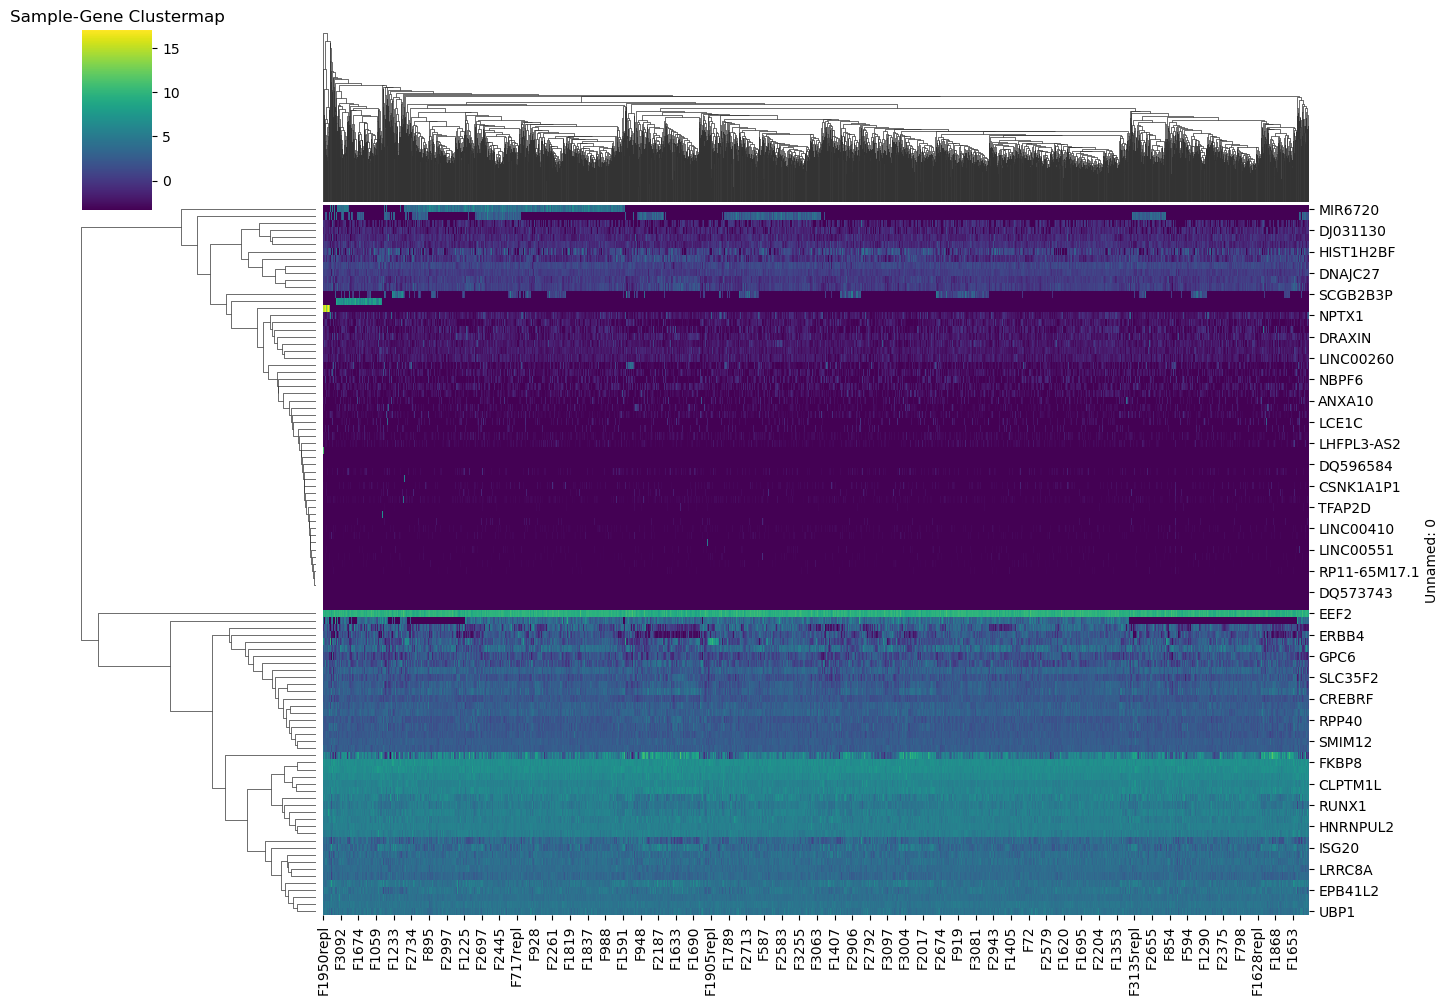
🎯 5. 유방암 주요 유전자 발현 확인 (박스플롯)
# 유방암 주요 유전자 분석
genes=['BRCA1', 'TP53', 'ESR1', 'ERBB2', 'PGR', 'GATA3']
df_target_genes=df.loc[df.index.intersection(genes)]  # df의 행 인덱스(유전자 이름) 중에서 genes에 포함된 것만 추림

df_target_genes.T.plot(kind='box', figsize=(10,6))  # 박스 플롯으로 그리기
plt.title("Expression distribution of breast cancer-related genes")
plt.ylabel("Expression level")
plt.xticks(rotation=45)
plt.grid(True)
plt.show()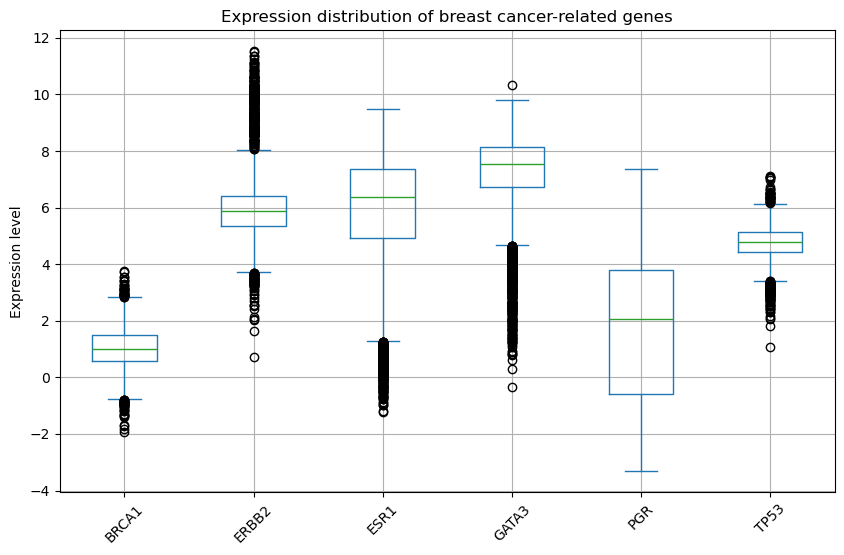
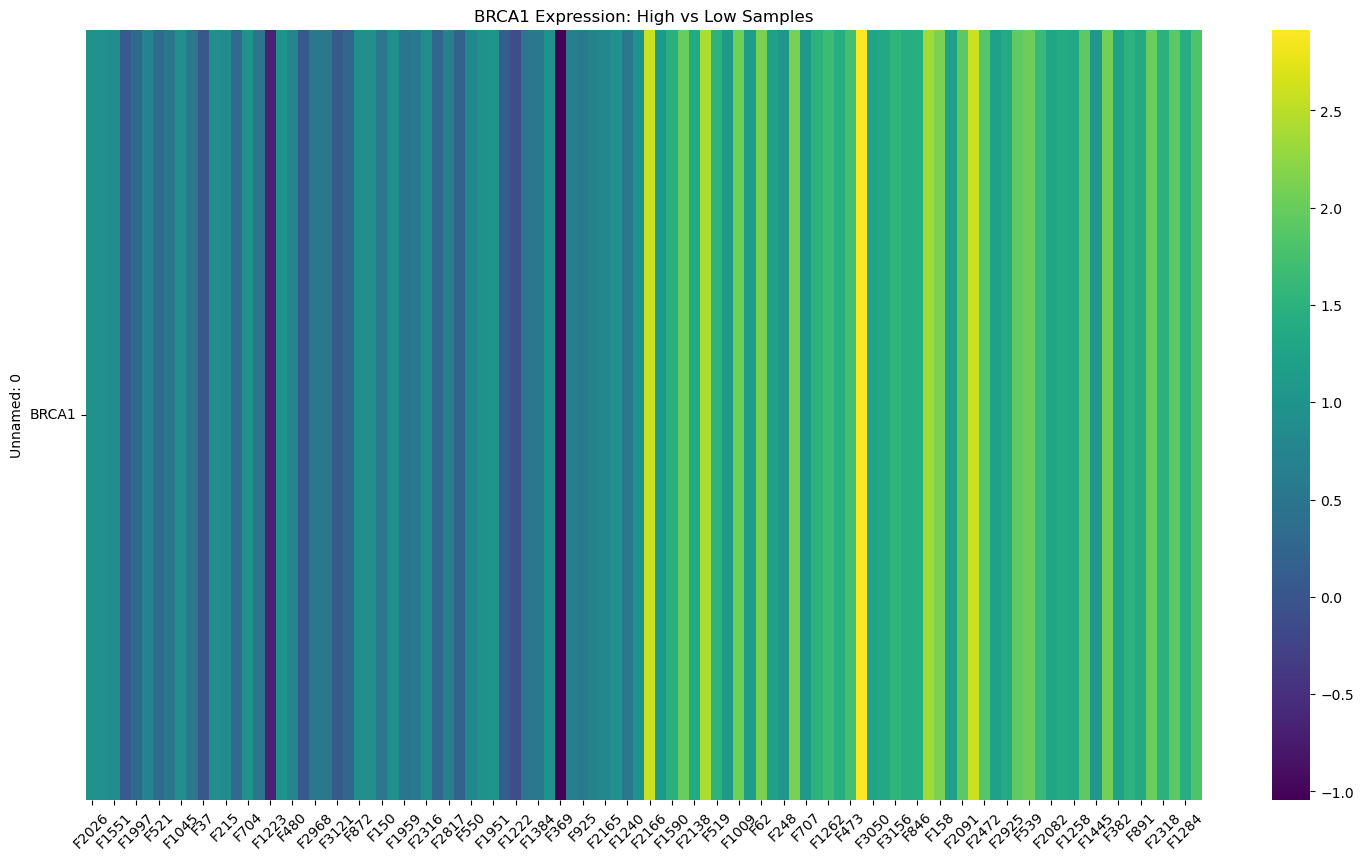
🧪 6. BRCA1 발현 높은 샘플 vs 낮은 샘플 비교
li=["BRCA1"]
df_BRCA1 =df.loc[df.index.intersection(li)]
df_BRCA1=df_BRCA1.apply(pd.to_numeric, errors='coerce').fillna(0)


med_value=df_BRCA1.loc['BRCA1'].median()

print(med_value)

low_samples=df_BRCA1.loc[:, df_BRCA1.loc['BRCA1'] < med_value]
high_samples=df_BRCA1.loc[:, df_BRCA1.loc['BRCA1'] >= med_value]

low_samples_50=low_samples.sample(n=50, axis=1, random_state=42)
high_samples_50=high_samples.sample(n=50, axis=1, random_state=42)

combined=pd.concat([low_samples_50, high_samples_50], axis=1)

print(combined.size)

plt.figure(figsize=(18,10))
sns.heatmap(combined, cmap='viridis', cbar=True)
plt.title("BRCA1 Expression: High vs Low Samples")
plt.xticks(rotation=45)
plt.yticks(rotation=0)
plt.show()