참고 문서
오늘 학습 내용 ✅
4단계
Pandas,Matplotlib,Celery를 이용해서 매주, 매월 소비습관 분석하기- 데이터 시각화에 주로 사용되는 라이브러리인
Matplotlib,Pandas- 를 이용해서 매주, 매월 단위의 총 소비금액을 비교, 분석하는 그래프를 그려보기
Pandas= 데이터를 정리, 분석 /Matplotlib= 데이터를 그래프로 시각화
- 를 이용해서 매주, 매월 단위의 총 소비금액을 비교, 분석하는 그래프를 그려보기
- 또한, 비동기 작업 및 작업 대기열을 관리해주는 라이브러리인
Celery- 를 백그라운드에서 활용하여 스케줄링을 통해 매주 특정 요일&매월 특정 날짜마다
- 그래프를 그리는 작업을 수행하도록 스케줄링 작업을 지정
- 데이터 시각화에 주로 사용되는 라이브러리인
Pandas (판다스)
-
데이터를 다루기 위한 파워풀한 도구 — “엑셀을 파이썬으로 더 강력하게 쓰는 느낌”
-
기능
- 표 형태 데이터(엑셀, CSV 등) 다루기
- 행/열 필터링, 정렬, 그룹화 등 데이터 전처리
- 누락된 값 처리
- 데이터 집계(총합, 평균, 최대/최소 등) ⭐️
- 시간/날짜별 데이터 다루기
- Django에서 DB에서 가져온 데이터를 통계로 만들 때 Pandas가 강력해짐
-
사용법
# 1. 데이터 불러오기
import pandas as pd

df = pd.read_csv('transactions.csv')

# 2. 특정 열만 보기
df['amount']

# 3. 조건 필터링
df[df['type'] == 'EXPENSE']

# 4. 그룹별 합계 계산(ex. 카테고리별 지출 )
df.groupby('category')['amount'].sum()
Matplotlib (맷플롯립)
-
데이터를 그래프로 그려주는 라이브러리 — Pandas와 세트로 자주 쓰임
-
기능
- 선 그래프(Line plot) / 막대 그래프(Bar chart)
- 파이 차트(Pie chart) / 히스토그램
- 트렌드 라인 / 데이터 시각화
- 잔액 그래프, 월별 지출 그래프 만들 때 바로 사용
-
사용법
import matplotlib.pyplot as plt

plt.plot([1, 3, 2, 6, 4])  # 그래프 그리기
plt.title("잔액 변화 그래프")
plt.xlabel("날짜")
plt.ylabel("잔액")
plt.show()

# 막대 그래프 예시
categories = ['식비', '교통', '쇼핑']
amounts = [12000, 8000, 15000]

plt.bar(categories, amounts)
plt.title("카테고리별 지출")
plt.show()
Pandas + Matplotlib 조합 예시
# 월별 지출 그래프
import pandas as pd
import matplotlib.pyplot as plt

df = pd.read_csv('transactions.csv')

monthly = df.groupby('month')['amount'].sum()

plt.plot(monthly.index, monthly.values)
plt.title("월별 지출 변화")
plt.show()
- 정석 루트: Pandas로 집계 → Matplotlib으로 시각화
Celery
[클라이언트] → Django API → (Celery에게 작업 전달) → 바로 응답
                             ↓
                       [Celery Worker]
                  (= 백그라운드 작업 처리)
-
파이썬 비동기 작업 처리(Background Task) 전문 툴
-
Django + DRF 개발할 때 무거운 작업을 백그라운드에서 처리해야 할 때 거의 필수로 사용하는 라이브러리.
- 요약하자면, Celery = “백그라운드에서 돌아가는 작업자(Worker)”
-
기능
- 오래 걸리는 작업을 백그라운드에서 실행
- 회원가입 시 이메일 인증메일 보내기
- 주문이 들어오면 문자 알림 보내기
- 업로드된 이미지 자동 리사이즈
- 주기적인 작업 예약 (Cron 같은 기능)
- 매일 00시에 DB 정리
- 매 10분마다 뉴스 크롤링
- 매일 9시에 출석체크 알림 전송
- 매주 특정 요일&매월 특정 날짜마다 그래프를 그리는 작업 시작
- Celery + Celery Beat 조합으로 가능
-
간단한 예시
from celery import shared_task
import time

@shared_task
def slow_task():
    time.sleep(10)
    print("10초 작업 완료")

# Django에서 호출
## → Django는 바로 응답하고, Celery가 백그라운드에서 실행
slow_task.delay()
Celery 사용시 필수
-
Celery를 사용할 때 Redis(또는 RabbitMQ)는 거의 필수(보통 Redis를 가장 많이 사용)
-
이유
- Celery는 작업을 전달받고 처리하는 방식이 “메시지 큐(Message Queue)” 구조
- 이 메시지 큐 역할을 Redis가 가장 간단하게 해주기 때문
-
Celery 구조
Django (작업 요청) ↓ [메시지 큐] ← Redis or RabbitMQ ↓ Celery Worker (작업자)- Django ↔ Celery worker 사이의 “작업 전달”을 담당하는 게 Redis임.
- Celery는 자체 메시지 큐가 없고 반드시 외부 메시지 브로커(redis, rabbitmq 등) 가 필요
- Celery는 브로커 없이 작동하지 않음.
-
Redis 역할
- 1) Celery 메시지 큐 역할
- “할 일 목록 저장소”
- Django에서 task.delay() 하면 Redis에 작업이 저장됨
- Worker가 Redis에서 작업을 꺼내와 처리
- 2) Celery 결과 저장(옵션)
- 예: "백그라운드 작업 결과 조회"
- 1) Celery 메시지 큐 역할
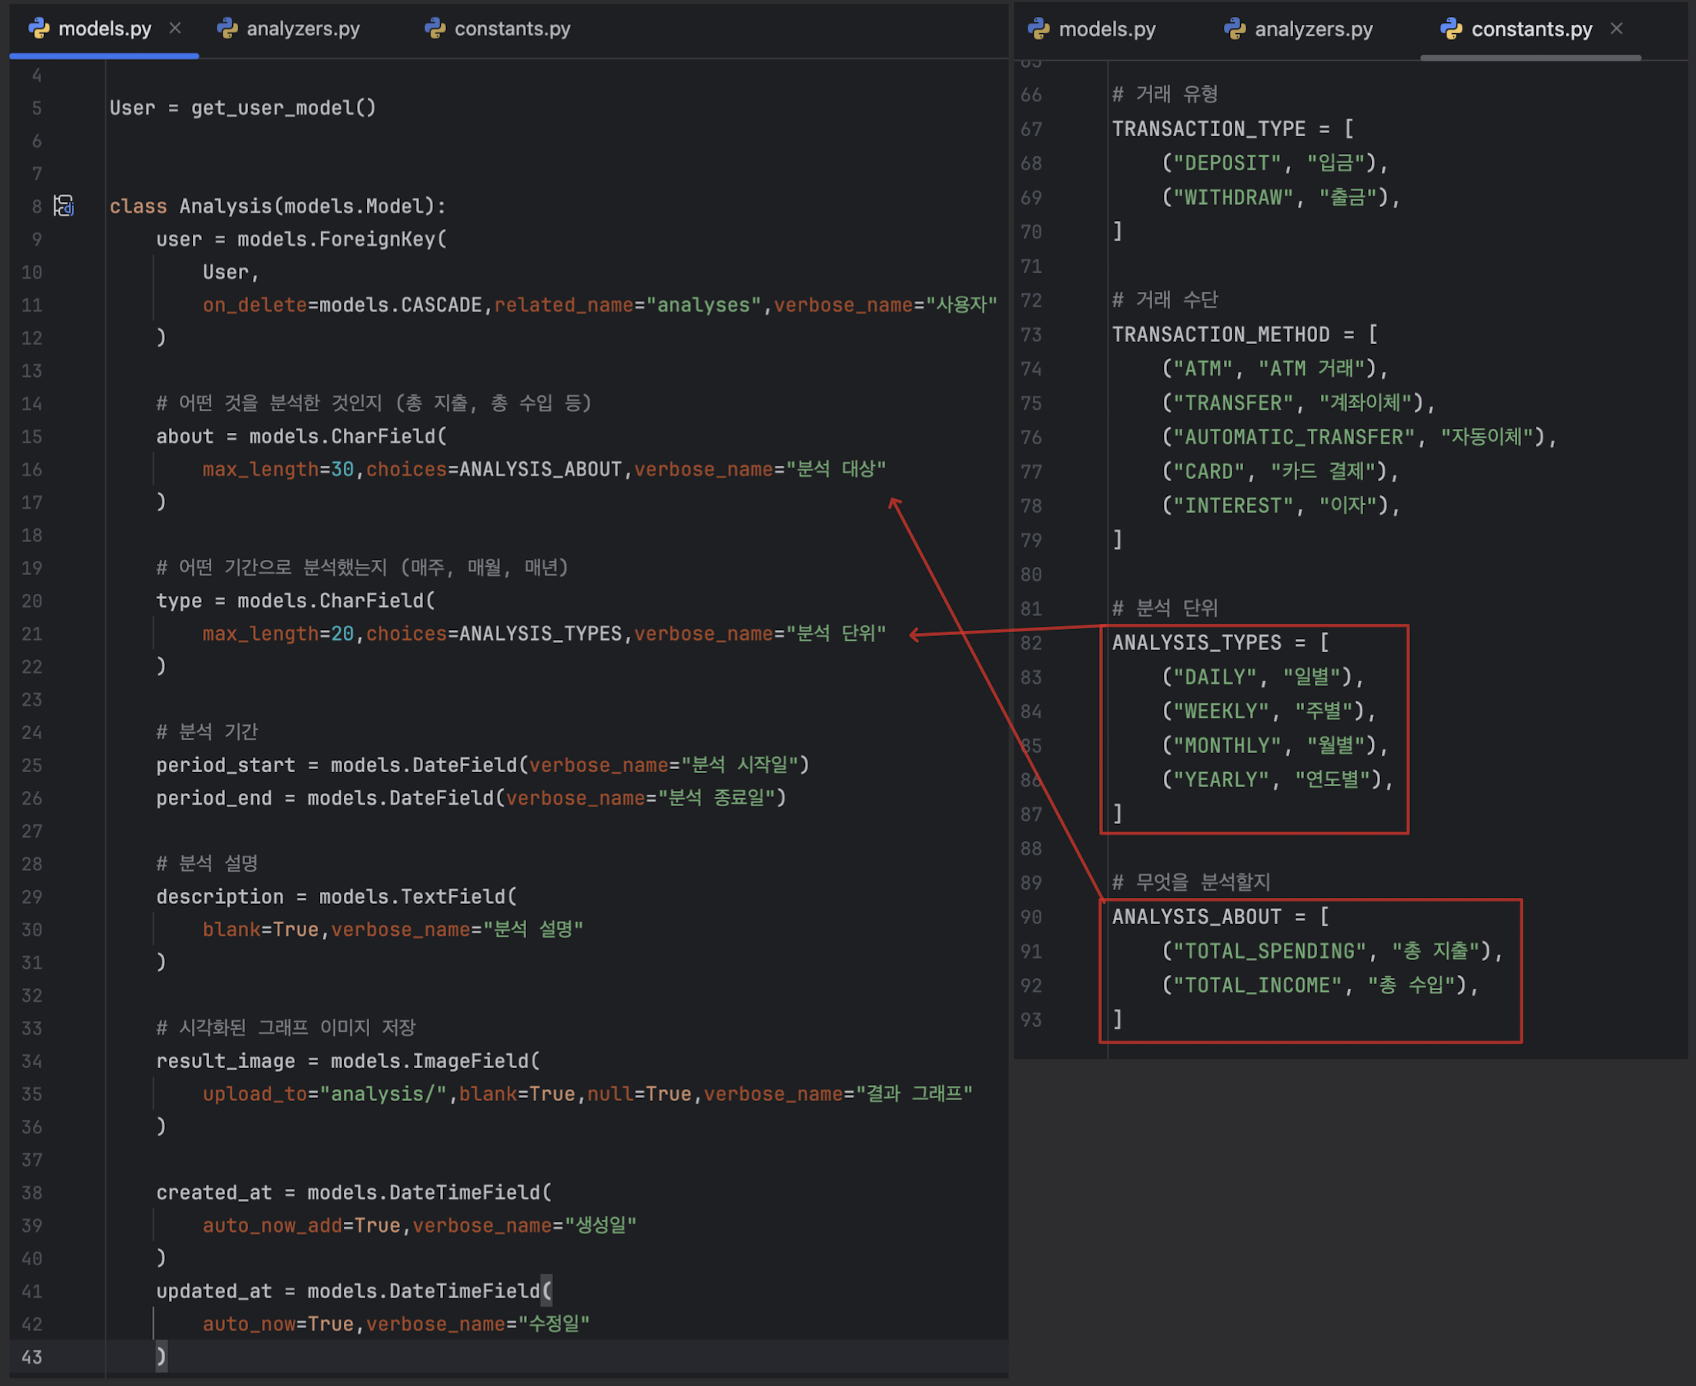
Analysis 앱 만들기
Analysis App 생성과 Analysis 모델 구현하기
코드 리뷰
serializers.py
1. Analysis 모델을 JSON 변환/검증하기 위한 Serializer 선언.
class AnalysisSerializer(serializers.ModelSerializer):

2. Analysis 모델의 모든 필드를 포함하도록 설정
    class Meta:
        model = Analysis
        fields = "__all__"
views_html.py
@login_required
- 1. 로그인한 사용자만 접근하도록 제한하는 데코레이터

def analysis_list_html(request):
- 2. 분석목록 페이지

    user = request.user
    - 3. 현재 요청 보낸 사용자

    period = request.GET.get("period")
    - 4. URL 파라미터로 period 값 가져옴.

    qs = Analysis.objects.filter(user=user).order_by("-created_at")
	- 5. 본인 데이터만 조회 → 최신순 정렬.

# period 조건 적용

    if period == "DAILY":
        start, end = get_daily_range()
        - 1. get_daily_range() = utils에 만들어 놓은 함수임
        qs = qs.filter(period_start=start, period_end=end)

    elif period == "LAST_DAY":
        start, end = get_last_day_range()
        qs = qs.filter(period_start=start, period_end=end)

    elif period == "WEEKLY":
        start, end = get_week_range()
        qs = qs.filter(period_start=start, period_end=end)

    elif period == "LAST_WEEK":
        start, end = get_last_week_range()
        qs = qs.filter(period_start=start, period_end=end)

    elif period == "MONTHLY":
        start, end = get_month_range()
        qs = qs.filter(period_start=start, period_end=end)

    elif period == "LAST_MONTH":
        start, end = get_last_month_range()
        qs = qs.filter(period_start=start, period_end=end)

    elif period == "YEARLY":
        start, end = get_year_range()
        qs = qs.filter(period_start=start, period_end=end)

    elif period == "LAST_YEAR":
        start, end = get_last_year_range()
        qs = qs.filter(period_start=start, period_end=end)

    return render(request, "analysis/analysis_list.html", {
        "analyses": qs
    })
@login_required
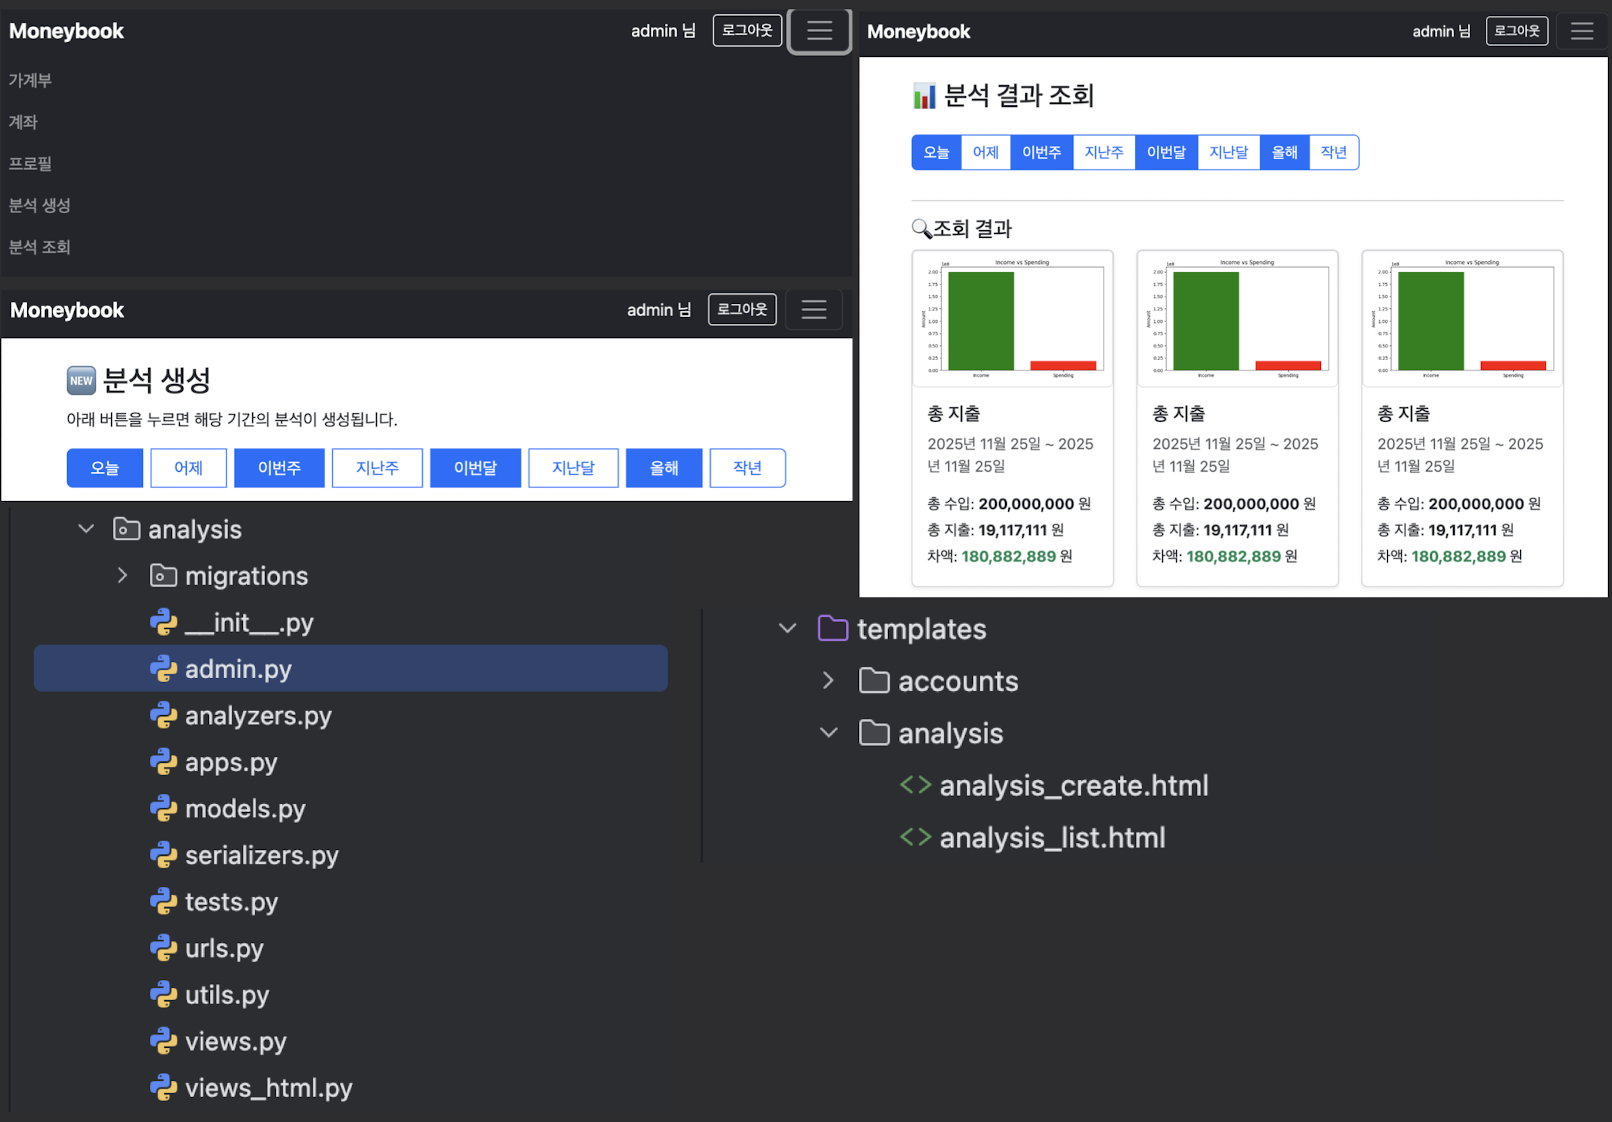
def analysis_create_html(request):
- 1. 분석 생성 페이지
result = None
- 2. 기본값 설정
if request.method == "POST":
analysis_type = request.POST.get("type")
- 3. 어떤 기간을 눌렀는지 확인
# 기간 계산
mapping = {
"DAILY": get_daily_range,
"LAST_DAY": get_last_day_range,
"WEEKLY": get_week_range,
"LAST_WEEK": get_last_week_range,
"MONTHLY": get_month_range,
"LAST_MONTH": get_last_month_range,
"YEARLY": get_year_range,
"LAST_YEAR": get_last_year_range,
}
if analysis_type not in mapping:
- 4. 잘못된 타입이면 에러
return render(request, "analysis/analysis_create.html", {"error": "유효하지 않은 타입"})
start, end = mapping[analysis_type]()
- 5. 날짜 범위 계산 = 이름에 맞는 함수 실행
analyzer = Analyzer(
user=request.user,
about="TOTAL_SPENDING",
period_type=analysis_type,
start_date=start,
end_date=end,
)
result = analyzer.run()
- 6. 분석 실행 후 DB 저장 + 이미지 저장views.py (API)
조회 (ListAPIView)
class AnalysisListView(ListAPIView):
    serializer_class = AnalysisSerializer
    - 1. 응답을 직렬화할 때 사용
    permission_classes = [IsAuthenticated]
	- 2. 로그인 필요

    def get_queryset(self):
    - 3. 어떤 데이터를 보여줄지 결정

        user = self.request.user
        qs = Analysis.objects.filter(user=user).order_by("-created_at")

        period = self.request.query_params.get("period")

        if period == "DAILY":
            start, end = get_daily_range()
            qs = qs.filter(period_start=start, period_end=end)

        elif period == "LAST_DAY":
            start, end = get_last_day_range()
            qs = qs.filter(period_start=start, period_end=end)

        .
        .
        .

        return qs
생성 (APIView)
- 1. 단일 POST 기능이므로 APIView 사용
class AnalysisCreateView(APIView):
    permission_classes = [IsAuthenticated]

    - 2. 생성 요청 처리
    def post(self, request):

    - 3. 클라이언트가 보낸 정보 읽기.
		user = request.user
        analysis_type = request.data.get("type")
        about = request.data.get("about", "TOTAL_SPENDING")
        description = request.data.get("description", "")


        # 기간 계산
        if analysis_type == "DAILY":
            start_date, end_date = get_daily_range()
        elif analysis_type == "LAST_DAY":
            start_date, end_date = get_last_day_range()
        elif analysis_type == "WEEKLY":
            start_date, end_date = get_week_range()
        elif analysis_type == "LAST_WEEK":
            start_date, end_date = get_last_week_range()
        elif analysis_type == "MONTHLY":
            start_date, end_date = get_month_range()
        elif analysis_type == "LAST_MONTH":
            start_date, end_date = get_last_month_range()
        elif analysis_type == "YEARLY":
            start_date, end_date = get_year_range()
        elif analysis_type == "LAST_YEAR":
            start_date, end_date = get_last_year_range()
        else:
            return Response({"error": "Invalid type"}, status=400)

		- 4. 분석기 생성
        analyzer = Analyzer(
            user=user,
            about=about,
            period_type=analysis_type,
            start_date=start_date,
            end_date=end_date,
            description=description,
        )

        result = analyzer.run()

        - 5. 생성된 분석 결과를 JSON으로 반환
        return Response({
            "id": result.id,
            "type": result.type,
            "about": result.about,
            "period_start": result.period_start,
            "period_end": result.period_end,
            "image_url": result.result_image.url if result.result_image else None,
        })
urls.py
urlpatterns = [
    # API
    path("api/", AnalysisListView.as_view(), name="analysis_list"),
    - 1. GET /analysis/api/

    path("api/create/", AnalysisCreateView.as_view(), name="analysis_create"),
	- 2. POST /analysis/api/create/

    # 템플릿용 HTML 페이지.
    path("html/", analysis_list_html, name="analysis_html"),
    path("html/create/", analysis_create_html, name="analysis_create_html"),
]
analyzers.py
import matplotlib
matplotlib.use("Agg")
Agg
- 서버 환경에서 그래프를 화면에 띄우지 않고 이미지 파일로 생성만 하기 위해 사용하는 필수 설정
- 웹 서버(Uvicorn, Gunicorn 등)에서는 GUI가 없어서 Agg 백엔드를 지정해야 오류가 안 남
import / from
import os
import uuid
import pandas as pd
import matplotlib.pyplot as plt
from django.conf import settings
class Analyzer:
- 1. init : 초기 설정 = 분석 요청 시 전달되는 메타정보 저장 ⭐️
def __init__(self, user, about, period_type, start_date, end_date, description=""):
self.user = user
self.about = about
self.period_type = period_type
self.start_date = start_date
self.end_date = end_date
self.description = description
- 2. MEDIA_ROOT/analysis/유저ID/ 경로에 저장.
self.output_dir = os.path.join(settings.MEDIA_ROOT, "analysis", str(user.id))
- 2-1. 각 사용자별 폴더를 자동 생성
os.makedirs(self.output_dir, exist_ok=True)
- 3. DB에서 해당 기간 데이터 조회 ⭐️
def get_transactions(self):
from transactions.models import Transaction
qs = Transaction.objects.filter(
user=self.user,
transacted_at__date__gte=self.start_date,
transacted_at__date__lte=self.end_date,
).values("transacted_at", "amount", "type", "category")
- 4. .values() 를 사용해 QuerySet → 단순 dict 리스트로 가져옴
- 4-1. pandas가 바로 DataFrame으로 변환 가능하게 하기 위함
return pd.DataFrame(qs)
- 5. DataFrame 형태로 바로 분석할 수 있게 반환
- 6. 날짜 변환 처리 ⭐️
def build_dataframe(self):
df = self.get_transactions()
if df.empty:
return df
- 7. 날짜 비교 & 그래프 등을 위해 datetime 타입으로 변환.
df["transacted_at"] = pd.to_datetime(df["transacted_at"])
return df
- 7. 수입/지출/차액 계산 ⭐️
def calculate_totals(self, df):
- 8. type이 “deposit”(입금)인 row들의 amount 합
total_income = df[df["type"] == "deposit"]["amount"].sum()
- 9. type이 “withdraw”(출금)인 row들의 amount 합
total_spending = df[df["type"] == "withdraw"]["amount"].sum()
- 10. 차액 계산 = 수입 - 지출
difference = total_income - total_spending
return total_income, total_spending, difference
- 11. 새 그래프: 수입 vs 지출 비교 ⭐️⭐️
def build_plot(self, total_income, total_spending):
- 12. 그래프 크기 설정
plt.figure(figsize=(6, 4))
labels = ["Income", "Spending"]
values = [total_income, total_spending]
- 13. 단순 바(bar) 그래프 형태 / 수입은 초록, 지출은 빨강
plt.bar(labels, values, color=["green", "red"])
- 14. 제목, y축 표시, 여백 자동 조정.
plt.title("Income vs Spending")
plt.ylabel("Amount")
plt.tight_layout()
15. 그래프 이미지로 저장 ⭐️
def save_plot_as_image(self):
- 16. uuid4()를 사용하여 충돌 없는 파일 이름 생성
filename = f"{uuid.uuid4()}.png"
filepath = os.path.join(self.output_dir, filename)
- 17. 이미지 파일로 저장 / 메모리에서 그래프 객체 제거
plt.savefig(filepath)
plt.close()
return f"analysis/{self.user.id}/{filename}"
- 18. Analysis 모델 생성(DB 저장)
def save_analysis_model(self, image_path, total_income, total_spending, difference):
from .models import Analysis
analysis = Analysis.objects.create(
user=self.user,
about=self.about,
type=self.period_type,
period_start=self.start_date,
period_end=self.end_date,
description=self.description,
result_image=image_path,
total_income=total_income,
total_spending=total_spending,
difference=difference,
)
return analysis
- 19. 전체 프로세스를 순서대로 진행 ⭐️⭐️⭐️
def run(self):
df = self.build_dataframe()
if df.empty:
raise ValueError("해당 기간에 분석 가능한 거래가 없습니다.")
# 수입/지출/차액 계산
total_income, total_spending, difference = self.calculate_totals(df)
# 그래프 생성
self.build_plot(total_income, total_spending)
# 그래프 저장
image_path = self.save_plot_as_image()
# 모델 저장 (수치 포함)
return self.save_analysis_model(image_path, total_income, total_spending, difference)
전체 흐름 정리
run()
 └─ build_dataframe()
      └─ get_transactions()  → DataFrame
 └─ calculate_totals()       → income/spending/difference
 └─ build_plot()             → 그래프 생성
 └─ save_plot_as_image()     → 이미지 저장, 경로 리턴
 └─ save_analysis_model()    → DB 저장
 └─ 최종 Analysis 객체 반환
새롭게 알게된 내용 ✅
어려운 내용(추가 학습 필요) ✅
오늘 발생한 문제(발생 했다면) ✅

안녕하세요.