EDA/웹 크롤링/파이썬 프로그래밍
03. Naver Movie Ranking
01. 네이버 영화 평점 사이트 분석
- 데이터 가져오기(22년 12월 31일 기준)
import pandas as pd
from urllib.request import urlopen
from bs4 import BeautifulSoup

url = "https://movie.naver.com/movie/sdb/rank/rmovie.naver?sel=cur&date=20221231"
response = urlopen(url)
# response.status 200나옴
soup = BeautifulSoup(response, "html.parser")
print(soup.prettify())- 영화 제목 전체 태그
soup.find_all("div","tit5") # = soup.select("div.tit5")- 제목 한개
# 첫 번째 방법
soup.find_all("div","tit5")[0].a.string

# 두 번째 방법
soup.select(".tit5")[0].find("a").text

# 세 번째 방법
soup.select(".tit5")[0].select_one("a").get_text()

[실행결과]
'씽2게더'
'씽2게더'
'씽2게더'- 영화 평점 전체 태그
soup.find_all("td","point")- 영화 제목 리스트
end = len(soup.find_all("div","tit5"))
movie_name = [soup.select(".tit5")[n].a.text for n in range(0,end)]- 영화 평점 리스트
end = len(soup.find_all("td","point"))
movie_point = [soup.select(".point")[n].text for n in range(0,end)]
02. 자동화를 위한 코드
- 날짜만 변경하면 내가 원하는 기간만큼 데이터를 얻을 수 있다
- 2021-01-01부터 100일간
date = pd.date_range("2021.01.01", periods=100, freq="D") # D는 하루 기준으로 날짜 만듦-
100일간의 데이터 수집
- time sleep을 걸어줘서 사람처럼 보이게 해준다
- tqdm, tqdmnotebook을 쓰면 현재 진행상황을 보여준다
- 데이터 개수 : 총 4793개
import time
from tqdm import tqdm

movie_date = []
movie_name = []
movie_point = []

for today in tqdm(date):
    url = "https://movie.naver.com/movie/sdb/rank/rmovie.naver?sel=cur&date={date}"
    response = urlopen(url.format(date=today.strftime("%Y%m%d")))
    soup = BeautifulSoup(response, "html.parser")

    end = len(soup.find_all("td","point"))

    movie_date.extend([today for _ in range(0,end)]) # n자리 변수 사용 안할땐 이렇게 표시
    movie_name.extend([soup.find_all("div","tit5")[n].a.text for n in range(0,end)])
    movie_point.extend([soup.find_all("td","point")[n].text for n in range(0,end)])

time.sleep(0.5) # 이걸 안해주면 엄청난 속도로 정보를 불러오게 되고 네이버에서 차단당할수도 있음- DataFrame 만들고 info 확인
movie = pd.DataFrame({
    "date": movie_date,
    "title": movie_name,
    "point": movie_point
})
movie.info()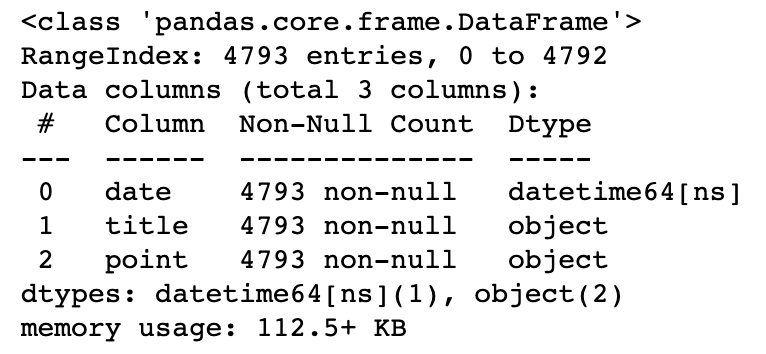
- point를 산술 가능하게 float형으로 변환
movie["point"] = movie["point"].astype(float)03. 영화 평점 데이터 정리
- 영화 이름으로 인덱스를 잡는다
- 점수의 합산을 구한다
- 100일간 네이버 영화 평점 합산 기준 베스트 & 워스트 10 선정- pivot table
import numpy as np
import pandas as pd

# pivot table
movie_unique = pd.pivot_table(data=movie, index="title", aggfunc=np.sum)- 화양연화 평점추이 시각화
movie_best = movie_unique.sort_values(by="point",ascending=False) # 내림차순

tmp = movie.query("title == ['화양연화']")

# 시각화
import matplotlib.pyplot as plt
from matplotlib import rc

rc("font", family="Arial Unicode MS")
%matplotlib inline

plt. figure(figsize=(20,8))
plt.plot(tmp["date"],tmp["point"]) # 선 그래프 x축 날짜, y축 평점 => 날짜에 따른 평점 변화를 선그래프로 표현
plt.title("날짜별 평점")
plt.xlabel("날짜")
plt.ylabel("평점")
plt.xticks(rotation="vertical")
plt.legend(labels=["평점 추이"], loc="best")
plt.grid(True)
plt.show()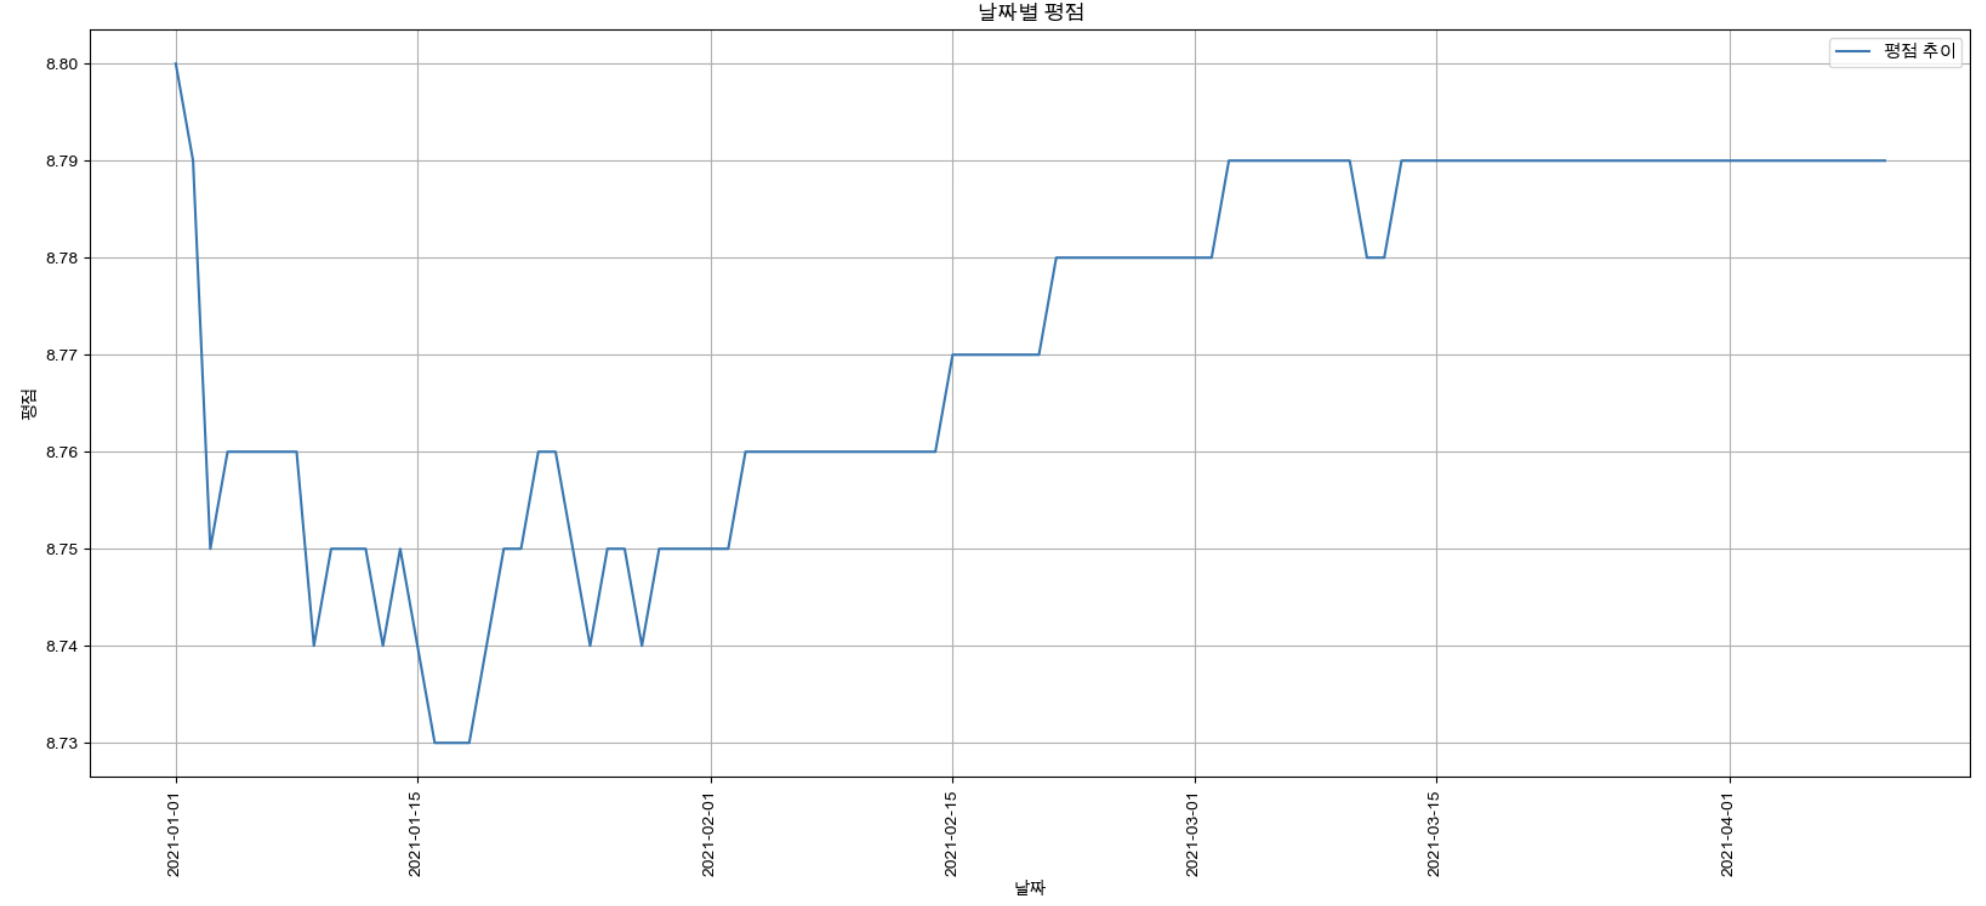
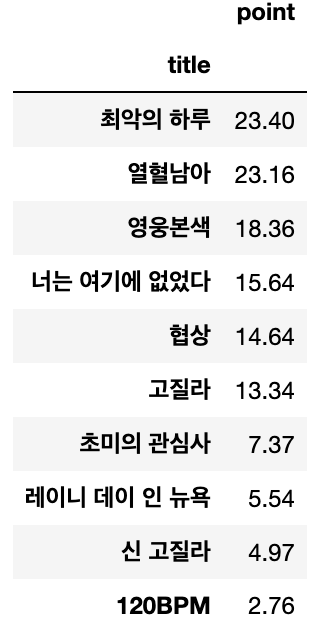
- 상위 10개, 하위 10개
# 상위 10개 영화
movie_best.head(10)

# 하위 10개 데이터
movie_best.tail(10)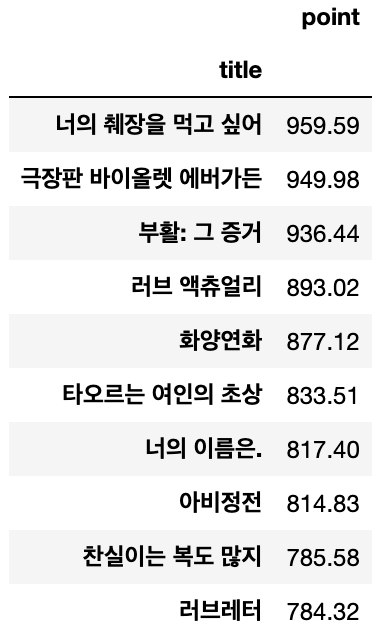
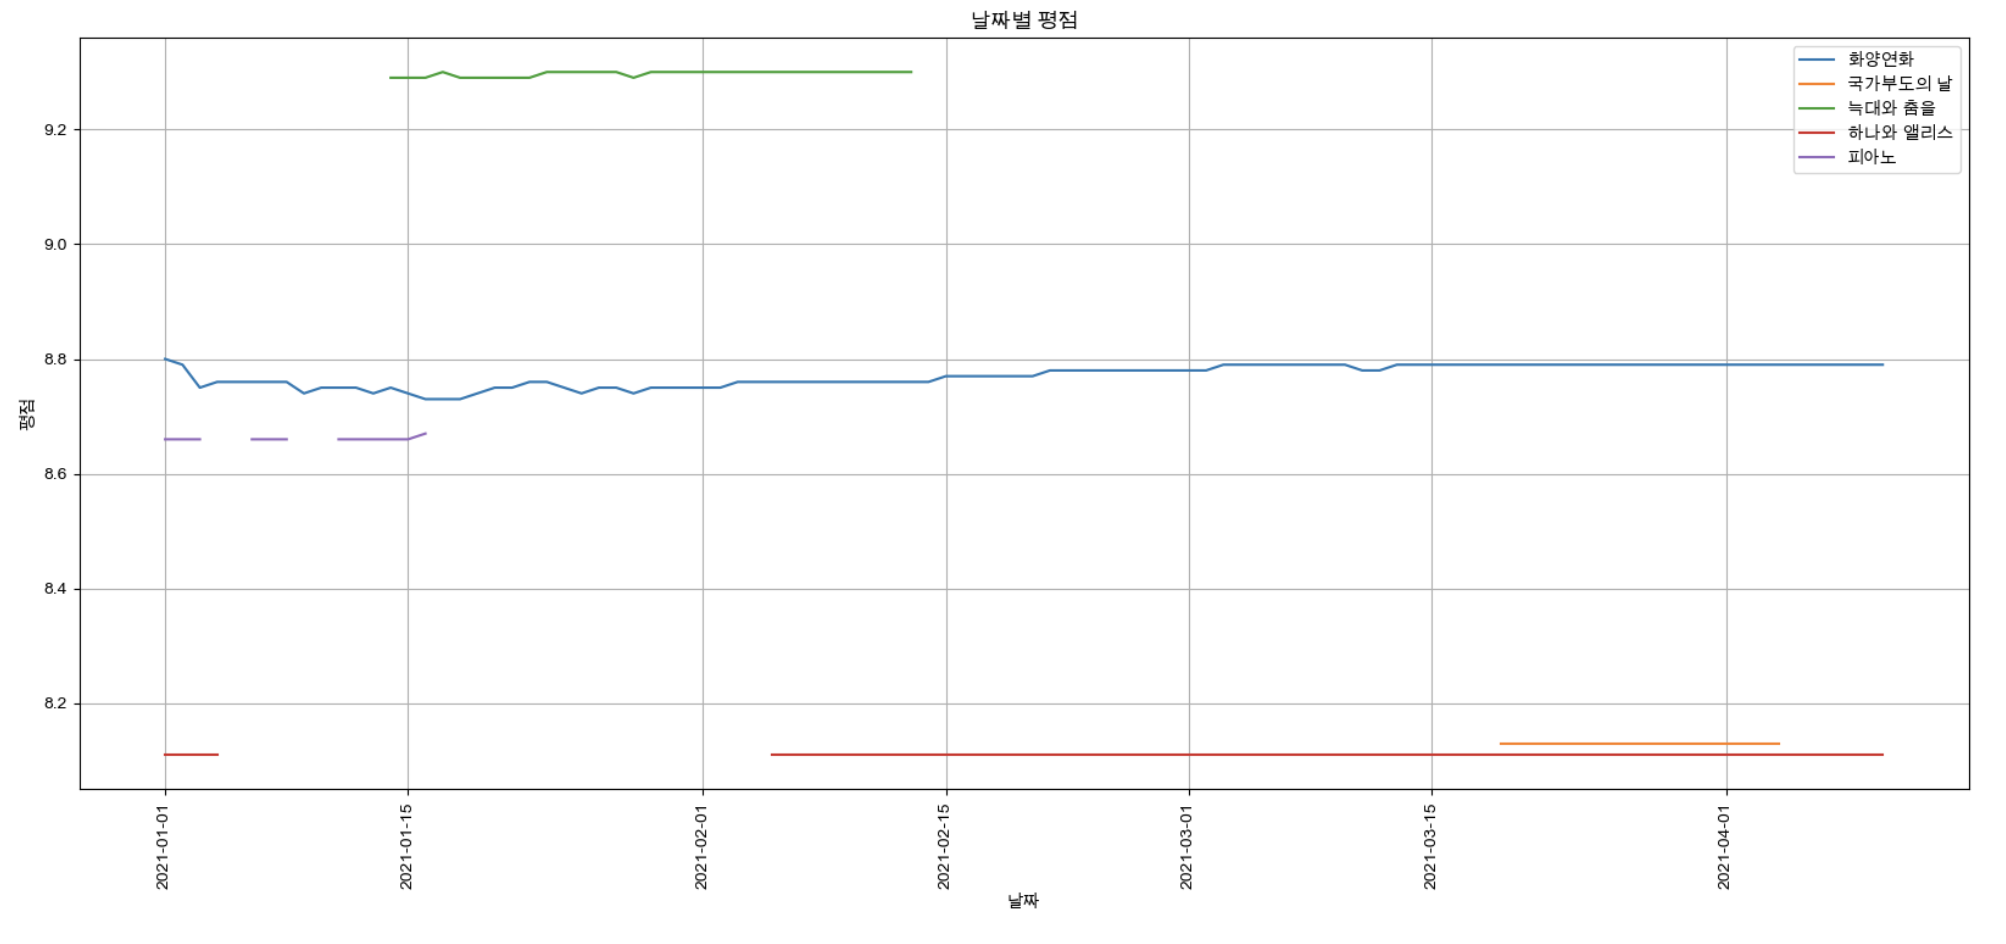
- pivot table 만들고 5개 영화 선정 후 날짜별 평점 시각화
# pivot
movie_pivot = pd.pivot_table(data=movie, index="date", columns="title", values="point")

# 한글설정
import platform
import seaborn as sns
from matplotlib import font_manager, rc

path = "C:/Windows/Fonts/malgun.ttf"

if platform.system() == "Darwin":
    rc("font", family="Arial Unicode MS")
elif platform.system() == "Windows":
    font_name = font_manager.FontProperties(fname=path).get_name()
    rc("font", family=font_name)
else:
    print("Unkown system. sorry")

# 시각화
target_col = ["화양연화", "국가부도의 날","늑대와 춤을","하나와 앨리스","피아노"]
plt.figure(figsize=(20,8))
plt.title("날짜별 평점")
plt.xlabel("날짜")
plt.ylabel("평점")
plt.xticks(rotation="vertical")
plt.tick_params(bottom="off", labelbottom="off")
plt.plot(movie_pivot[target_col])
plt.legend(target_col, loc="best")
plt.grid(True)
plt.show()