의료 영상: 파이썬을 이용한 3D MRI 뇌 스캔의 시각화 연습
00. 개요
딥러닝/머신러닝을 이용한 의료 영상 분석에 대한 역량을 쌓기 위해 자료를 조사하던 중, 뇌 스캔 영상 파일(Nii)를 불러와 레이어 별 스캔의 가시화 및 레이블 별 가시화에 대한 영상 자료가 있어 이를 공부하고자 합니다.
해당 공부 영상의 출처는 다음과 같습니다!
Neuroimaging: Visualize 3D MRI Brain Scans with Python
01. Import all modules and packages
Data visualization을 위해 설치한 모듈과 패키지는 다음과 같습니다.
import numpy as np
import nibabel as nib   # 의료 및 뇌 영상 파일 형식에 대한 읽기/쓰기를 위한 모듈

import itk              # 2D 및 3D 이미지 시각화 라이브러리
import itkwidgets
from ipywidgets import interact, interactive, IntSlider, ToggleButtons
import matplotlib.pyplot as plt

%matplotlib inline
import seaborn as sns   # Matplotlib를 기반으로 하는 파이썬 데이터 시각화 라이브러리
sns.set_style('darkgrid')
02. 3D MRI data source
뇌 스캔 영상 샘플은 Decathlon 에서 받을 수 있습니다.
# 영상 데이터 경로 정의 및 데이터를 로드합니다.
image_path = "./data/images/BRATS_001.nii.gz"
image_obj = nib.load(image_path)

type(image_obj)
로드된 파일의 타입을 확인해보면 다음과 같이 나옵니다.
nibabel.nifti1.Nifti1Image01) 3D MRI data -> Numpy array
뇌 스캔 데이터의 정보를 불러들이기 위해 nii이미지를 ndarray로 데이터 추출합니다.
image_data = image_obj.get_fdata()

type(image_data)
image_data.shape
추출된 데이터의 정보는 (240,240,155,4)로 155개의 레이어와 4개의 채널을 가진 (240*240)크기의 데이터 임을 알 수 있습니다.
데이터의 정보를 출력하면 다음과 같습니다.
height, width, depth, channels = image_data.shape

print(f'Dimensions of image data are:\n|height={height}\n|width={width}\n|depth={depth}\n|channels={channels}')
Dimensions of image data are:
|height=240
|width=240
|depth=155
|channels=4
02-1) Visualize the data
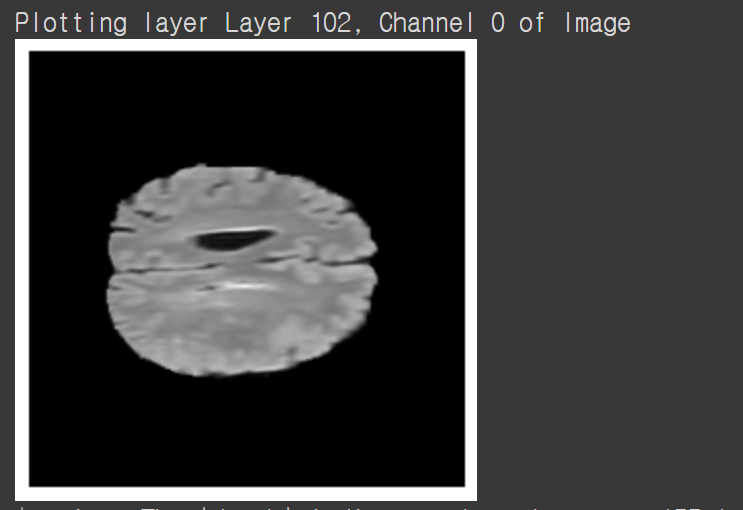
레이어의 수가 155개 이므로 레이어의 최대값 maxval = 154로 설정 한 뒤, (0,154)사이의 임의의 값을 출력하도록 설정합니다.
# 임의의 레이어 번호를 지정합니다.
maxval = 154    # including depth
i = np.random.randint(0, maxval)

# 확인할 채널을 지정합니다.
channel = 0

print(f'Plotting layer Layer {i}, Channel {channel} of Image')
plt.imshow(image_data[:,:,i,channel],cmap='gray')
plt.axis('off')
plt.show()
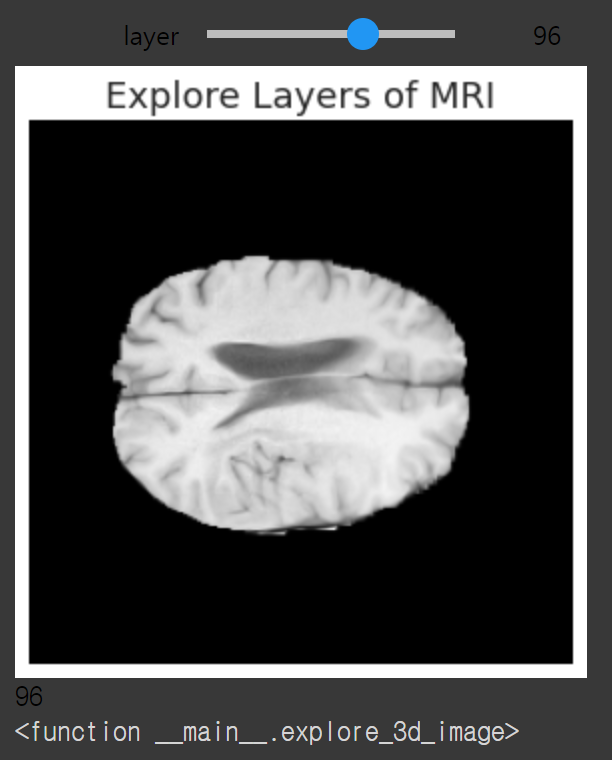
02-2) Exploration
ipwidget의 interact() 함수를 사용하여 데이터 세트를 레이어 별로 탐색할 수 있습니다.
# 데이터를 시각화하는 함수를 정의합니다.
def explore_3d_image(layer):
    plt.figure(figsize=(10,5))
    channel = 1
    plt.imshow(image_data[:,:,layer,channel],cmap='gray')
    plt.title('Explore Layers of MRI', family = 'Arial', fontsize=18)
    plt.axis('off')
    plt.show()
    return layer

# Run the ipywidgets interact() function to explore the data
interact(explore_3d_image, layer=(0, image_data.shape[2]-1))
nibabel 이외에도
다음 시간에는 Visualize 3D MRI Data labels에 대한 공부를 한 뒤 정리하겠습니다!

Beyond the new era.
도움 됐습니다! 감사해요