
데이터 분석이란?
- 데이터 분석 순서
주제 선정
↓
데이터 구조 파악
↓
데이터 전처리
↓
데이터 분석
- 데이터 분석이란?
데이터 분석은 주어진 자료를 가공하여 원하는 정보와 결론을 얻어내는 일련의 처리 과정을 의미
데이터 분석은 보통 아래의 단계로 이루어진다
- 주제 선정
- 데이터 구조 파악
- 데이터 전처리
- 데이터 분석 구현
- 주제 선정
어떤 데이터를 선정할 지, 데이터에서 어떤 가설을 세우고 분석을 시작할 지, 어떤 결론을 원하는 지 등 데이터 분석의 목적을 세운다
- 데이터 구조 파악
데이터를 분석하기 위해서, 데이터가 저장된 형태와 자료형, 변수 이름 등을 미리 파악해야 한다.
또는 데이터 프레임이 통계량 함수를 적용하여, 데이터의 분포도나 성향등을 파악할 수 있다.
- 데이터 전처리
데이터를 분석하기 전, 필요한 변수만을 추출하거나 기존의 변수로 새로운 변수를 계산하여 만들기도 한다
- 데이터 분석
주제 선정 단계에서 세운 가설을 numpy, pandas 등으로 데이터를 연산, 가공하여 가설을 입증하거나 원하는 정보를 얻어내는 것을 구현 하는 단계
얻어낸 정보를 효관저긍로 보여주기 위해 시각화를 하기도함
실습. 월드컵 매치 데이터 분석
1. 역대 월드컵의 관중 수 출력하기
WorldCups.csv에 역대 월드컵 대회의 기록이 담겨있다
역대 월드컵 대회들의 총 관중을 데이터 프레임으로 출력
- WoldCups.csv파일을 pandas의 DataFrame으로 저장
- 만든 데이터 프레임의 칼럼 중 Year와 Attendance 칼럼만 추출하여 출력
- 역대 월드컵의 관중 수가 제대로 출력되었는지 확인하고 제출
import pandas as pd
import numpy as np
import matplotlib.pyplot as plt
from elice_utils import EliceUtils
elice_utils = EliceUtils()
pd.set_option('display.max_rows', 500)
pd.set_option('display.max_columns', 500)
pd.set_option('display.width', 1000)
'''
출력 형식을 위한 스켈레톤 코드입니다.
아래 줄 부터 문제에 맞는 코드를 작성해주세요.
'''
word_cups = pd.read_csv("WorldCups.csv")
word_cups = word_cups[['Year','Attendance']]
print(word_cups)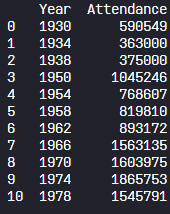
2. 역대 월드컵의 관중 수 출력하기[그래프]
WorldCups.csv에 역대 월드컵 대회의 기록이 담겨있다
- 변수 world_cups에 WorldCups.csv를 데이터 프레임으로 저장
- world_cups를 이용하여 역대 월드컵의 평균 관중 수를 그래프로 출력
import pandas as pd
import numpy as np
import matplotlib.pyplot as plt
from elice_utils import EliceUtils
elice_utils = EliceUtils()
pd.set_option('display.max_rows', 500)
pd.set_option('display.max_columns', 500)
pd.set_option('display.width', 1000)
'''
출력 형식을 위한 스켈레톤 코드입니다.
아래 줄 부터 문제에 맞는 코드를 작성해주세요.
'''
world_cups = pd.read_csv("WorldCups.csv")

world_cups = world_cups[['Year', 'Attendance']]
print(world_cups)

plt.plot(world_cups['Year'], world_cups['Attendance'], marker='o', color='black')

plt.savefig("image.svg", format="svg")
elice_utils.send_image("image.svg")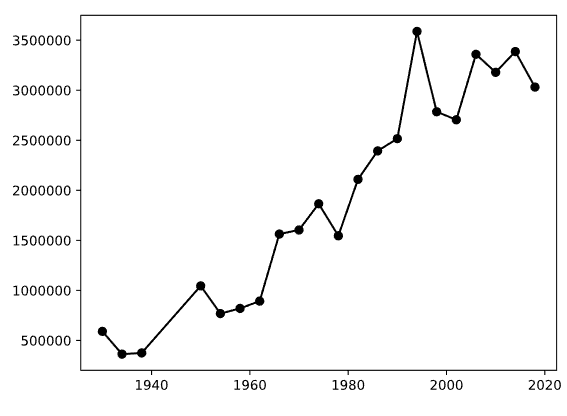
3. 역대 월드컵의 경기당 득점 수
월드컵 대회들의 연도, 경기 수, 득점 수, 경기당 득점 수를 출력
- WorldCups.csv파일을 pandas의 DataFrame으로 저장
- 만든 데이터 프레임의 칼럼 중 Year 와 GoalsScored, MatchesPlayed 칼럼만 추출
- 데이터 프레임에 경기당 득점 수를 의미하는 새로운 칼럼 GoalsPerMatch를 추가
- 데이터 프레임을 출력하여 칼럼이 제대로 추가되었나 확인하고 제출
import pandas as pd
import numpy as np
import matplotlib.pyplot as plt
from elice_utils import EliceUtils
elice_utils = EliceUtils()
pd.set_option('display.max_rows', 500)
pd.set_option('display.max_columns', 500)
pd.set_option('display.width', 1000)
'''
출력 형식을 위한 스켈레톤 코드입니다.
아래 줄 부터 문제에 맞는 코드를 작성해주세요.
'''
word_cups = pd.read_csv("WorldCups.csv")
word_cups = word_cups[['Year','GoalsScored','MatchesPlayed']]

word_cups['GoalsPerMatch'] = word_cups['GoalsScored'] / word_cups['MatchesPlayed']

print(word_cups)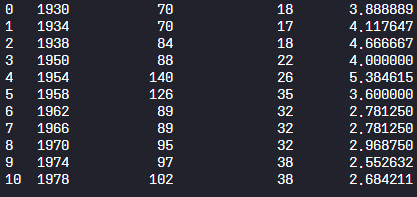
4. 역대 월드컵의 경기당 득점 수[그래프]
위에 저장된 데이터 프레임을 이용하여 역대 월드컵의 경기 수와 득점 수를 그래프로 출력
import pandas as pd
import numpy as np
import matplotlib.pyplot as plt
from elice_utils import EliceUtils
elice_utils = EliceUtils()
pd.set_option('display.max_rows', 500)
pd.set_option('display.max_columns', 500)
pd.set_option('display.width', 1000)
world_cups = pd.read_csv("WorldCups.csv")
'''
출력 형식을 위한 스켈레톤 코드입니다.
아래 줄 부터 문제에 맞는 코드를 작성해주세요.
'''

world_cups = world_cups[['Year', 'GoalsScored', 'MatchesPlayed']]
world_cups["GoalsPerMatch"] = world_cups["GoalsScored"] / world_cups["MatchesPlayed"]


# 첫 번째 그래프 출력
fig, axes = plt.subplots(2, 1, figsize=(4,8))

axes[0].bar(x=world_cups['Year'], height=world_cups['GoalsScored'], color='grey', label='goals')

axes[0].plot(world_cups['Year'], world_cups['MatchesPlayed'], marker='o', color='blue', label='matches')

axes[0].legend(loc='upper left')


# 두 번째 그래프 출력
axes[1].grid(True)
axes[1].plot(world_cups['Year'], world_cups['GoalsPerMatch'], marker='o', color='red', label='goals_per_matches')

axes[1].legend(loc='lower left')

plt.savefig("image.svg", format="svg")
elice_utils.send_image("image.svg")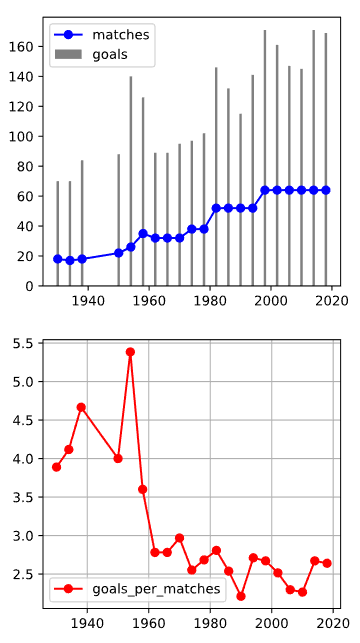
5. 월드컵 매치 데이터 전처리
WorldCupMatches.csv 파일에는 일부 이상값이 있기 때문에 전처리를 하여라
- 데이터 전처리를 위해 데이터 프레임의 일부 값을 replace 함수를 사용해 교체
- dupli = world_cups_matches.duplicated()
print(len(dupli[dupli==True]))
위 코드로 데이터 프레임에 중복된 데이터가 얼마나 있는지 확인,
확인 결과 중복된 데이터가 16개 있으므로
world_cups_matches = world_cups_matches.drop_duplicates()
로 중복값을 제거
import pandas as pd
import numpy as np
pd.set_option('display.max_rows', 500)
pd.set_option('display.max_columns', 500)
pd.set_option('display.width', 1000)
'''
출력 형식을 위한 스켈레톤 코드입니다.
아래 줄 부터 문제에 맞는 코드를 작성해주세요.
'''
world_cups_matches = pd.read_csv("WorldCupMatches.csv")
world_cups_matches = world_cups_matches.replace('Germany FR', 'Germany')
world_cups_matches = world_cups_matches.replace('C�te d\'Ivoire', 'Côte d\'Ivoire')
world_cups_matches = world_cups_matches.replace('rn”>Bosnia and Herzegovina', 'Bosnia and Herzegovina')
world_cups_matches = world_cups_matches.replace('rn”>Serbia and Montenegro', 'Serbia and Montenegro')
world_cups_matches = world_cups_matches.replace('rn”>Trinidad and Tobago', 'Trinidad and Tobago')
world_cups_matches = world_cups_matches.replace('rn”>United Arab Emirates', 'United Arab Emirates')
world_cups_matches = world_cups_matches.replace('Soviet Union', 'Russia')

dupli = world_cups_matches.duplicated()

world_cups_matches = world_cups_matches.drop_duplicates()
6. 국가별 득점 수 구하기
역대 월드컵 경기를 통틀어 가장 많은 골을 넣은 국가는 어디였는지 출력
WorldCupMatches.csv 파일에 역대 월드컵 경기의 기록이 담겨 있다
각 국가들이 기록한 득점 수를 내림차순으로 정렬한 결과를 출력
- 이전에 전처리한 WorldCupMatches.csv파일이 주어진다
- 전처리를 거친 데이터 프레임에서 홈 팀 득점을 나타내는 home 데이터 프레임과, 어웨이 팀 득점을 나타내는 away 데이터 프레임을 각각 만들어보고자 합니다.
Home Team Name으로 그룹을 묶고, Home Team Goals 칼럼을 추출하여 home에 저장합니다.
Away Team Name으로 그룹을 묶고, Away Team Goals 칼럼을 추출하여 away에 저장합니다.
import pandas as pd
import numpy as np
import matplotlib.pyplot as plt
from elice_utils import EliceUtils
elice_utils = EliceUtils()
import preprocess
pd.set_option('display.max_rows', 500)
pd.set_option('display.max_columns', 500)
pd.set_option('display.width', 1000)
'''
출력 형식을 위한 스켈레톤 코드입니다.
아래 줄 부터 문제에 맞는 코드를 작성해주세요.
'''
world_cups_matches = pd.read_csv("WorldCupMatches.csv")
world_cups_matches = preprocess.world_cups_matches

home = world_cups_matches.groupby(['Home Team Name'])['Home Team Goals'].sum()
away = world_cups_matches.groupby(['Away Team Name'])['Away Team Goals'].sum()

goal_per_country = pd.concat([home, away], axis=1, sort=True).fillna(0)

goal_per_country["Goals"] = goal_per_country["Home Team Goals"] + goal_per_country["Away Team Goals"]

goal_per_country = goal_per_country["Goals"].sort_values(ascending = False)

goal_per_country = goal_per_country.astype(int)
print(goal_per_country)
7. 국가별 득점 수 구하기[그래프]
월드컵 국가별 득점 수를 그래프로 상위 10개 국가만 출력
import pandas as pd
import numpy as np
import matplotlib.pyplot as plt
import preprocess
from elice_utils import EliceUtils
elice_utils = EliceUtils()
pd.set_option('display.max_rows', 500)
pd.set_option('display.max_columns', 500)
pd.set_option('display.width', 1000)
'''
출력 형식을 위한 스켈레톤 코드입니다.
아래 줄 부터 문제에 맞는 코드를 작성해주세요.
'''

goal_per_country = preprocess.goal_per_country
goal_per_country = goal_per_country[:10]

# x, y값 저장
x = goal_per_country.index
y = goal_per_country.values

#그래프 그리기
fig, ax = plt.subplots()

ax.bar(x, y, width = 0.5)

# x축 항목 이름 지정, 30도 회전
plt.xticks(x, rotation=30)
plt.tight_layout()

#그래프 출력
plt.savefig("image.svg", format="svg")
elice_utils.send_image("image.svg")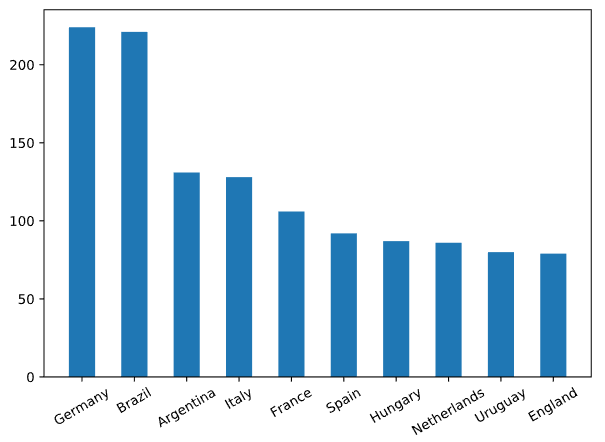
8. 2014 월드컵 다득점 국가 순위
2014 브라질 월드컵에서 각 국가가 기록한 득점 수를 내림차순으로 정렬하여 출력
- 잔처리 작업이 된 world_cups_matches
- 이 데이터 프레임에서 마스킹 연산을 이용하여 Year가 2014인 것들을 추출하세요
- 2014년 월드컵 경기 데이터 중에서 홈 팀의 골 수와 원정 팀의 골 수를 각각 계산하려고 한다.
데이터가 저장된 형태로 인해 홈 팀 데이터와 원정 팀 데이터를 각각 구한 뒤 합쳐주어야 합니다.
Home Team Name을 그룹으로 묶어 Home Team Goals의 합계를 구하고 home_team_goal 변수에 저장한다.
Away Team Name을 그룹으로 묶어 Away Team Goals의 합계를 구하고 away_team_goal 변수에 저장한다.- 홈 득점 수와 원정 득점 수를 하나의 데이터로 합치겠습니다.
이 때, 결측값을 없애기 위해 fillna 함수를 적용합니다.
결측값이 존재한다는 것은, 골을 넣지 못했다는 의미이므로 0으로 대체합니다.- 홈 팀 골과 원정 팀 골 수를 합한 새로운 칼럼 goals를 만들고, 기존 칼럼은 drop 함수를 이용해 삭제합니다.
- 저장된 값을 정수로 변환합니다.
- 데이터 프레임을 내림차순으로 정렬하고, 올바른 값이 출력되는지 확인합니다.
import pandas as pd
import numpy as np
import matplotlib.pyplot as plt
from elice_utils import EliceUtils
elice_utils = EliceUtils()
import preprocess
pd.set_option('display.max_rows', 500)
pd.set_option('display.max_columns', 500)
pd.set_option('display.width', 1000)
'''
출력 형식을 위한 스켈레톤 코드입니다.
아래 줄 부터 문제에 맞는 코드를 작성해주세요.
'''
world_cups_matches = pd.read_csv("WorldCupMatches.csv")
world_cups_matches = preprocess.world_cups_matches

world_cups_matches = world_cups_matches[world_cups_matches['Year']==2014]

home_team_goal = world_cups_matches.groupby(['Home Team Name'])['Home Team Goals'].sum()
away_team_goal = world_cups_matches.groupby(['Away Team Name'])['Away Team Goals'].sum()

team_goal_2014 = pd.concat([home_team_goal, away_team_goal], axis=1).fillna(0)

team_goal_2014['goals'] = team_goal_2014['Home Team Goals'] + team_goal_2014['Away Team Goals']
team_goal_2014 = team_goal_2014.drop(['Home Team Goals', 'Away Team Goals'], axis=1)

team_goal_2014.astype('int')

team_goal_2014 = team_goal_2014['goals'].sort_values(ascending=False)
print(team_goal_2014)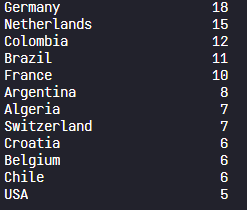
9. 2014 월드컵 다득점 국가 순위[그래프]
WroldCupMatches.csv에 역대 월드컵 경기에 대한 데이터가 담겨 있다
변수 world_cups_matches에 WorldCupMatches.csv를 데이터 프레임으로 저장하였는데, 이를 이용하여 국가별 득점 수를 그래프로 그려보아라
import matplotlib.pyplot as plt
from elice_utils import EliceUtils
import preprocess
elice_utils = EliceUtils()
team_goal_2014 = preprocess.team_goal_2014
'''
출력 형식을 위한 스켈레톤 코드입니다.
아래 줄 부터 문제에 맞는 코드를 작성해주세요.
'''
team_goal_2014.plot(x=team_goal_2014.index, y=team_goal_2014.values, kind="bar", figsize=(12, 12), fontsize=14)

# 주석 표시한 코드는 matplotlib의 pyplot객체로 그래프를 그린 코드
# fig, ax = plt.subplots()
# ax.bar(team_goal_2014.index, team_goal_2014.values)
# plt.xticks(rotation = 90)
# plt.tight_layout()

plt.savefig("image.svg", format="svg")
elice_utils.send_image("image.svg")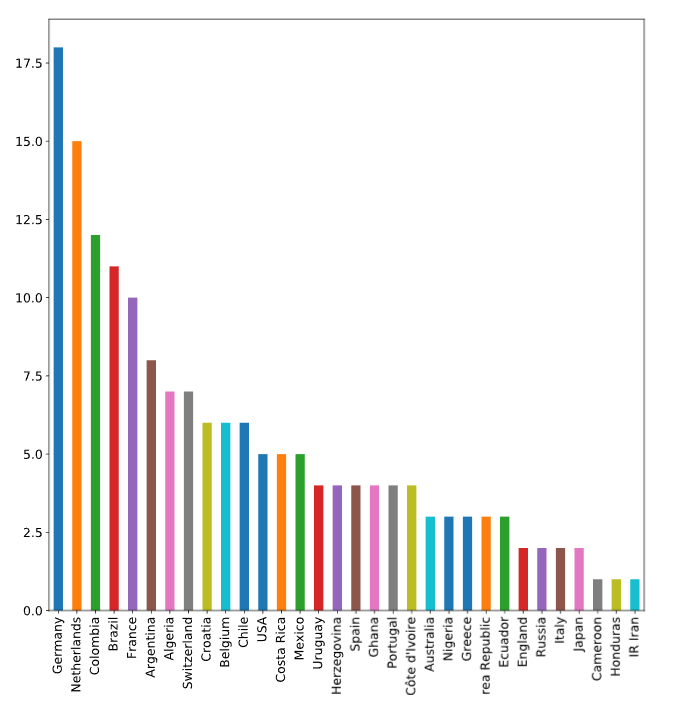
10. 월드컵 4강 이상 성적 집계하기
WorldCupMatches.csv 파일에 역대 월드컵 경기의 기록이 담겨 있다
각 국가들의 4강이상 월드컵 성적을 집계하여 출력
- WorldCups.csv 을 데이터 프레임으로 만든 변수 world_cups가 주어졌다
데이터 프레임에서 역대 대회 1위 국가, 2위 국가, 3위 국가, 4위 국가를 추출하여 각각 변수 winner, runners_up, third, fourth에 저장한다.- value_counts 함수를 이용해 각 시리즈 데이터에 저장된 값을 세어주고 저장한다.
이 작업을 거치면, 국가별 1위, 2위, 3위, 4위 횟수가 각각 저장된 데이터가 만들어진다- 위 데이터들을 하나의 데이터 프레임으로 합친다.
- ranks에 들어있는 값이 NaN이라면, 해당 순위를 기록한 적이 없다는 의미입니다.
따라서 데이터의 결측값을 0으로 채우고, dtype을 int64로 다시 설정합니다.- 각 국가들을 우승 횟수, 준우승 횟수, 3위 횟수, 4위 횟수 순서대로 내림차순 정렬하세요.
- 데이터 프레임이 올바르게 저장되었는지 확인해보고 출력하여 제출하세요.
import pandas as pd
import numpy as np
import matplotlib.pyplot as plt
from elice_utils import EliceUtils
elice_utils = EliceUtils()
pd.set_option('display.max_rows', 500)
pd.set_option('display.max_columns', 500)
pd.set_option('display.width', 1000)

'''
출력 형식을 위한 스켈레톤 코드입니다.
아래 줄 부터 문제에 맞는 코드를 작성해주세요.
'''

world_cups = pd.read_csv("WorldCups.csv")
winner = world_cups["Winner"]
runners_up = world_cups["Runners-Up"]
third = world_cups["Third"]
fourth = world_cups["Fourth"]

winner_count = pd.Series(winner.value_counts())
runners_up_count = pd.Series(runners_up.value_counts())
third_count = pd.Series(third.value_counts())
fourth_count = pd.Series(fourth.value_counts())

ranks = pd.DataFrame({
  "Winner" : winner_count,
  "Runners_Up" : runners_up_count,
  "Third" : third_count,
  "Fourth" : fourth_count
})

ranks = ranks.fillna(0).astype('int64')

ranks = ranks.sort_values(['Winner', 'Runners_Up', 'Third', 'Fourth'], ascending=False)
print(ranks)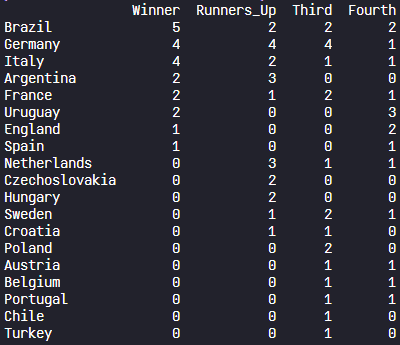
11. 월드컵 4강 이상 성적 집계하기[그래프]
WorldCups.csv에 역대 월드컵 대회에 대한 데이터가 담겨 있다.
변수 world_cups에 WorldCups.csv를 데이터 프레임으로 저장하였다.
각 국가의 월드컵 4강 이상 성적을 집계하여 그래프로 출력
import pandas as pd
import numpy as np
import matplotlib.pyplot as plt
from elice_utils import EliceUtils
elice_utils = EliceUtils()
import preprocess
pd.set_option('display.max_rows', 500)
pd.set_option('display.max_columns', 500)
pd.set_option('display.width', 1000)
ranks = preprocess.ranks
'''
출력 형식을 위한 스켈레톤 코드입니다.
아래 줄 부터 문제에 맞는 코드를 작성해주세요.
'''

# x축에 그려질 막대그래프들의 위치입니다.
x = np.array(list(range(0, len(ranks))))

# 그래프를 그립니다.
fig, ax = plt.subplots()

# x 위치에, 항목 이름으로 ranks.index(국가명)을 붙입니다.
plt.xticks(x, ranks.index, rotation=90)
plt.tight_layout()

# 4개의 막대를 차례대로 그립니다.
ax.bar(x - 0.3, ranks['Winner'],     color = 'gold',   width = 0.2, label = 'Winner')
ax.bar(x - 0.1, ranks['Runners_Up'], color = 'silver', width = 0.2, label = 'Runners_Up')
ax.bar(x + 0.1, ranks['Third'],      color = 'brown',  width = 0.2, label = 'Third')
ax.bar(x + 0.3, ranks['Fourth'],     color = 'black',  width = 0.2, label = 'Fourth')


plt.savefig("image.svg", format="svg")
elice_utils.send_image("image.svg")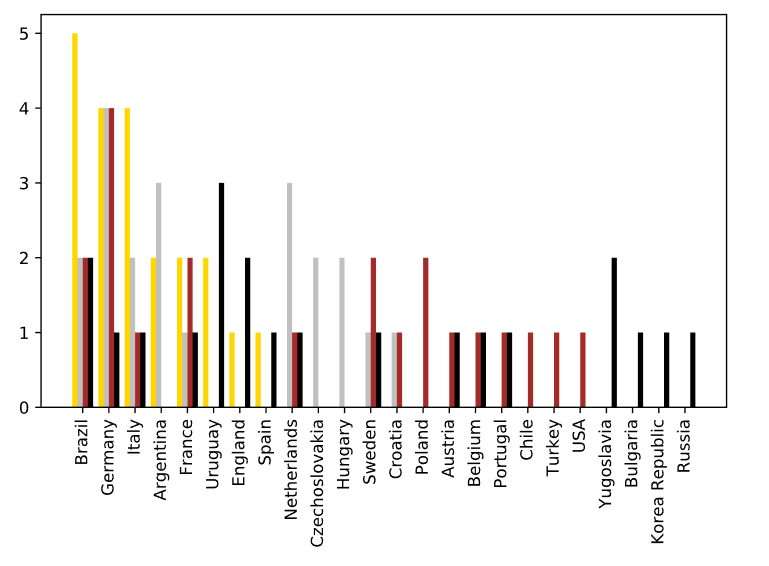

해당 csv 파일 어디서 얻었는지 알수 있을까요!!