Feature Engineering
One-Hot-Encoding
train.columns

Index(['PassengerId', 'Survived', 'Pclass', 'Name', 'Sex', 'Age', 'SibSp',
       'Parch', 'Ticket', 'Fare', 'Cabin', 'Embarked', 'Age_ffill',
       'Age_bfill', 'Age_interpolate', 'Fare_fill'],
      dtype='object')

pd.get_dummies(train[["Pclass", "sex", "Age_interpolate", "Fare_fill", "Embarked"]])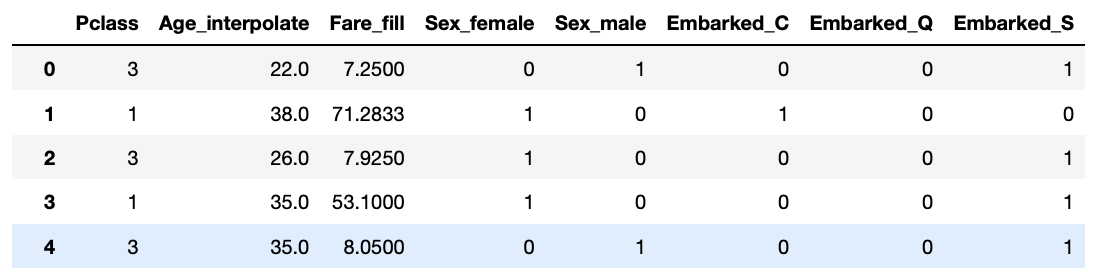
결측치 대체
# fillna(method) : {'backfill', 'bfill', 'pad', 'ffill', None}
train['Age_ffill'] = train['Age'].fillna(method='ffill')
train['Age_bfill'] = train['Age'].fillna(method='bfill')

# interpolate() : Fill NaN values using an interpolation method.
# limit_direction : {{'forward', 'backward', 'both'}}
# both 로 지정하면 위 아래 결측치를 모두 채워주고 forward, backward 는 채울 방향을 설정합니다.
train["Age_interpolate"] = train["Age"].interpolate(method="linear", limit_direction='both')

train[['Age', "Age_ffill", 'Age_bfill', "Age_interpolate"]].tail()
# test 데이터에도 똑같이 결측치 대체값 적용
test['Age_ffill'] = test['Age'].fillna(method='ffill')
test['Age_bfill'] = test['Age'].fillna(method='bfill')
test["Age_interpolate"] = test["Age"].interpolate(method="linear", limit_direction='both')

test[['Age', "Age_ffill", 'Age_bfill', "Age_interpolate"]]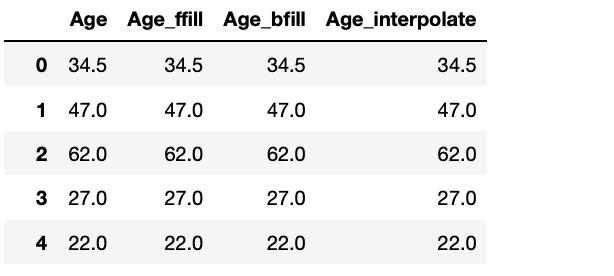
# Fare 결측치 대체
train["Fare_fill"] = train["Fare"]
test["Fare_fill"] = test["Fare"].interpolate(method="linear", limit_direction='both')
test[test["Fare"].isnull()]
학습과 예측 과정
정답값
label_name = "Survived"학습, 예측에 사용할 컬럼
feature_names = ["Pclass", "Sex", "Age_interpolate", "Fare_fill", "Embarked"]학습, 예측 데이터셋
X_train = pd.get_dummies(train[feature_names])
print(X_train.shape)
print(X_train.isnull().sum().sum())
X_train.head(2)

(891, 8)
0
	Pclass	Age_interpolate	Fare_fill	Sex_female	Sex_male	Embarked_C	Embarked_Q	Embarked_S
0	3		22.0			7.2500		0			1			0			0			1
1	1		38.0			71.2833		1			0			1			0			0
-----------------------------------------------------------------------------------------------------

X_test = pd.get_dummies(train[feature_names])
print(X_test.shape)
print(X_test.isnull().sum().sum())
X_test.head(2)

(891, 8)
0

	Pclass	Age_interpolate	Fare_fill	Sex_female	Sex_male	Embarked_C	Embarked_Q	Embarked_S
0	3		22.0			7.2500		0			1			0			0			1
1	1		38.0			71.2833		1			0			1			0			0

-----------------------------------------------------------------------------------------------------

y_train = train[label_name]
print(y_train.shape)
y_train.head(2)

(891,)
0    0
1    1
Name: Survived, dtype: int64
머신러닝 알고리즘
from sklearn.emsemble import RandomForestClassifier

model = RandomForestClassifier(n_estimators=100, random_state=42, n_jobs=-1)
model
하이퍼파라미터 튜닝
- 머신러닝 모델을 생성할 때 사용자가 직접 설정하는 값
- 이를 어떻게 설정하느냐에 따라 모델의 성능이 달라짐
- GridSearchCV() : 시도할 하이퍼파라미터들을 지정하면, 모든 조합에 대해 교차검증 후 가장 좋은 성능을 내는 하이퍼파라미터 조합을 찾는다
- RandomizedSearchCV() : GridSearch와 동일한 방식으로 사용하지만 모든 조합을 다 시도하지 않고, 각 반복마다 임의의 값만 대입해 지정한 횟수만큼 평가
RandomizedSearchCV()
- random한 값을 넣고 하이퍼파라미터를 찾는다
- 처음에는 범위를 넓게 지정하고 그 중에 좋은 성능을 내는 범위를 점점 좁혀가면서 찾는다
from sklearn.model_selection import RandomizedSearchCV

params_distributions = {"max_depth" : np.random.randint(3, 100, 10),
						"max_features" : np.random.uniform(0, 1, 10)}

clf = RandomizedSearchCV(estimator=model,
                         param_distributions=param_distributions,
                         n_iter=5,
                         n_jobs=-1,
                         random_state=42)

clf.fit(X_train, y_train)

RandomizedSearchCV(estimator=RandomForestClassifier(n_jobs=-1, random_state=42),
                   n_iter=5, n_jobs=-1,
                   param_distributions={'max_depth': array([55, 26, 59, 80, 24, 79, 66, 52,  9, 57]),
                                        'max_features': array([0.1359601 , 0.01381982, 0.72303247,
                                        0.41355242, 0.8405867 ,
       									0.11787614, 0.1475247 ,
                                        0.74666743, 0.40976263, 0.98011864])},
                   random_state=42)
Best Estimator
best_model = clf.best_estimator_
best_model.fit(X_train, y_train)

RandomForestClassifier(max_depth=9, max_features=0.41355242466883035, n_jobs=-1,
                       random_state=42)
# best_score_
y_predict = best_model.predict(X_test)best_model = clf.best_estimator_
y_predict = best_model.fit(X_train, y_train).predict(X_test)# feature_importances
sns.barplot(x=best_model.feature_importances_, y=best_model.feature_names_in_)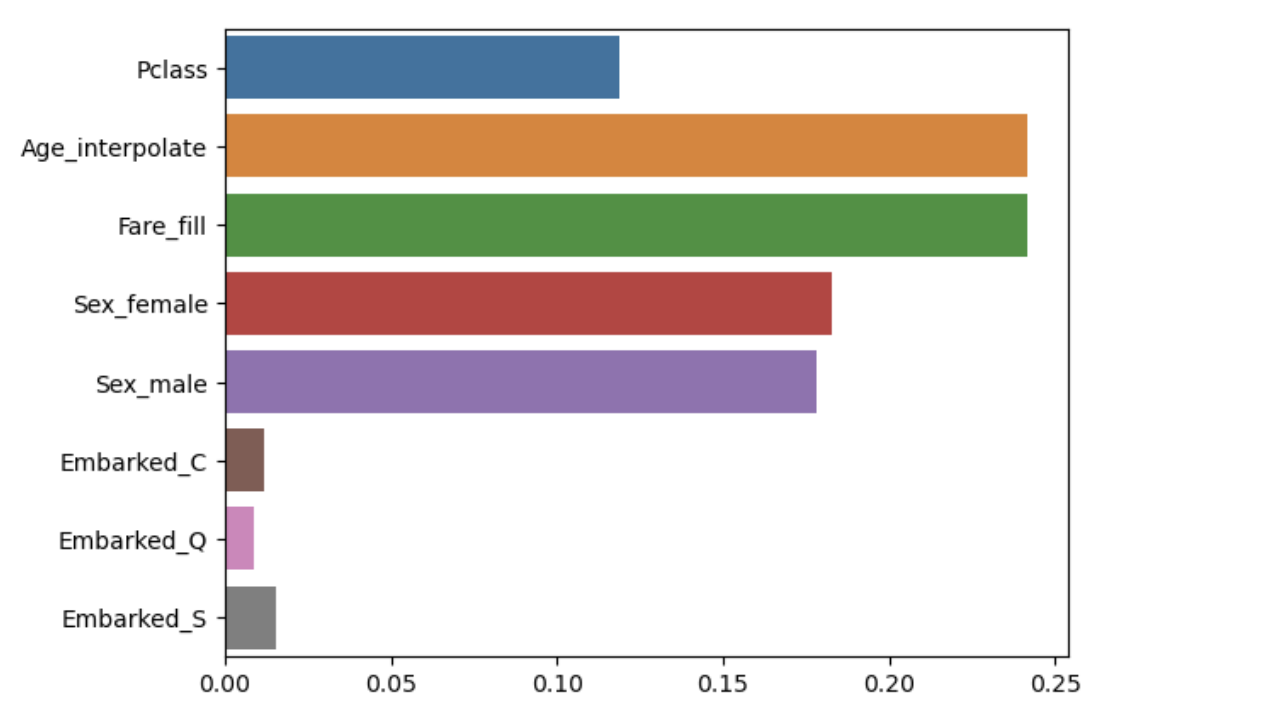
kaggle submission
submit = pd.read_csv("data/titanic/gender_submission.csv")
file_name = f"submit_{clf.best_score_}.csv"

submit.to_csv(file_name, index=False)

Ⓓ🅰️🅣🄰 ♡♥︎