
import
import cv2
import numpy as np
import matplotlib.pyplot as plt
%matplotlib inline
@matplotlib inline
Jupyter Notebook(이하 노트북)환경에서 사용되는 명령어
본래 matplotlib은 별도의 창을 열어 그래프를 표시하는데,
@matplotlib inline을 사용하면 별도의 창을 열지않고 노트북에 표시됨
이미지 Read, show
img = cv2.imread('/content/dog_backpack.jpg')
plt.imshow(img)

img_rgb = cv2.cvtColor(img, cv2.COLOR_BGR2RGB)
plt.imshow(img_rgb)

new_img = img_rgb.copy()
new_img = cv2.flip(new_img, 0)
plt.imshow(new_img)
cv2.cvtColor(img, cv2.COLOR_BGR2RGB)
cv2 에서 이미지를 읽을때 Blue, Green, Red 순으로 읽지만
plt(matplotlib) 에서는 Red, Green, Blue 순으로 읽어서 색이 노트북에 올바르게 표시되지 않는다.
| img | img_rgb | new_img |
|---|---|---|
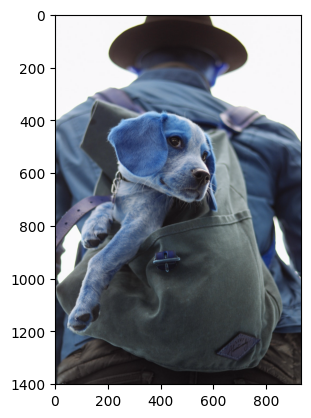 | 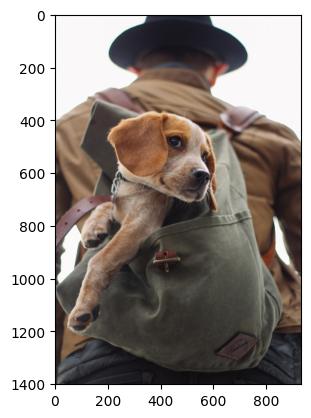 | 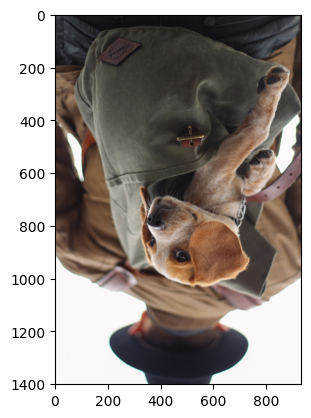 |
이미지에 그리기
pt1 = (200, 380)
pt2 = (600, 700)
cv2.rectangle(img_rgb, pt1 = pt1, pt2 = pt2, color = (255,0,0), thickness = 10)
plt.imshow(img_rgb)

vertices = np.array([[250, 700],[425, 400],[600, 700]], np.int32)
pts = vertices.reshape((-1,1,2))
img_rgb = cv2.cvtColor(img, cv2.COLOR_BGR2RGB)
cv2.polylines(img_rgb, [pts], isClosed = True, color = (0,0,255), thickness = 20)
plt.imshow(img_rgb)
pts = vertices.reshape((-1,1,2))
cv2.polylines(img_rgb, [pts], isClosed = True, color = (0,0,255), thickness = 20) 에 필요한 pts 형태 (3차원 꼭지점) 으로 변환
-1은 자동으로 계산된 적절한 크기를 의미합니다. 여기서는 꼭지점의 개수인 3이 됩니다.1은 각 꼭지점 배열을 하나의 개별 배열로 유지합니다.2는 각 꼭지점이[x, y]형식을 따름을 명시합니다.
이미지에 이벤트 달기
import cv2
import numpy as np

def create_circle(event, x, y, flags, param):
    if event == cv2.EVENT_RBUTTONDOWN:
        cv2.circle(img, (x, y), 100, (0, 0, 255), thickness=10)

img = cv2.imread('/content/dog_backpack.jpg')
cv2.namedWindow(winname='dog')
cv2.setMouseCallback('dog', create_circle)

while True:

  cv2.imshow('dog', img)
  if cv2.waitKey(20) & 0xFF == 27:
    break

cv2.destroyAllWindows()
cv2.setMouseCallback('dog', create_circle)
def create_circle(event, x, y, flags, param):
함수의 파라미터를 지정해주지 않아도 cv2에서 자동으로 파라미터를 주입해준다.

qkdk