
ElasticSerach 검색
- 엘라스틱 스택에서 핵심을 차지하는 엘라스틱서치는 전문 검색 기능을 시작으로 꾸준히 성정해 왔으며 다양 한 검색 쿼리를 지원하고 있다.
- 텍스트, 숫자, 정형, 비정형 데이터를 저장한 다음에 인덱싱을 마치고 나면 바로 쿼리를 실행해서 결과를 얻을 수 있다.
- 관계형DB 에서 제공하는 LIKE 연산자와 같은 단순 텍스트 매칭 기법을 넘어서 텍스트를 여러 단어로 변형해 검색할 수 있으며, 스코어링 알고리즘을 적용해 연관성이 높은 결과에 대한 제어가 가능하므로 대량의 데이터를 대상으로 빠르고 정확한 검색이 가능하게 만들어 준다.

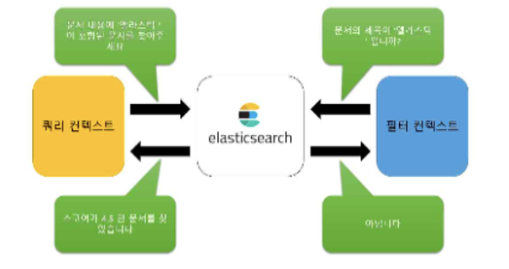
쿼리 컨텍스트
- 쿼리 컨텍스트는 질의에 대한 유사도를 계산해 이를 기준으로 더 정확한 결과를 보여준다.
- kibanas_sample_data_ecommerce 인덱스에 있는 category 필드의 역인덱스 테이블에 ’clothing' 용어가 있는 도큐먼트를 찾아달라는 요청이다.
- 3972개의 도큐먼트를 찾았음을 알 수 있고. 스코어가 높은 순서대로 정렬되어 있다.
- 필터와 쿼리를 구분하는 특별한 API 가 있는 것은 아니고 모두 searchAPI 를 사용한다.
GET kibana_sample_data_ecommerce/_search
{
  "query": {
    "match": {
      "category": "clothing"
    }
  }
}
{
"took" : 25,
"timed_out" : false,
"_shards" : {
"total" : 1,
"successful" : 1,
"skipped" : 0,
"failed" : 0
},
"hits" : {
"total" : {
"value" : 3927,
"relation" : "eq"
},
"max_score" : 0.20545526,
"hits" : [
{필터 컨텍스트
- 필터 컨텍스트는 스코어를 계산하지 않는다.
- 유사도를 계산하지 않고 결과만을 반환한다.
- 스코어 과정을 생략하기에 전체적으로 속도가 빠르다.
- 엘라스틱 서치는 힙 메모리의 10%를 캐시에 이용한다. 캐시를 이용한 빠른 검색을 하려면 필터 컨텍스트를 사용해야 한다.
GET kibana_sample_data_ecommerce/_search
{
  "query": {
    "bool": {
      "filter": {
        "term": {
          "day_of_week": "Friday"
          }
        }
      }
    }
  }
}
{
"took" : 6,
"timed_out" : false,
"_shards" : {
"total" : 1,
"successful" : 1,
"skipped" : 0,
"failed" : 0
},
"hits" : {
"total" : {
"value" : 770,
"relation" : "eq"
},
"max_score" : 0.0,
"hits" : [
Elasticserach 집계
- 엘라스틱서치에서 집계(aggregation) 는 데이터를 그룹핑하고 통계값을 얻는 기능으로 SQL 의 GROUP BY 와 통계 함수를 포함하는 개념이다.
- 데이터를 날짜별로 묶거나 특정 카테고리별로 묶어 그룹별 통계 를 내는 식이다.
- 대표적인 활용 사례로 키바나를 들 수 있다. 키바나의 주 기능인 데이터 시각화와 대시보드 는 대부분 집계 기능을 기반으로 동작한다.
집계의 요청 - 응답상태
- 집계를 위한 특별한 API 가 제공되는 것은 아니며, search API 의 요청 본문에 aggs 파라미터를 이용하면 쿼리 결과에 대한 집계를 생성할 수 있다. 아래는 집계를 위한 기본 형태이다.
집계함수
ElasticSearch에서 집계는 데이터를 그룹핑하고 통계값을 얻는 기능으로 SQL 의 GROUP BY 와 통계 함수를 포함하는 개념이다.
데이터를 날짜별로 묶거나 특정 카테고리별로 묶어 그룹별 통계를 내는 식이다.
키바나의 주 기능인 데이터 시각화와 대시보드는 대부분 집계 기능을 기반으로 동작한다.
집계의 요청 - 응답상태
집계를 위한 특별한 API가 제공되는 것은 아니며, search API 의 요청 본문에 aggs 파라미터를 이용하면 쿼리 결과에 대한 집계를 생성할 수 있다.
GET<인덱스>/_serach
{
"aggs": {
"aggs_type": {
				'''
			}
		}
	}
}- aggs 는 집계를 요청하는 의미
- 집계타입
- 메트릭 집계
- 필드의 최소/최대/합계/평균/중간값 같은 통계 결과를 보여준다. 필드의 타입에 따라 사용가능한 집계 타입에 제한이 있는데, 대표적으로 텍스트 타입 필드는 합계나 평균 같은 수치 연산을 계산한다.
- 버킷 집계
- 매트릭 집계가 특정 필드를 기준으로 통계값을 계산하려는 목적이라면 버킷 집계는 특정 기준을 맞춰서 도큐먼트를 그룹핑하는 역할을 한다. 여기에서 버킷은 도큐먼트가 분할되는 단위로 나뉜 각 그룹을 의미한다.
- 메트릭 집계
범위 집계
- 범위 집계를 이용하면 각 버킷의 범위를 사용자가 직접 설정할 수 있다.
GET kibana_sample_data_ecommerce/_search
{
  "size": 0,
  "aggs": {
    "range_aggs": {
      "range" : {
        "field": "products.base_price",
        "ranges": [
          { "from": 0, "to": 30 },
          { "from": 30, "to": 50 },
          { "from": 50, "to": 100 },
          { "from": 100, "to": 200 },
          { "from": 200, "to": 1000 }
          ]
        }
      }
    }
  }
{
"took" : 2,
"timed_out" : false,
"_shards" : {
"total" : 1,
"successful" : 1,
"skipped" : 0,
"failed" : 0
},
"hits" : {
"total" : {
"value" : 4675,
"relation" : "eq"
},
"max_score" : null,
"hits" : [ ]
},
"aggregations" : {
"range_aggs" : {
"buckets" : [
{
"key" : "0.0-30.0",
"from" : 0.0,
"to" : 30.0,
"doc_count" : 3882
},
{
"key" : "30.0-50.0",
"from" : 30.0,
"to" : 50.0,
"doc_count" : 1468
},
{
"key" : "50.0-100.0",
"from" : 50.0,
"to" : 100.0,
"doc_count" : 1902
},
{
"key" : "100.0-200.0",
"from" : 100.0,
"to" : 200.0,
"doc_count" : 263
},
{
"key" : "200.0-1000.0",
"from" : 200.0,
"to" : 1000.0,
"doc_count" : 13
}
]
}
}
Logstash(로그스태시)
- 압축파일 다운로드
wget https://artifacts.elastic.co/downloads/logstash/logstash-7.17.1-linux-x86_64.tar.gz
- 로그를 수집하는 쪽에서 로그 형태를 분석하고 시스템에서 인식할 수 있도록 로그를 정제하는 작업이 필요한데, 로그스태시는 이 과정을 쉽게 할 수 있도록 지원한다.
- 어떤 형태의 로그에 대해서도 ‘수집 > 가공 > 전송’ 하는 일련의 과정을 간편하게 구현 하기 위한 강력한 기능을 제공한다.
- 로그 스태시는 오픈소스 데이터 처리 파이프라인 도구이다.
- 장애대응 로직이0나 성능 저하 요인을 쉽게 파악할 수 있는 모니터링, API 간단한 조정으로 성능을 튜닝할 수 있는 파라미터들도 제공한다.
- 비츠, 로그스태시, 엘라스틱서치, 키바나를 이용해 데이터 수집, 변환, 저장, 시각화하는 서비스를 구성할 때 로그스태시는 데이터를 저장하기 전에 원하는 형태로 가공하는 역할을 한다.
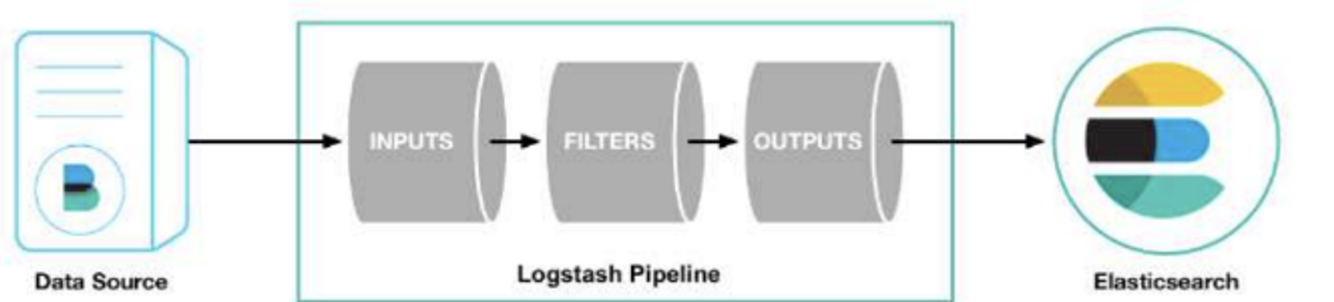
입력
- 소스 원본으로부터 데이터를 입력받는 단계이다.
- 직접 대상에 접근해 읽어 들이는 경우도 있지만, 서버를 열 어놓고 받아들이는 형태의 구성도 가능하다.수 있고 이를 쉽게 처리하기 위해 다양한 플러그인들이 존재한다.
- 예를들어 특정 파일은 파일 플러그인을, 실시간 트윗은 트위터 플러그인을 통해 가져올 수 있다.
- 자주 쓰이는 플러그인
- file : 리눅스의 tail -f 처럼 파일을 스트리밍하여 이벤트를 읽는다.
- syslog : 네트워크를 통해 전달되는 syslog를 수신한다.
- kafka : 카프카의 토픽에서 데이터를 읽는다.
- jdbc : JDBC 드라이버로 지정한 일정마다 쿼리를 실행해서 결과를 읽어 들인다.
필터
- 입력 플러그인이 받은 데이터를 의미 있는 데이터로 구조화하는 역할을 한다.
- 필수 구성요소가 아니어서 필터 없이 파이프라인을 구성할 수 있지만, 필터 없는 파이프라인은 그 기능을 온전히 발휘하기 힘들다
- 로그스태시 필터는 비정형 데이터를 정형화하고 데이터 분석을 위한 구조를 잡아준다.
- 비츠나 카프카 등에서 입력받은 데이터를 필터를 이용해 필요한 정보만 손쉽게 추출하거나 형태를 변환하고 부족한 정보는 추가하 는 등 전반적인 데이터 정제/가공 작업을 수행할 수 있다.
- 정형화된 데이터는 엘라스틱서치나 아마존 S3와 같은 스토리지에 전송되어 분석 등의 용도로 활용된다.
- 자주 쓰이는 플러그인
- add_field : 새로운 필드를 추가한다.
- add_tag : 성공한 이벤트에 태그를 추가할 수 있다.
- enable_metric : 매트릭 로깅을 활성화하거나 비활성화 할 수 있다. 수집된 데이터는 로그스태시 모니터링에서 해당 필터의 성능을 분석할 떄 사용한다.
- id : 플러그인의 ID 를 설정한다. 모니터링 시 아이디를 이용해 특정 플러그인을 쉽게 찾을 수 있다.
- remove_field : 필드를 삭제할 수 있다.
- remove_tag : 성공한 이벤트에 붙은 태그를 제거할 수 있다.
출력
- 출력은 파이프라인의 입력과 필터를 거쳐 가공된 데이터를 지정한 대상으로 내보내는 단계이다.
- 입력, 필터 플러그인과 마찬가지로 다양한 출력 플러그인을 지원한다.
- 자주 쓰이는 플러그인
- elasticserach : 사용빈도가 가장 높고, bulk API 를 사용하여 엘라스틱서치 인덱싱을 수행한다.
- file : 지정한 파일의 새로운 줄에 데이터를 기록한다.
- kafka : 카프카 토픽에 데이터를 기록한다.
- 파이프라인 기본 템플릿 형태
input {
	{ 입력 플러그인 }

filter {
	{ 필터 플러그인 }

output {
	{ 출력 플러그인 }
}- 소스 원본으로부터 데이터를 입력받는 단계이다. 직접 대상에 접근해 읽어 들이는 경우도 있지만, 서버를 열 어놓고 받아들이는 형태의 구성도 가능하다.
- 실습을 위한 conf 파일 설정
vi config/logstash-test.conf #

sudo ./bin/logstash -f config/logstash-test.conf

touch config/fillter-example.log- 실습을 위해 logstash-test.conf 파일을 생성하고 파일에 파일입력 플러그인을 적용한다.
root@elastic:~/logstash-7.0.1# pwd

/root/logstash-7.0.1

root@elastic:~/logstash-7.0.1# cat config/logstash-test.conf

input {

file {
	path => "/root/elasticsearch-7.0.1/logs/elasticsearch.log"
	start_position => "beginning"
	}
}
output {
  stdout { }
}- 로그스태시 필터는 비정형 데이터를 정형화하고 데이터 분석을 위한 구조를 잡아준다.
- 비츠나 카프카 등에서 입력받은 데이터를 필터를 이용해 필요한 정보만 손쉽게 추출하거나 형태를 변환하고 부족한 정보는 추가하 는 등 전반적인 데이터 정제/가공 작업을 수행할 수 있다.
- 이렇게 정형화된 데이터는 엘라스틱서치나 아마존 S3와 같은 스토리지에 전송되어 분석 등의 용도로 활용된다.
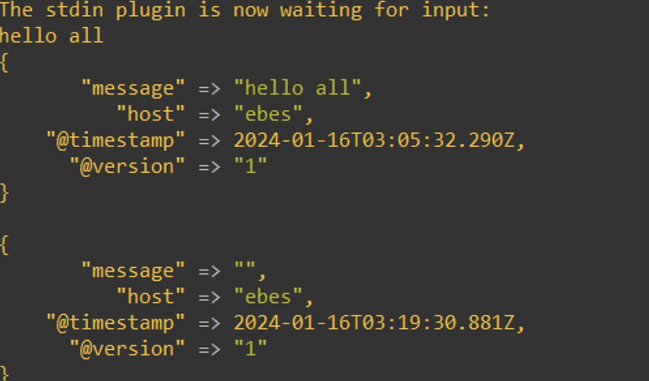
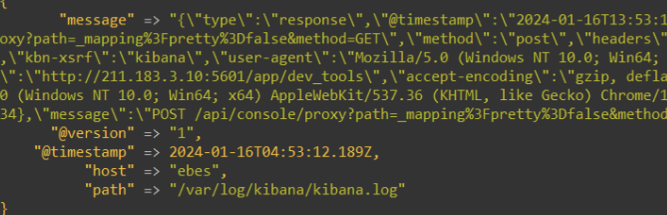
- ./bin/logstash -f config/logstash-test.conf
- 필터적용
--인풋 구조--

input{
  file{
    path => "/home/user1/logstashlab/config/fillter-example.log"
    start_position => "beginning"
    sincedb_path => "/dev/null"

  }
}

--필터구조--

fillter{
 mutate {
   split => { "message" => " " }
   add_field => { "id => %{[message][2]}" }
   remove_field => "message"
  }
}

--아웃풋 구조--

output{
  stdout { }

}- mutate 플러그인은 필드를 변형하는 다양한 기능을 제공하고 있다. 필드 이름 변 경, 삭제 등이 가능하다.
- mutate 는 플러그인 내부에 옵션이 다양한데 split 도 여러 옵션 중 하나이다. split 옵션은 구분자를 기준으로 데이터를 자를 수 있다.
- message 라는 필드를 ‘띄어쓰기’ 기준으로 분리했다.
-
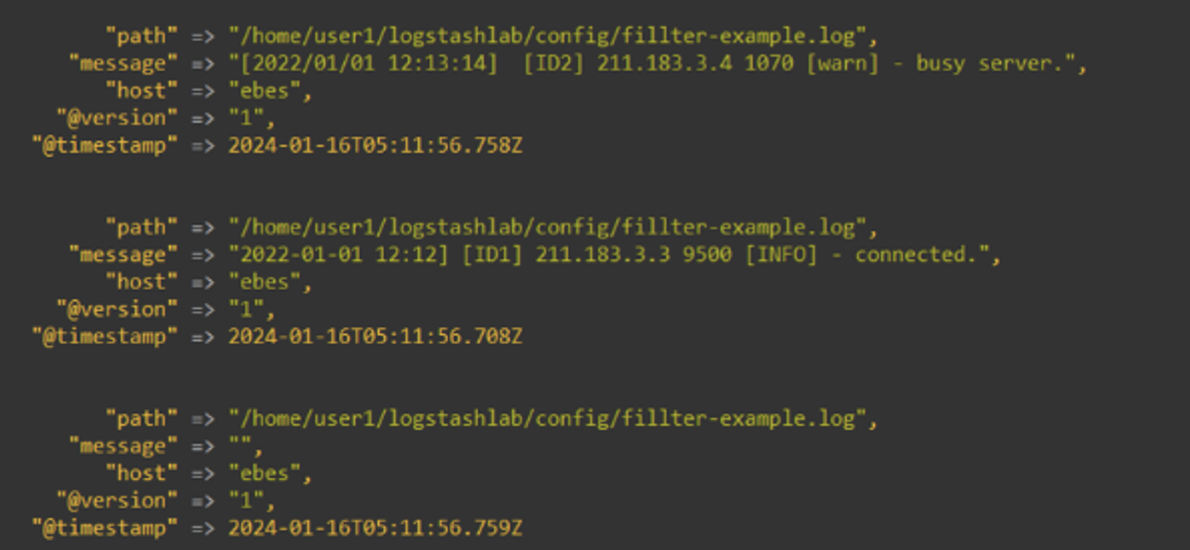
실행결과
-
grok. loglevel은 모두다 대문자, 동일한 시간포맷으로 로그가 출력하자
input {
  file {
    path => "/home/user1/logstashlab/config/filter-example.log"
    start_position => "beginning"
    sincedb_path => "/dev/null"
  }
}

filter {
  dissect {
    mapping => {"message" => "[%{timestamp}]%{?->}[%{id}] %{ip} %{+ip} [%{?level}] - %{}."}
  }
  date {
    match => [ "timestamp", "YYYY-MM-dd HH:mm", "yyyy/MM/dd HH:mm:ss"]
    target => "new_timestamp"
    timezone => "UTC"
  }
}

output {
  stdout { }
  elasticsearch {
    hosts => ["211.183.3.10:9200"]
    index => "2024-01-testlog"
  }
}
[실행]
sudo ./bin/logstash -f config/logstash-test2.conf --log.level error
Reference
https://www.elastic.co/kr/elasticsearch

안녕하세요