prometheus, grafana, jaeger, kiali가 포함된 metric 차트를 구성하도록 합니다.
cd ~/istio-in-gcp-gitops
helm create metric && cd metric
metric/templates 하위에 _helper.tpl 파일을 제외한 나머지 contents를 제거합니다.
그리고 values.yaml 파일의 모든 contents를 제거합니다.
prometheus 구성하기
charts 디렉토리로 변경한 다음 prometheus 차트를 서브차트로 추가하도록 합니다.
🔗 https://github.com/prometheus-community/helm-charts
cd charts
helm repo add prometheus-community https://prometheus-community.github.io/helm-charts
helm repo update
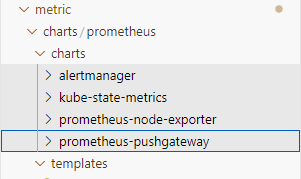
helm pull prometheus-community/prometheus --untarprometheus 차트에는 alertmanager, kube-state-metrics, prometheus-node-exporter, prometheus-pushgateway 차트가 서브차트로 포함되어 있고, templates에는 prometheus 서버 자원들이 정의되어 있습니다.
prometheus 서버는 기본 설정으로 배포할 경우 도메인 주소로 접속할 수 있습니다.
예를 들면 접속 도메인이 www.example.com일 경우 www.example.com으로 접속해야 prometheus에 접속할 수 있습니다.
이보다는 뒤에 /prometheus를 붙여서 접속하는 것이 더 깔끔하기 때문에 이를 위해 prometheus server의 설정 값을 약간 변경합니다.
prometheus의 server.baseURL, server.extraArgs를 통해 /prometheus로 접속할 수 있도록 지정할 수 있습니다.
metric/values.yaml에 prometheus server의 설정 값들을 추가합니다.
metric/values.yaml
prometheus:
  server:
    baseURL: "http://localhost:80/prometheus"
    extraArgs:
      web.route-prefix: "/"
    podLabels:
      app: prometheus-server
그러면 istio의 Gateway와 VirtualService를 추가하여 prometheus로 트래픽이 갈 수 있도록 templates 디렉토리에 추가하도록 하겠습니다.
metric/templates/metric-gateway.yaml
apiVersion: networking.istio.io/v1alpha3
kind: Gateway
metadata:
  name: metric-gateway
  namespace: {{ .Release.Namespace }}
spec:
  selector:
    istio: ingressgateway # use istio default controller
  servers:
  - port:
      number: 80
      name: http
      protocol: HTTP
    hosts:
    - '*'
    tls:
      httpsRedirect: false
metric/templates/metric-vs.yaml
apiVersion: networking.istio.io/v1alpha3
kind: VirtualService
metadata:
  name: metric-vs
  namespace: {{ .Release.Namespace }}
spec:
  hosts:
  - "*"
  gateways:
  - metric-gateway
  http:
  - name: prometheus
    match:
    - uri:
        exact: /prometheus
    - uri:
        prefix: /prometheus/
    rewrite:
      uri: "/"
    route:
    - destination:
        host: {{ include "metric.name" . }}-prometheus-server.{{ .Release.Namespace }}.svc.cluster.local
        port:
          number: 80
이렇게 구성한 다음 github repository에 작업 내용을 반영하도록 합니다.
그리고 argocd로 metric 차트를 배포합니다.
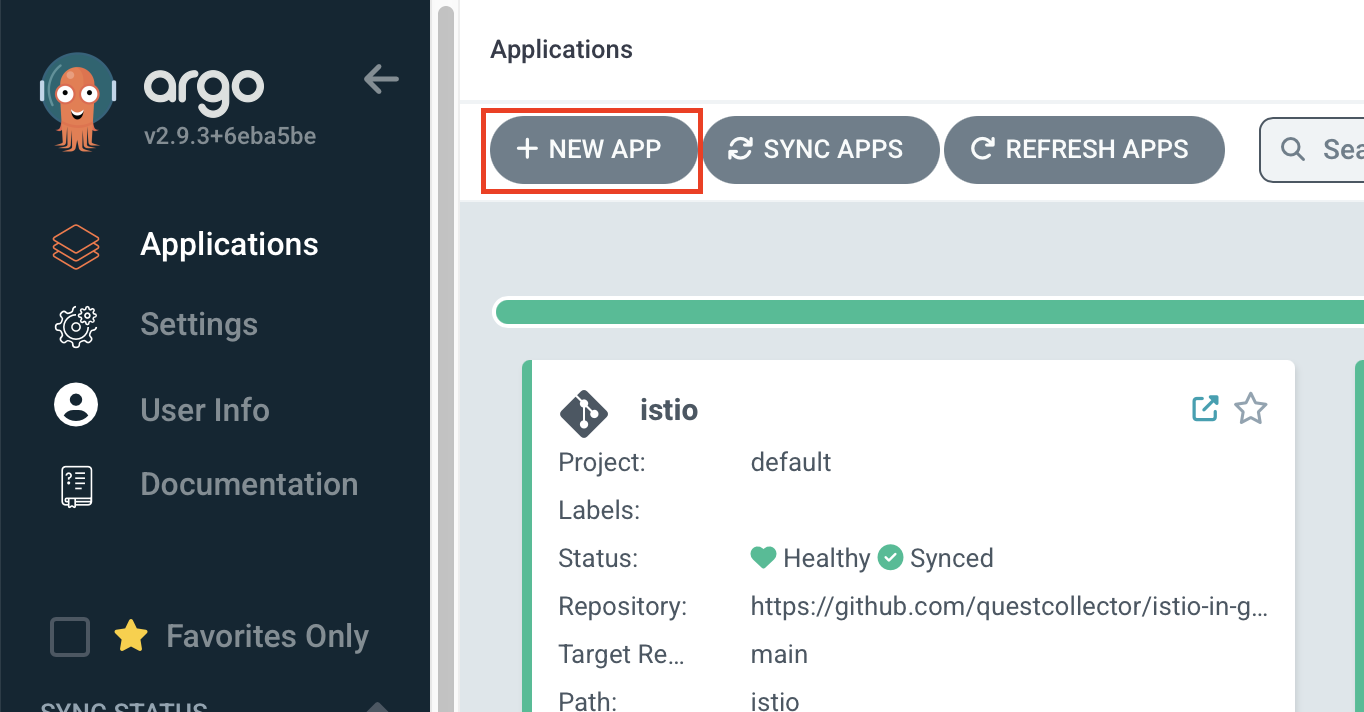
Applications > NEW APP 버튼을 클릭합니다.
| key | value |
|---|---|
| Application Name | metric |
| Project Name | default |
| Repository URL | istio-in-gcp-gitops 주소 |
| Revision | 작업 중인 브랜치 |
| Path | metric |
| Cluster URL | https://kubernetes.default.svc |
| Namespace | istio-system |
| Helm | ✅ |
| VALUES FILE | values.yaml(선택하지 않아도 기본 값으로 등록되어 있음) |
생성 후 sync까지 하여 등록했던 도메인에서 /prometheus를 추가해서 접속했을 때 prometheus 서버에 잘 접속되는지 확인합니다.
노드 별 5분동안 cpu 사용량을 표현하는 promQL문을 넣어서 execute해 볼 수 있습니다.
100 - (avg by (instance) (rate(node_cpu_seconds_total{mode='idle'}[5m])) * 100)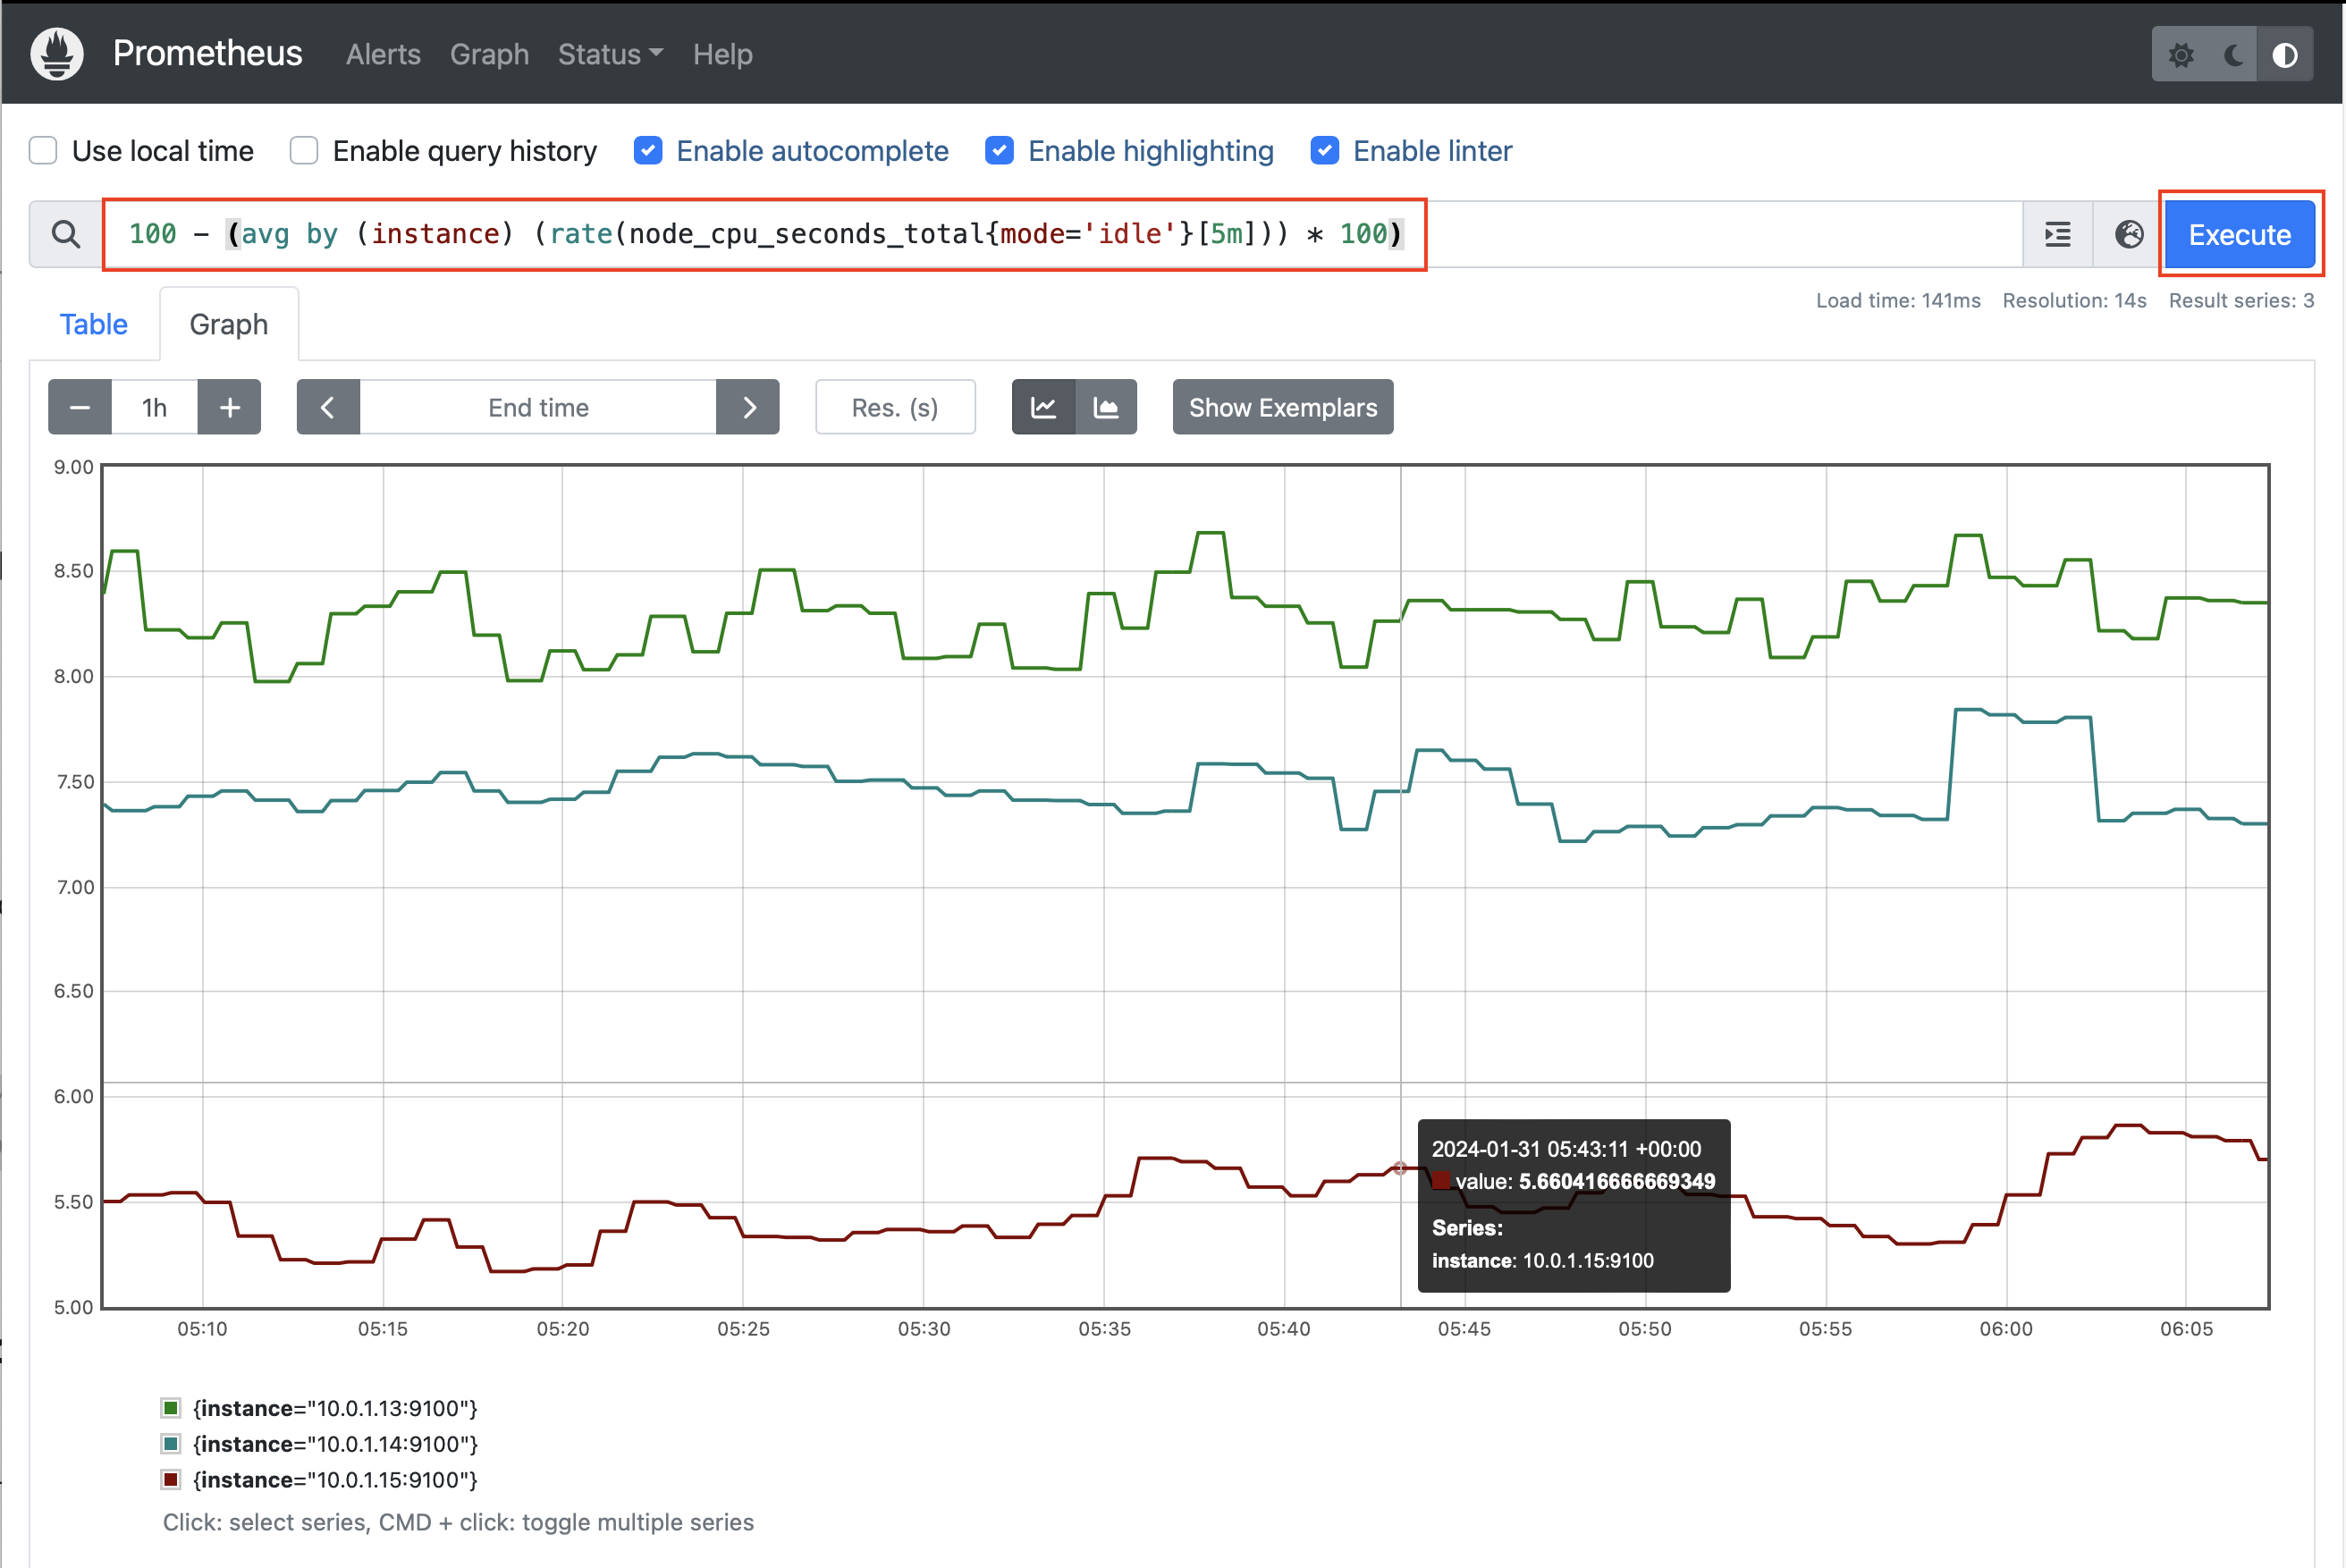
grafana 구성하기
다음으로 메트릭 정보를 그래프 대시보드로 표현해 주는 grafana를 구성하여 봅니다.
cd ~/istio-in-gcp-gitops/metric/charts
helm repo add grafana https://grafana.github.io/helm-charts
helm pull grafana/ --untar
grafana도 prometheus와 마찬가지로 /grafana 엔드포인트로 접속하기 위해서 value 값을 추가해 주어야 합니다.
grafana의 설정 값들은 grafana.ini 값에 지정되는데, 여기서 server.root_url, server.serve_from_sub_path 값을 지정하도록 하겠습니다.
그리고 persistence.enabled에 true값을 지정하여 재시작할때마다 데이터가 휘발되지 않도록 Persistence volume을 사용할 수 있도록 설정합니다.
metric/values.yaml
prometheus:
  server:
    baseURL: "http://localhost:80/prometheus"
    extraArgs:
      web.route-prefix: "/"
    podLabels:
      app: prometheus-server
# 추가
grafana:
  podLabels:
    app: grafana
  persistence:
    enabled: true
  grafana.ini:
    server:
      root_url: 'http://localhost:3000/grafana/'
      serve_from_sub_path: true
그리고 VirtualService에 grafana의 엔드포인트로 가는 경로를 추가합니다.
metric/templates/metric-vs.yaml
apiVersion: networking.istio.io/v1alpha3
kind: VirtualService
metadata:
  name: metric-vs
  namespace: {{ .Release.Namespace }}
spec:
  hosts:
  - "*"
  gateways:
  - metric-gateway
  http:
  # 추가
  - name: grafana
    match:
    - uri:
        exact: /grafana
    - uri:
        prefix: /grafana
    route:
    - destination:
        host: {{ include "metric.name" . }}-grafana.{{ .Release.Namespace }}.svc.cluster.local
        port:
          number: 80
  - name: prometheus
    match:
    - uri:
        exact: /prometheus
    - uri:
        prefix: /prometheus/
    rewrite:
      uri: "/"
    route:
    - destination:
        host: {{ include "metric.name" . }}-prometheus-server.{{ .Release.Namespace }}.svc.cluster.local
        port:
          number: 80
여기까지 작업한 결과물을 github 레포지토리에 반영합니다.
이후 metric 앱을 argocd에서 sync하여 grafana 서브차트를 배포합니다.
이제 prometheus와 마찬가지로 /grafana 엔드포인트로 접속합니다.
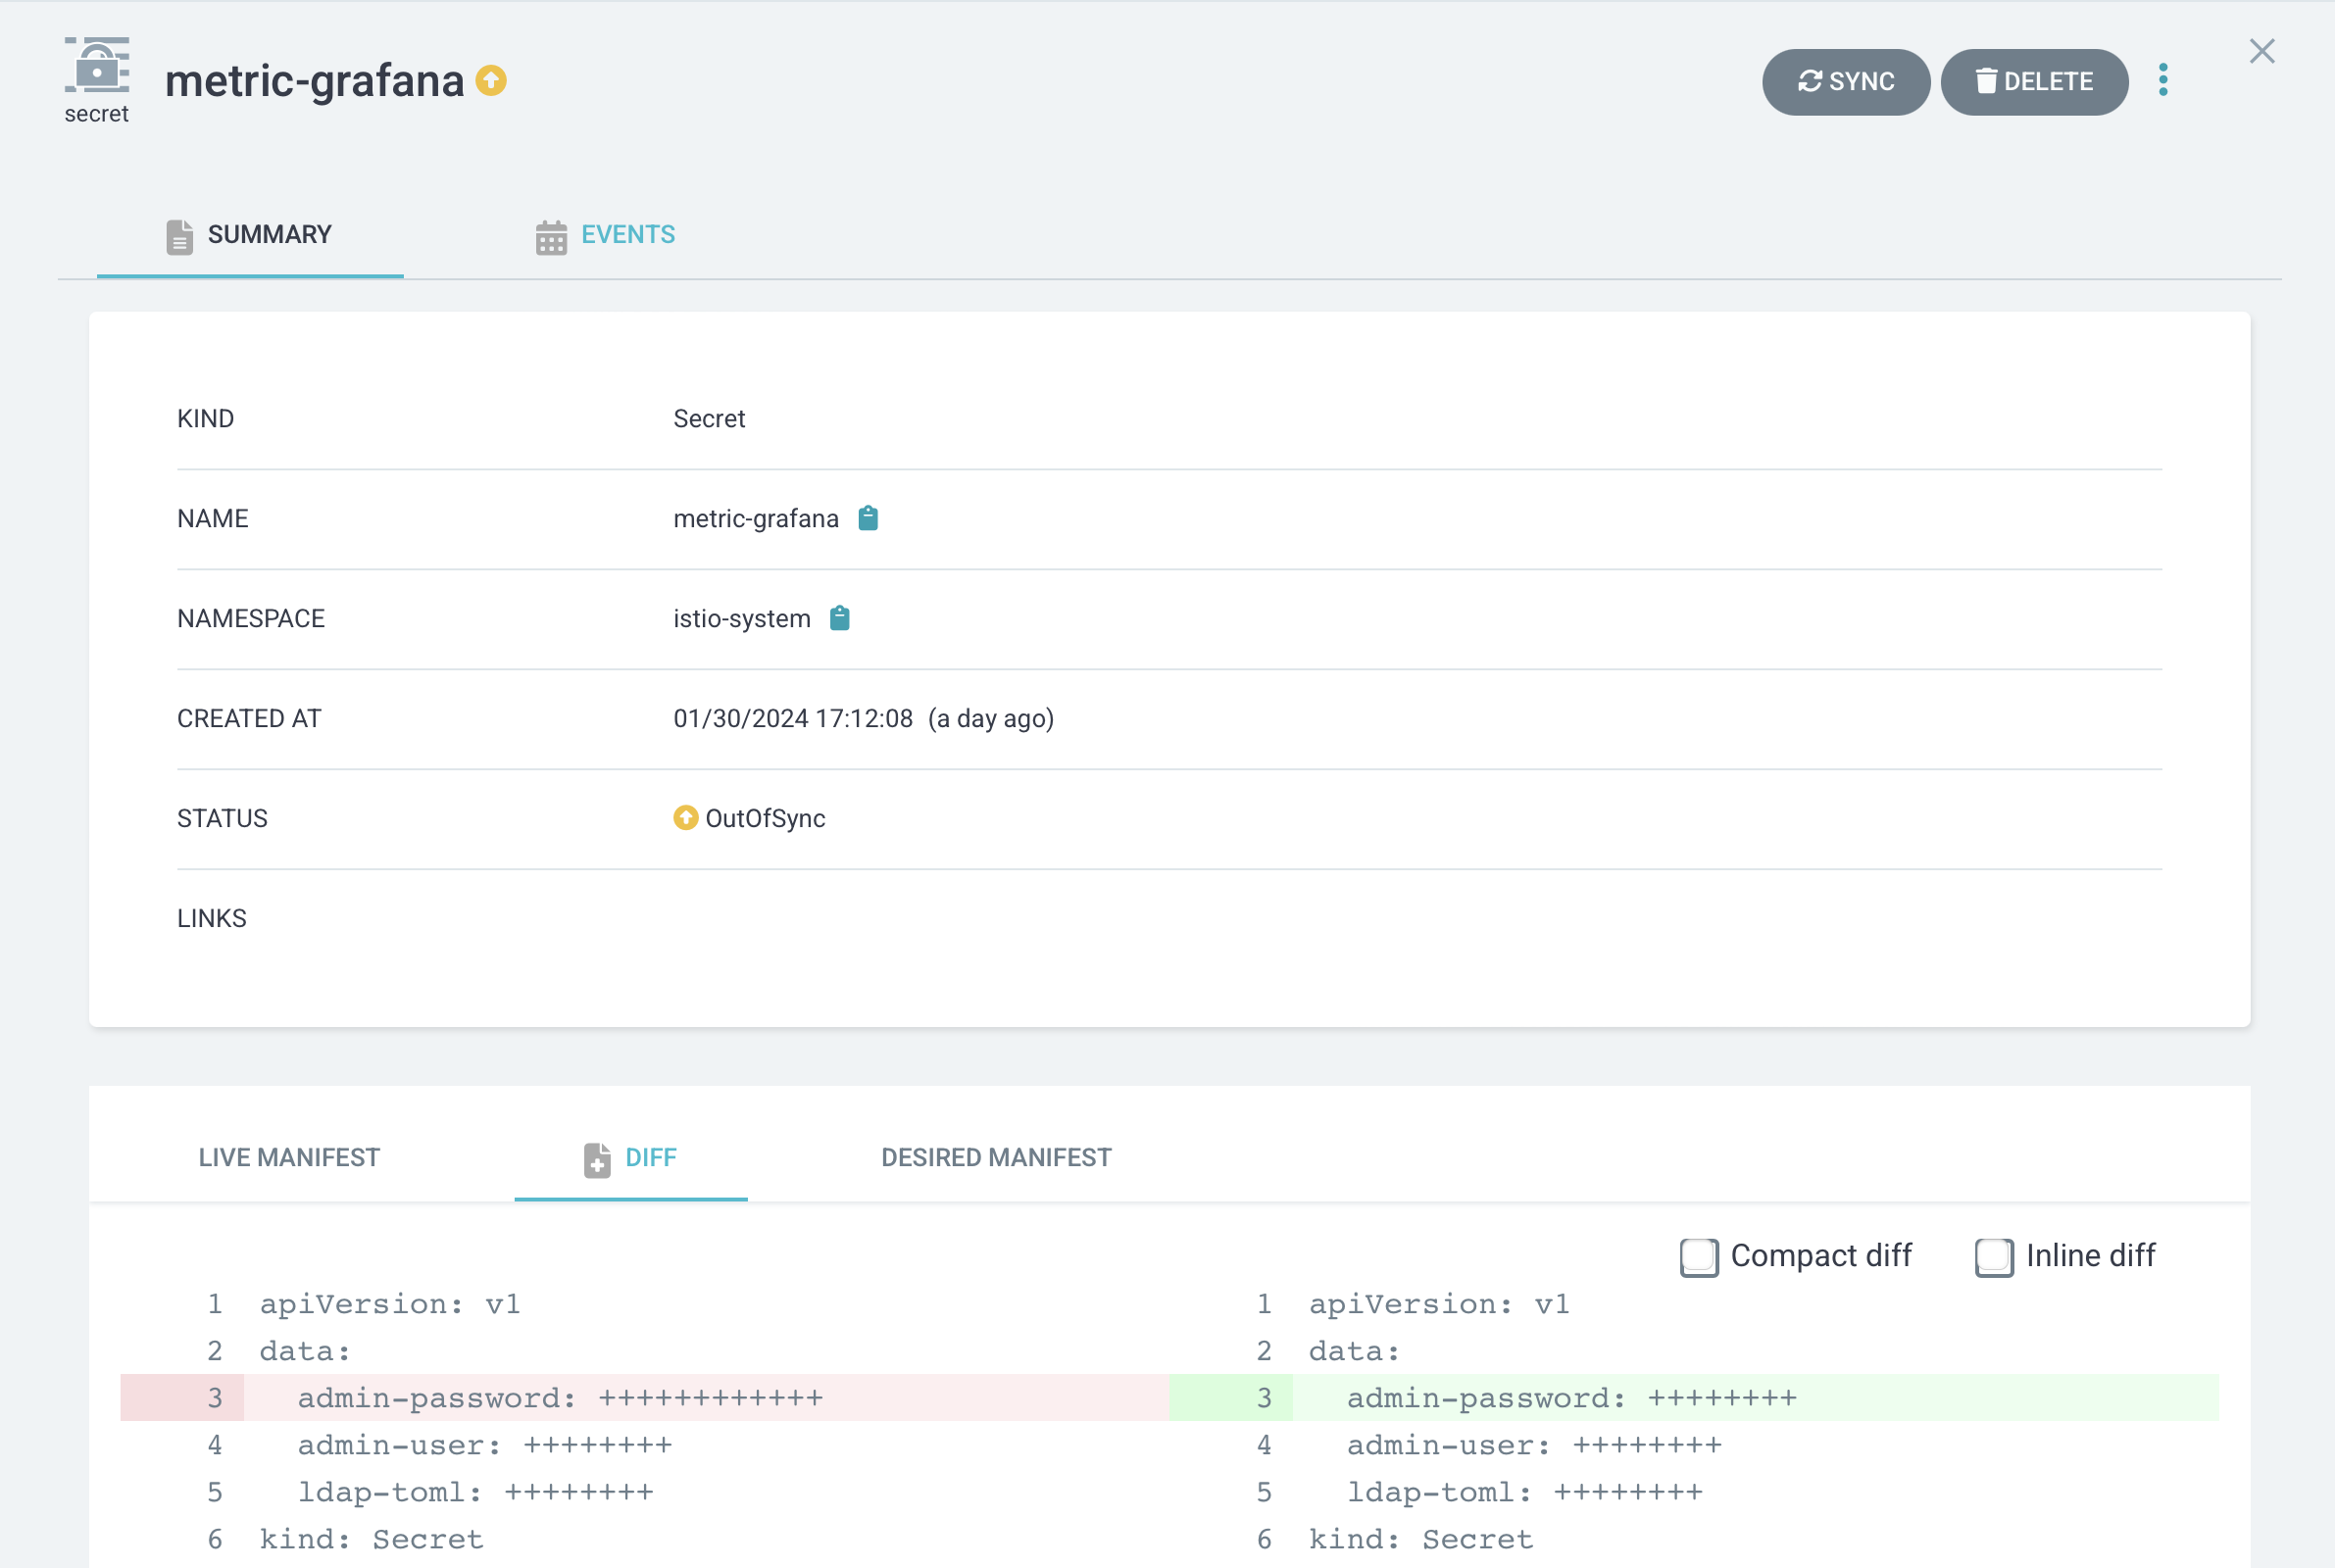
이전에는 grafana의 초기 계정은 admin/admin으로 접속이 가능했는데 이제는 secret을 통해서 초기 비밀번호를 제공하고 있습니다.
istio-system 네임스페이스의 metric-grafana secret에서 admin-password와 admin-user 데이터를 제공하고 있습니다.
kubectl get secret metric-grafana -n istio-system -o yamlapiVersion: v1
data:
admin-password: ++++++
admin-user: ++++++
ldap-toml: ""
kind: Secret
...base64로 디코딩하여 초기 패스워드를 찾을 수 있습니다.
kubectl get secret metric-grafana -n istio-system \
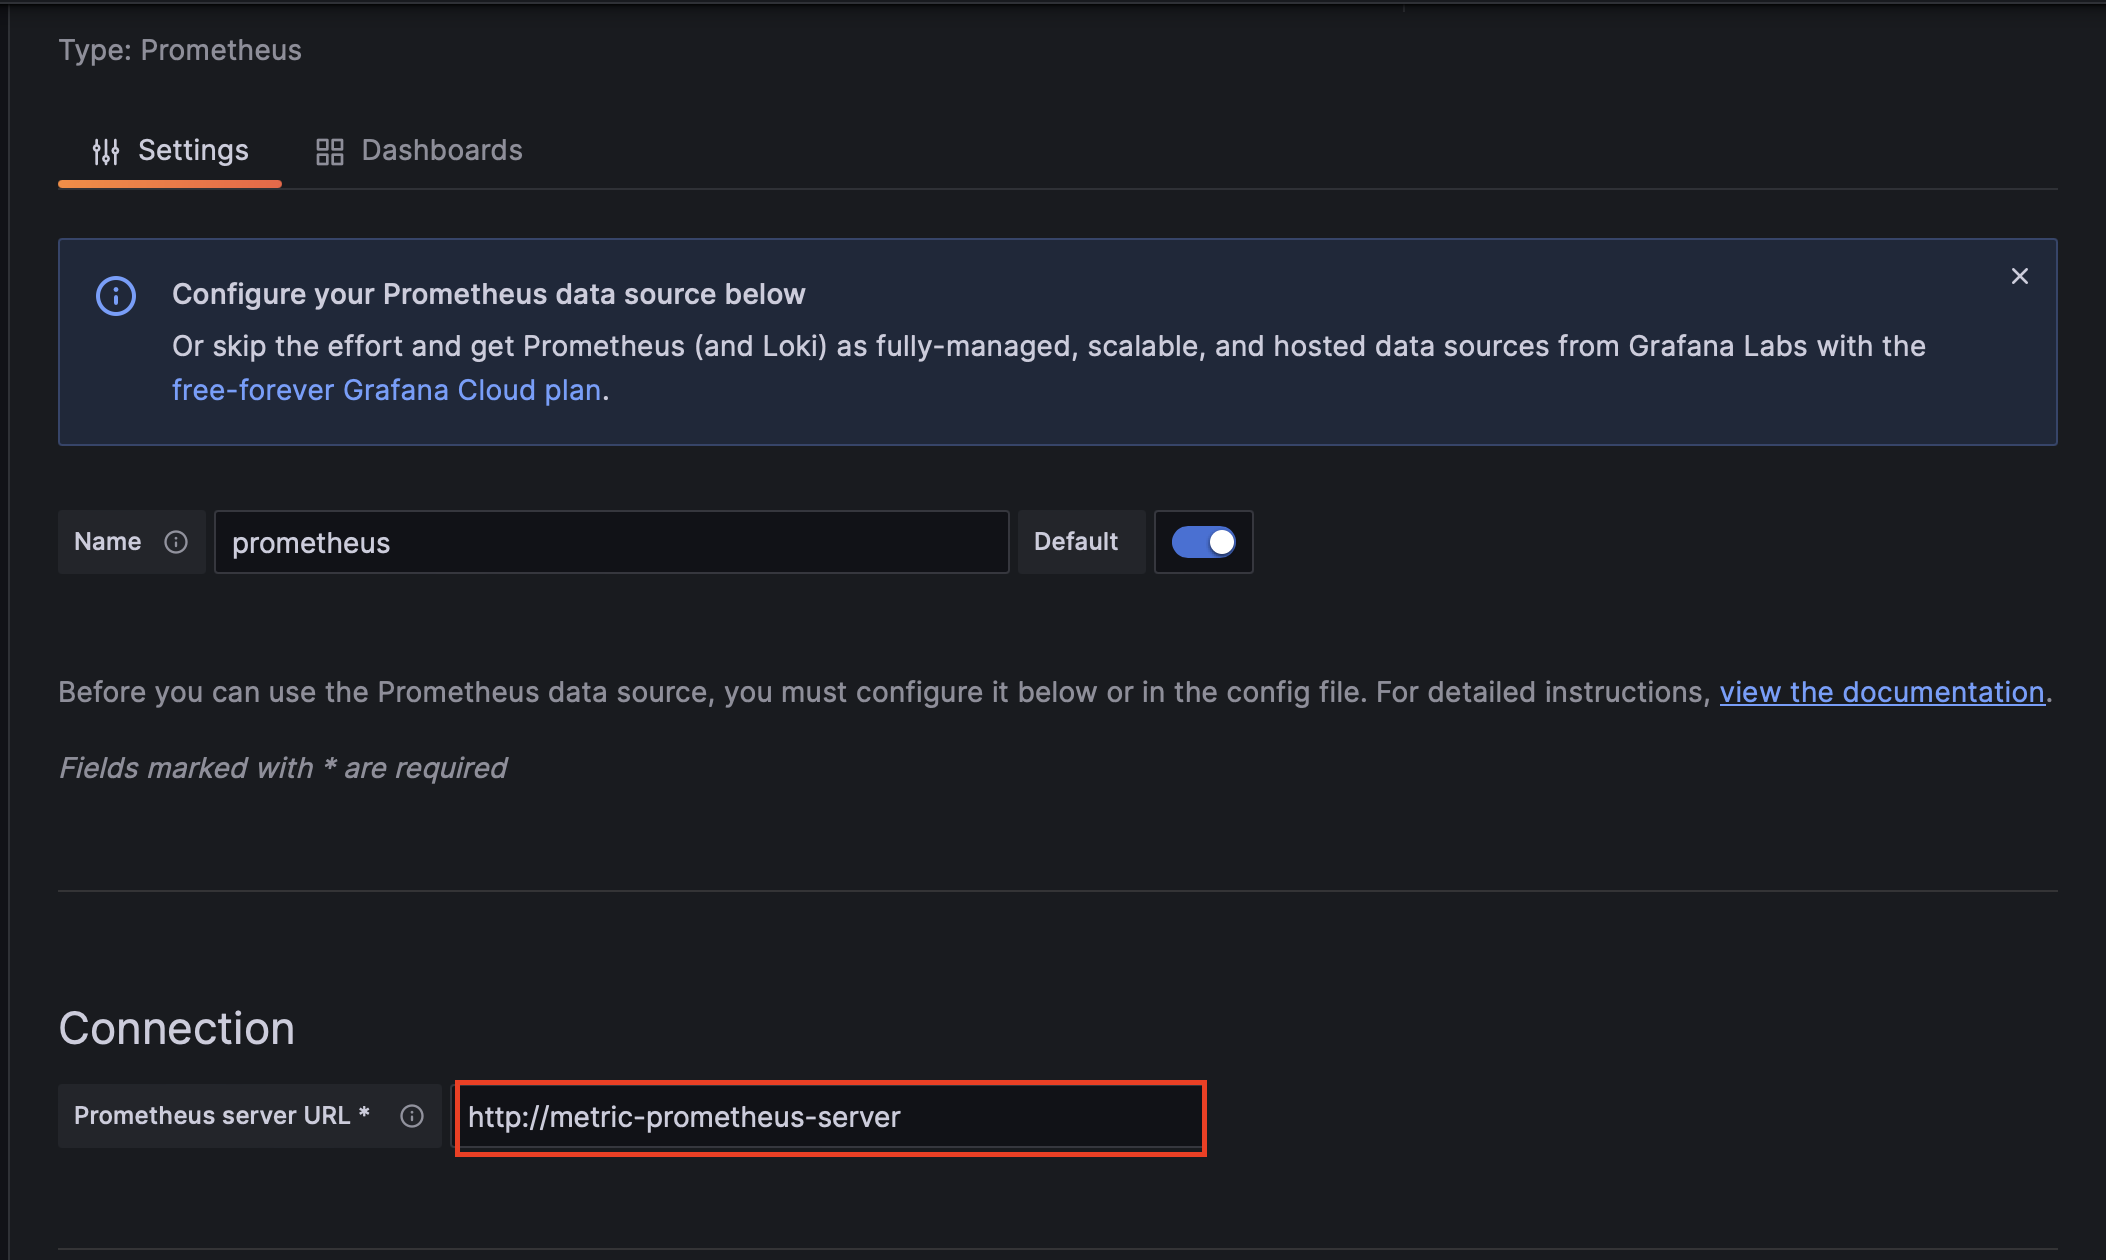
-o jsonpath='{$.data.admin-password}' | base64 -d && echoadmin 계정과 초기 패스워드로 접속하고, prometheus 데이터소스를 추가합니다.
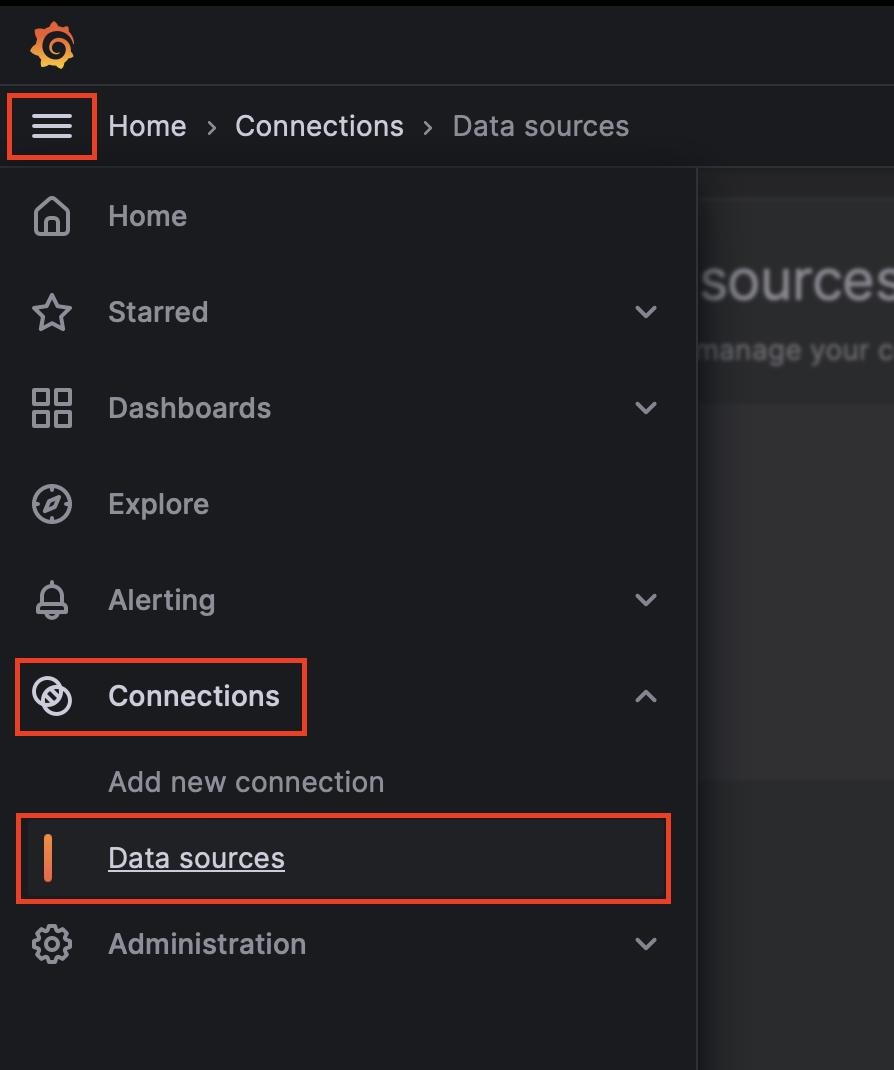
Connection에 prometheus server의 서비스 이름의 URL을 입력합니다.
http://metric-prometheus-server
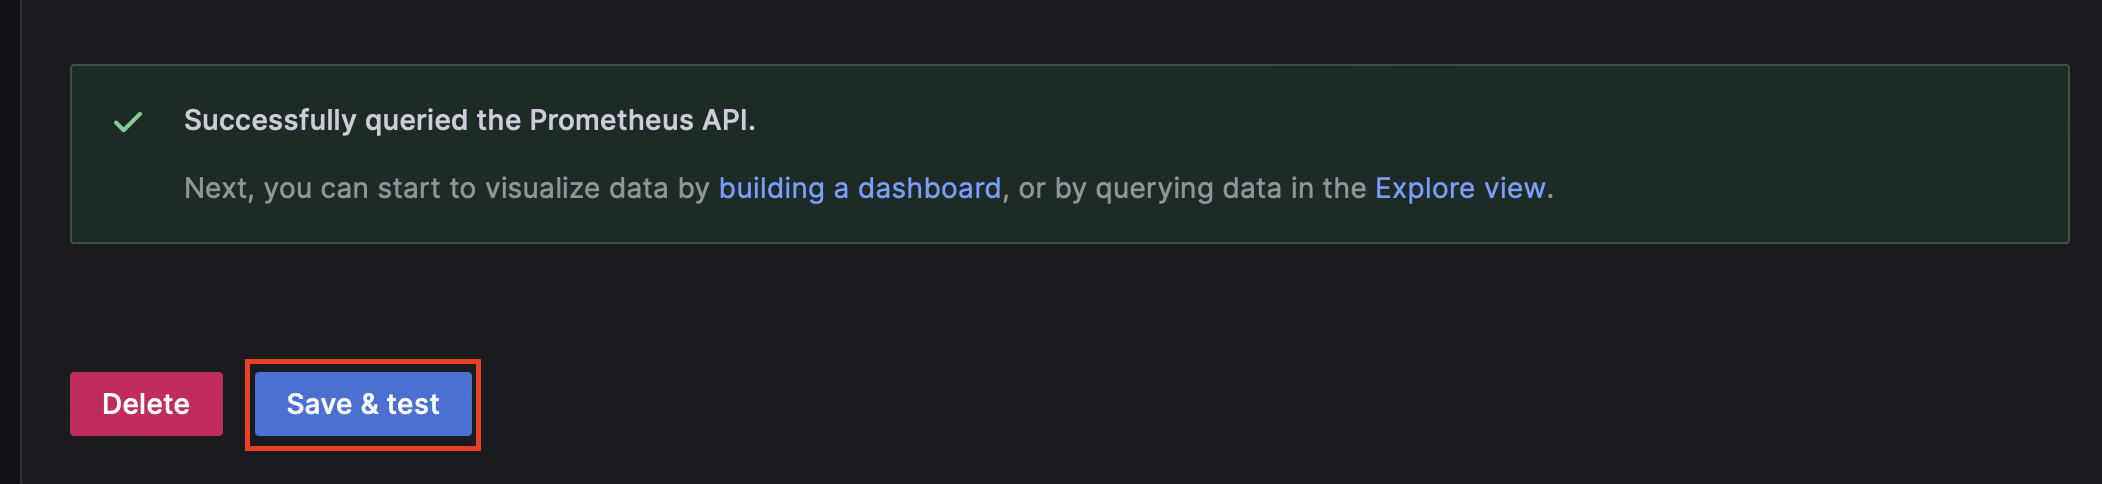
아래로 스크롤하여 Save & test 버튼을 클릭한 후 prometheus api 호출이 잘 되었다는 메시지가 나타나는 것을 확인합니다.
grafana의 datasources 부분에 prometheus 데이터소스를 추가할 수 있습니다.
metric/values.yaml
...
grafana:
podLabels:
app: grafana
persistence:
enabled: true
grafana.ini:
server:
root_url: 'http://localhost:3000/grafana/'
serve_from_sub_path: true
datasources:
datasources.yaml:
apiVersion: 1
datasources:
- name: Prometheus
type: prometheus
url: http://metric-prometheus-server.istio-system.svc.cluster.local
access: proxy
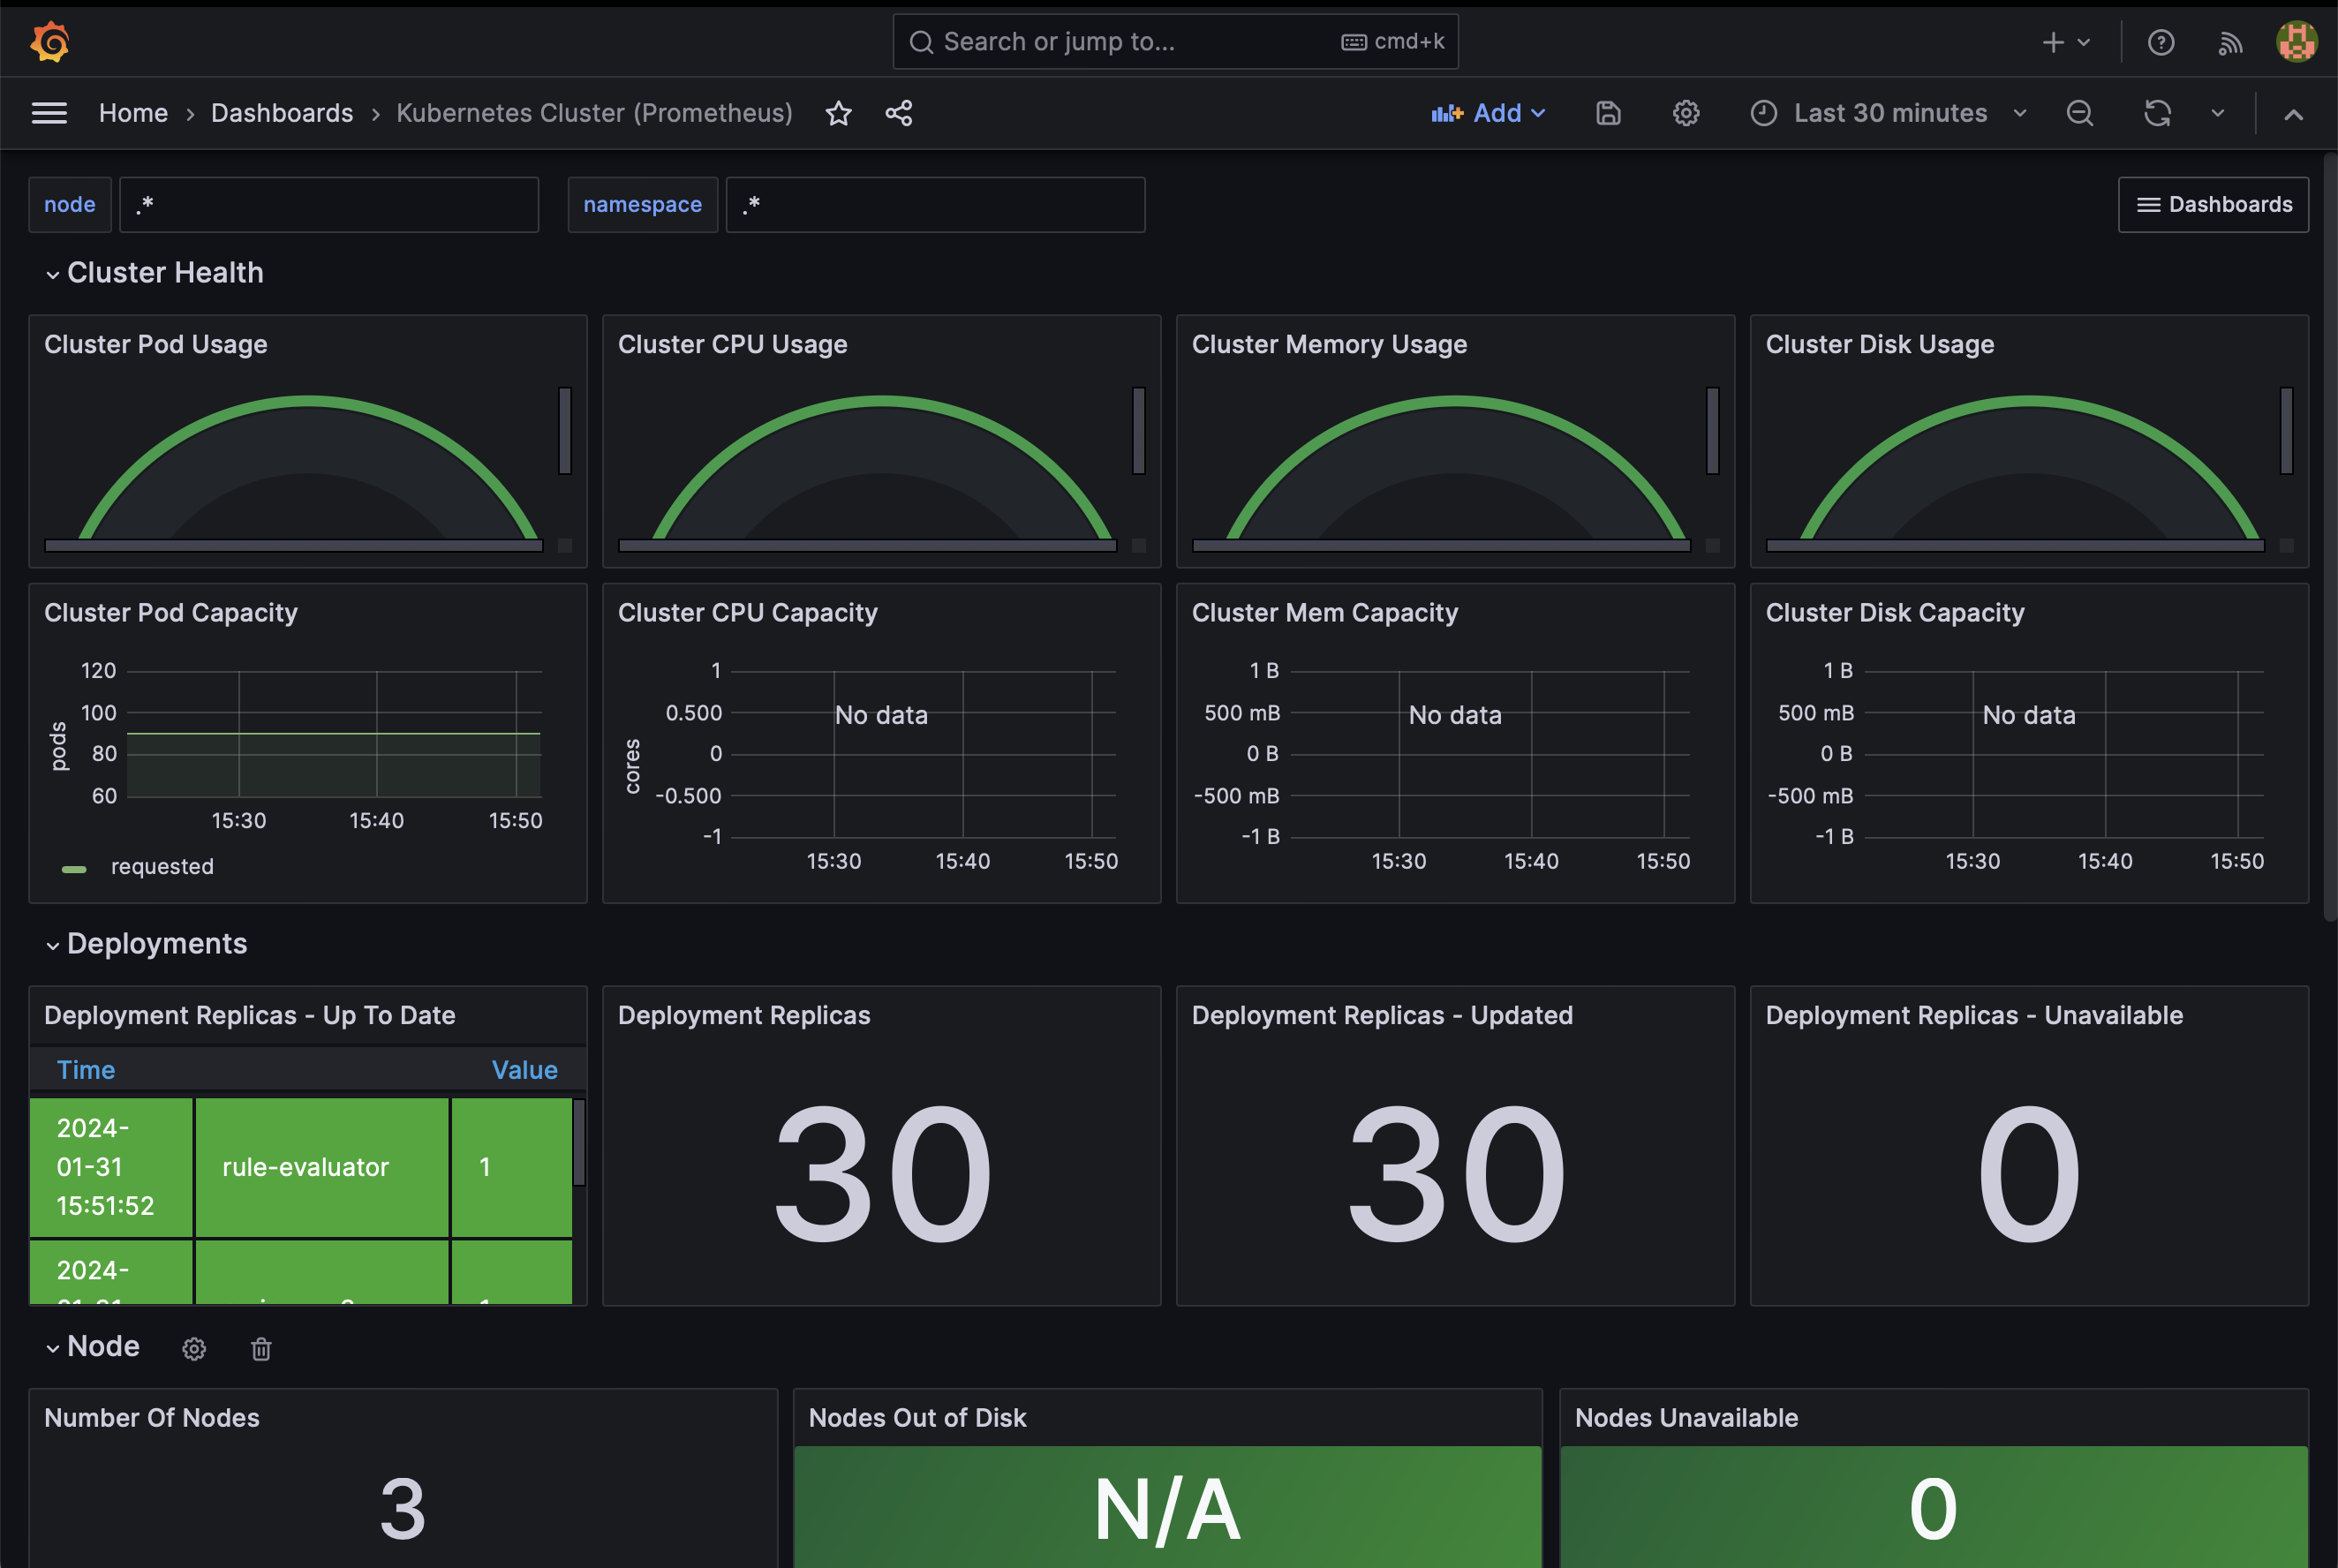
isDefault: true이제 대시보드를 하나 구성합니다.
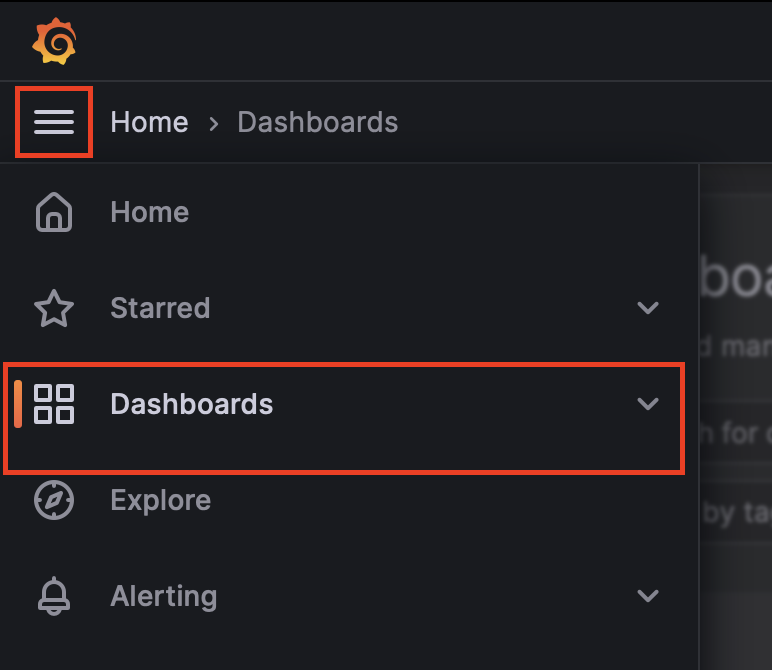
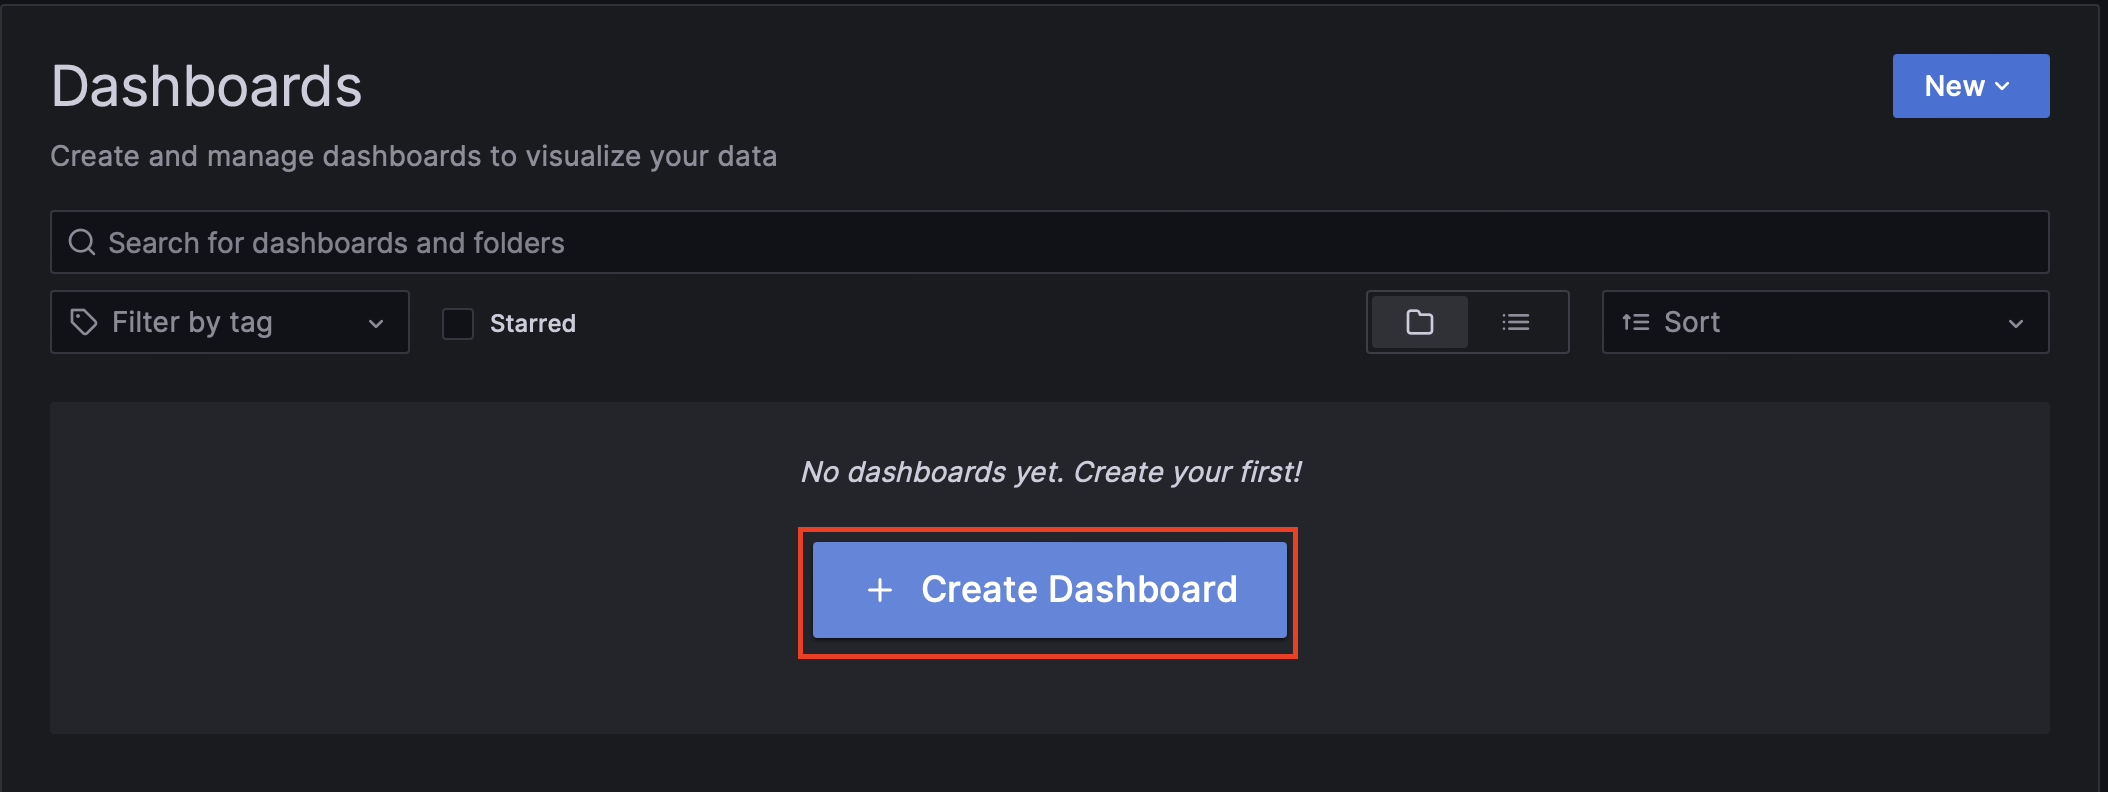
Dashboards 메뉴를 클릭한 다음 Create Dashboard 버튼을 클릭합니다.
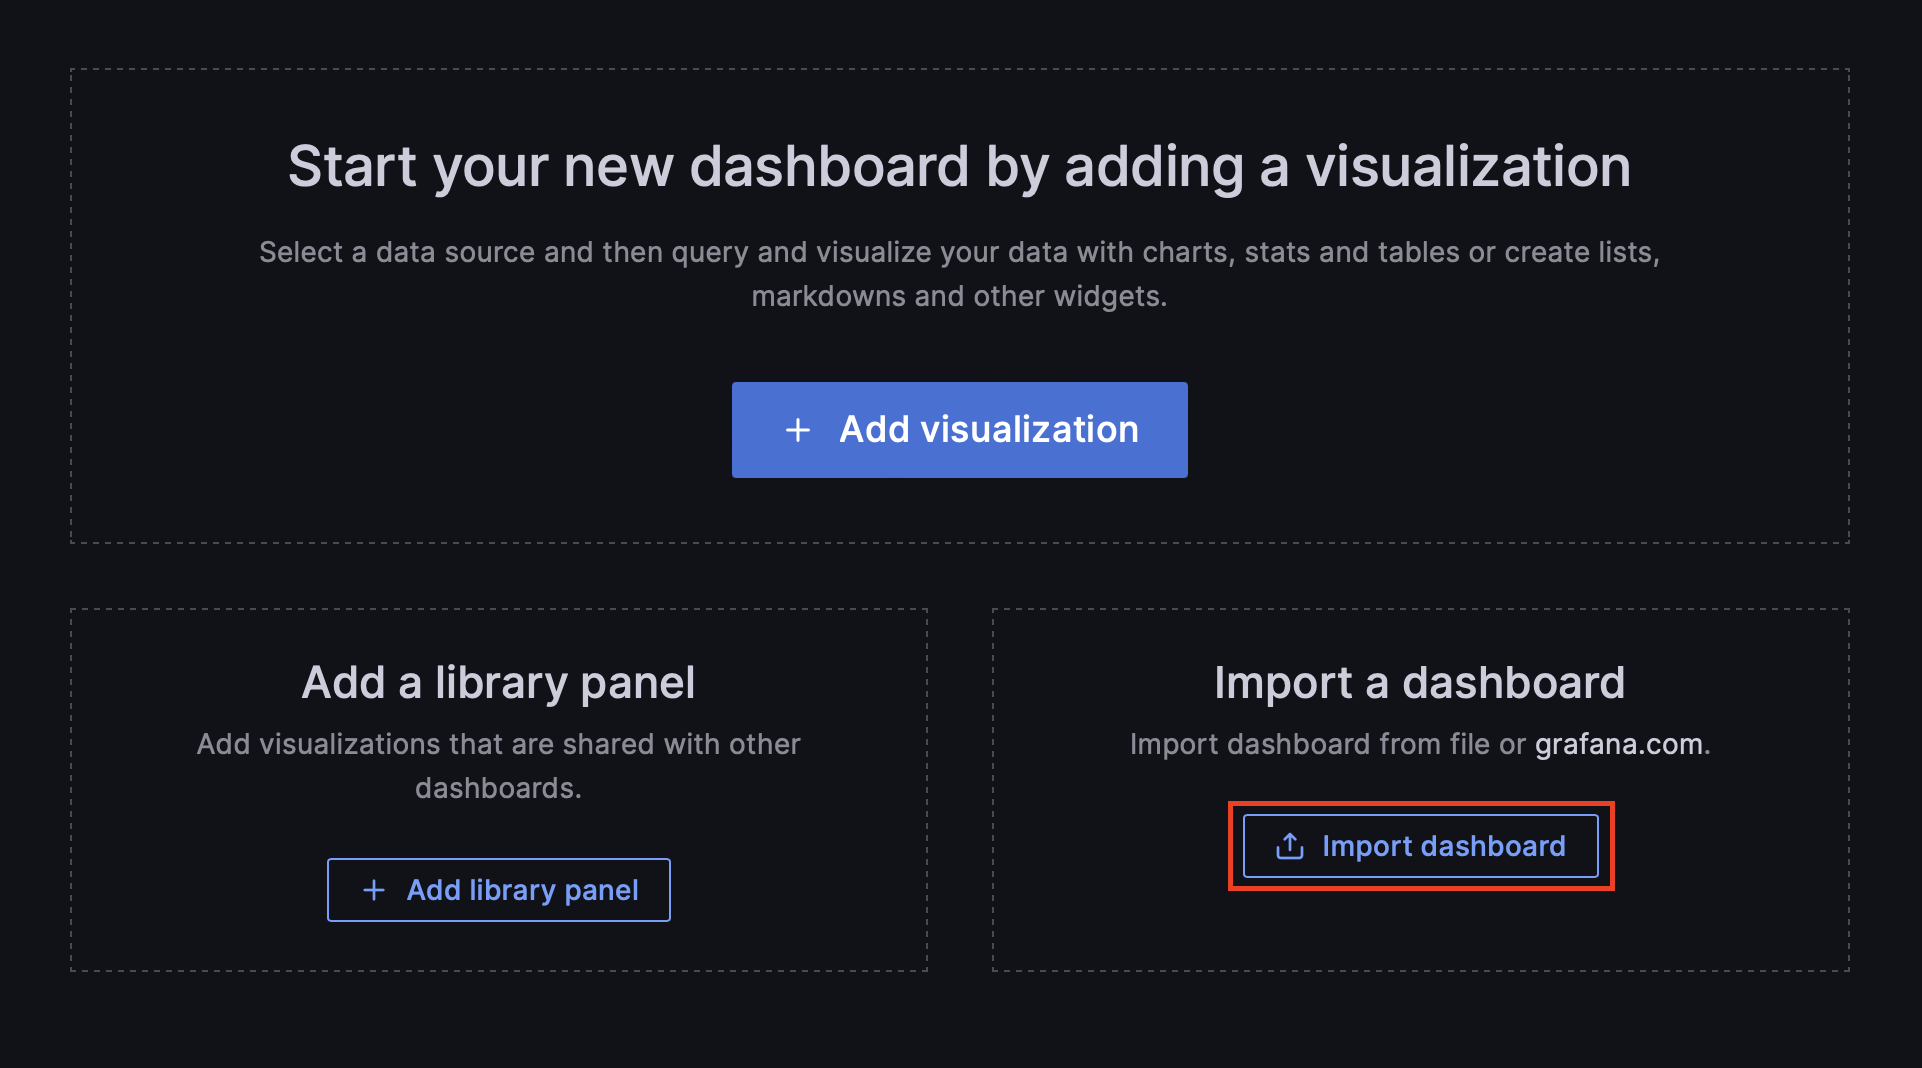
이미 구성되어 있는 grafana dashboard를 등록하겠습니다.
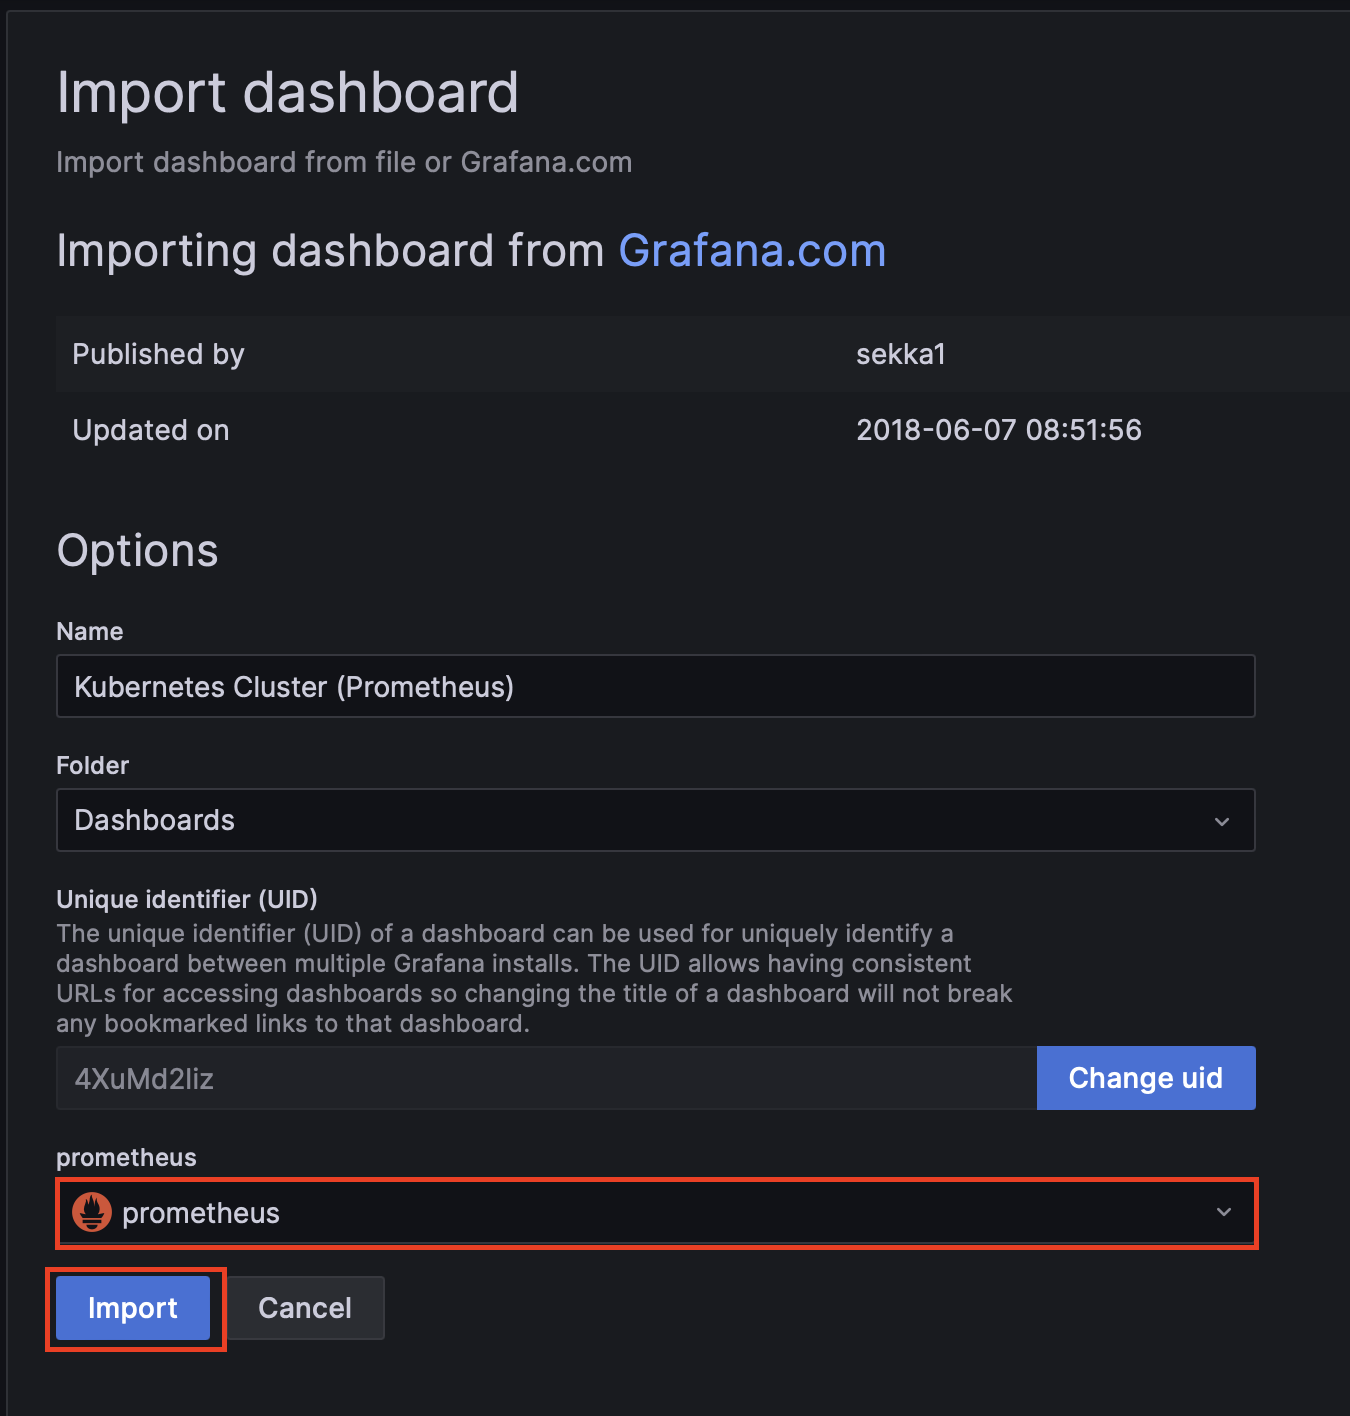
Import dashboard 버튼을 클릭합니다.
kubernetes cluster 대시보드의 아이디(6417)를 입력합니다.
🔗 https://grafana.com/grafana/dashboards/6417-kubernetes-cluster-prometheus/
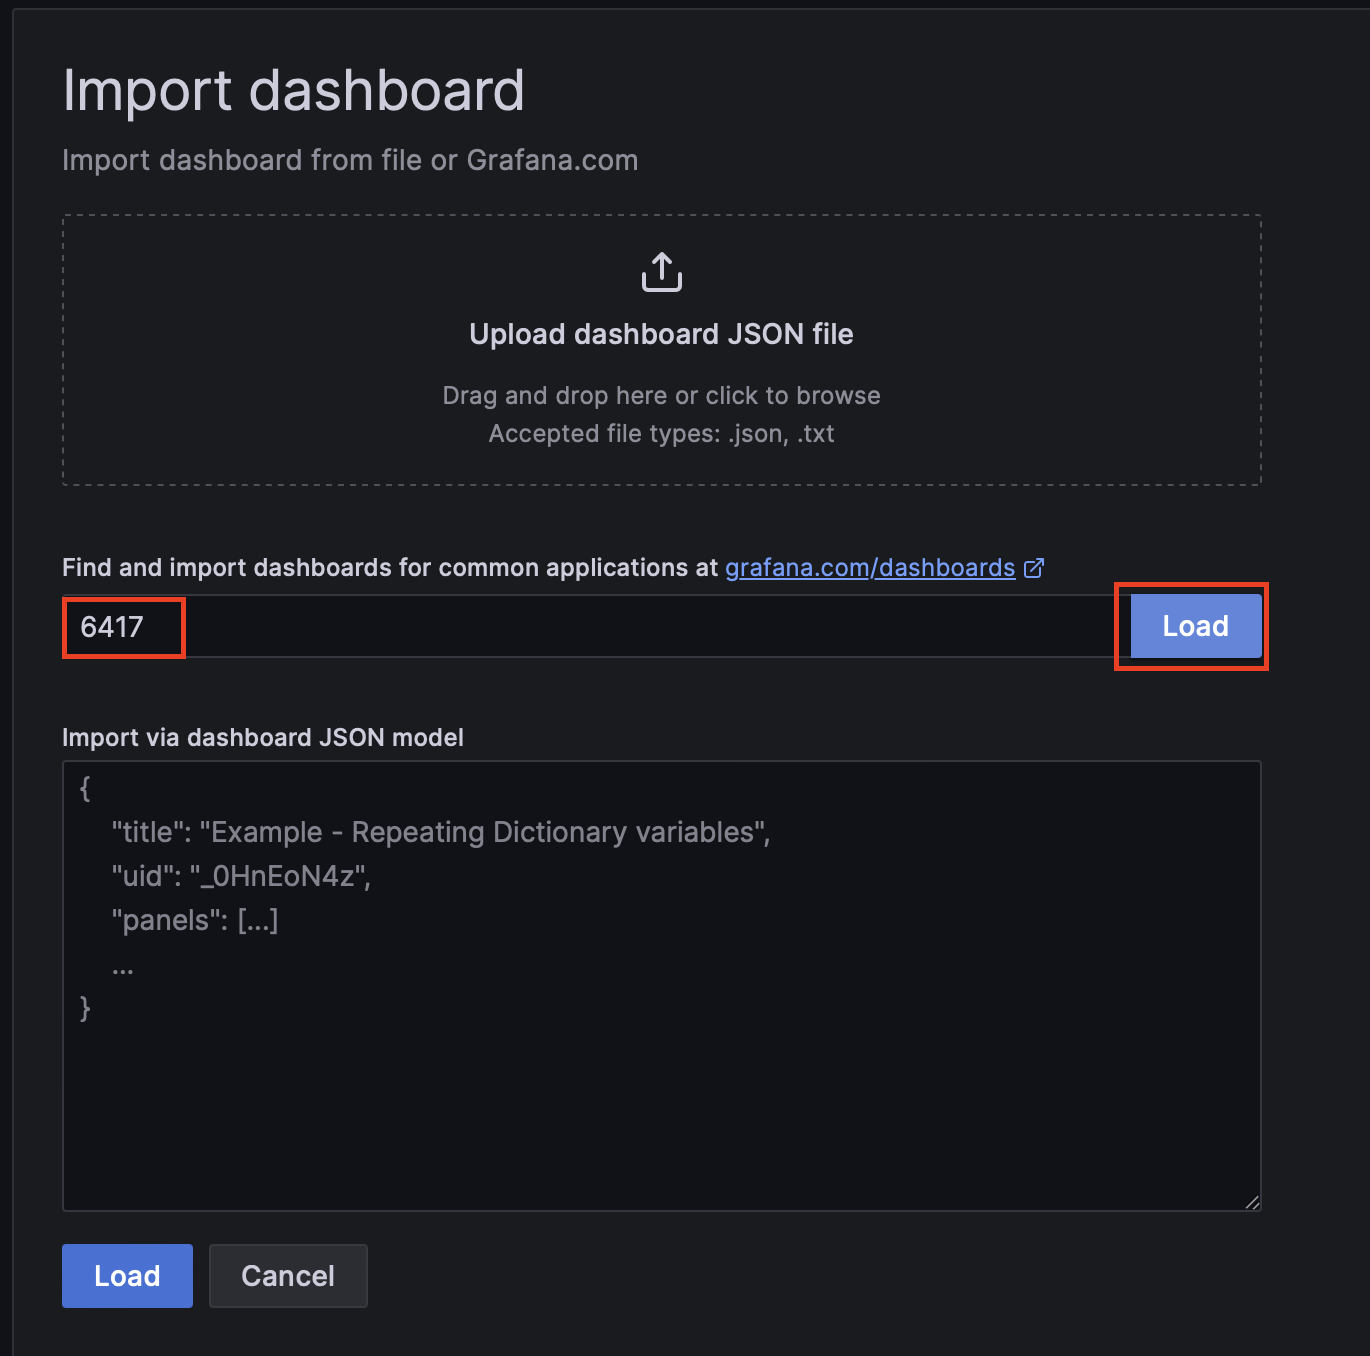
prometheus에 prometheus를 선택하고 Import를 클릭하여 대시보드를 구성합니다.
한편 argocd에 metric 애플리케이션에서 out of sync가 발생하는 것을 볼 수 있습니다.
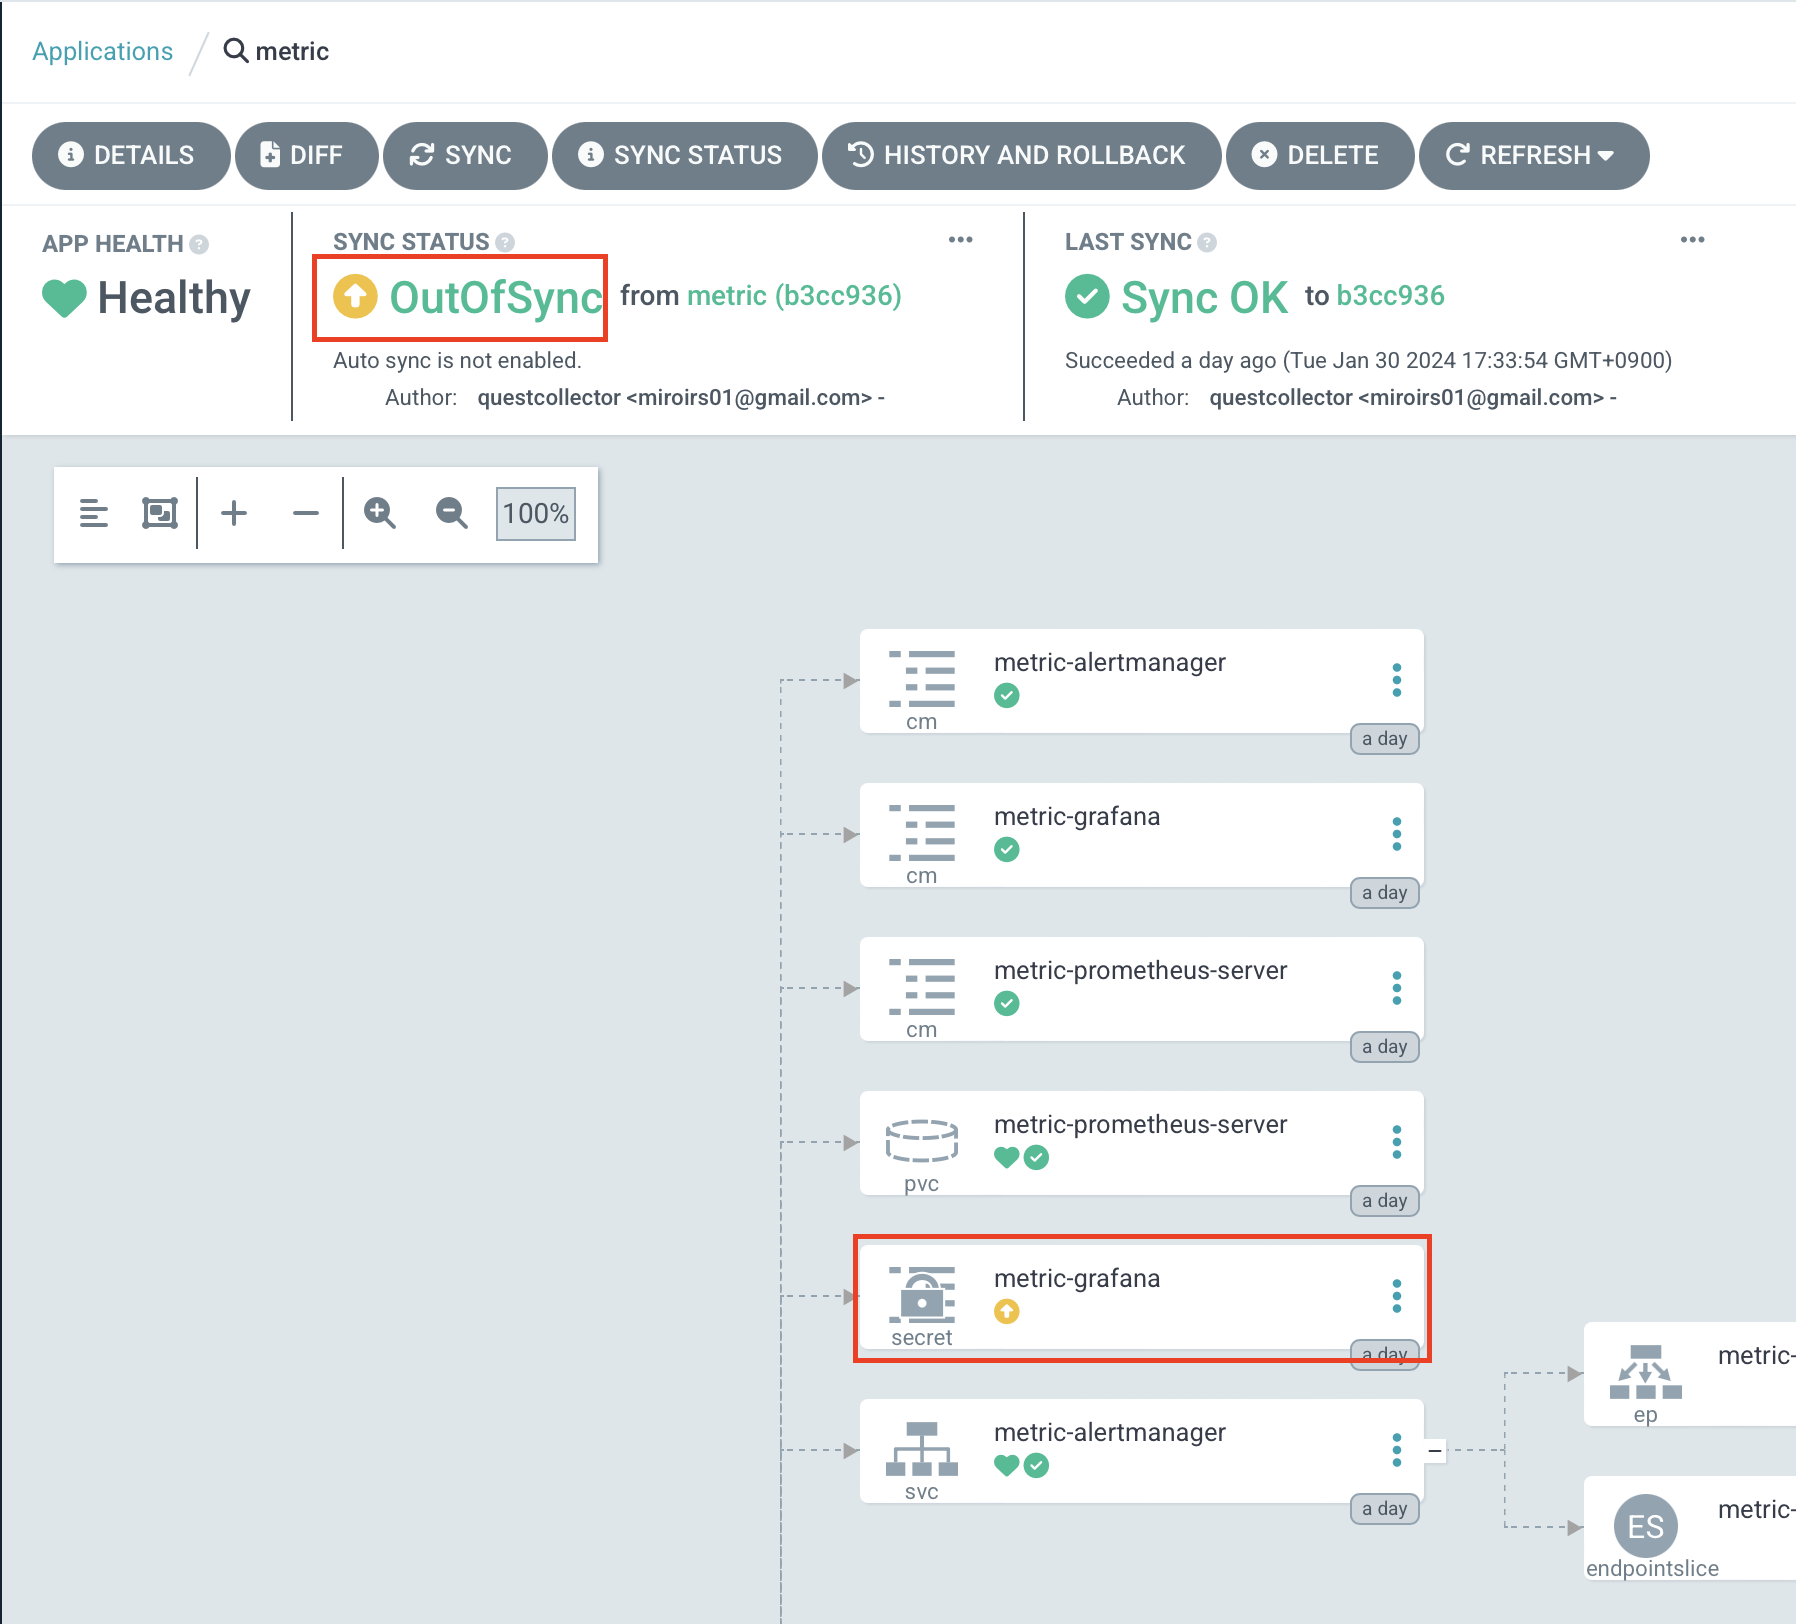
metric-grafana secret은 admin-password를 담고 있는데, 자원이 생성될 때 랜덤한 값이 만들어지기 때문에 정의된 차트의 구성과 다른 구성을 띄게 됩니다. 그리고 이를 참조하도록 만들어진 grafana deployment에서도 비슷한 문제를 확인할 수 있습니다.
이 부분을 무시하기 위해 ignoreDifference 부분을 metric 애플리케이션에 추가하도록 합니다.
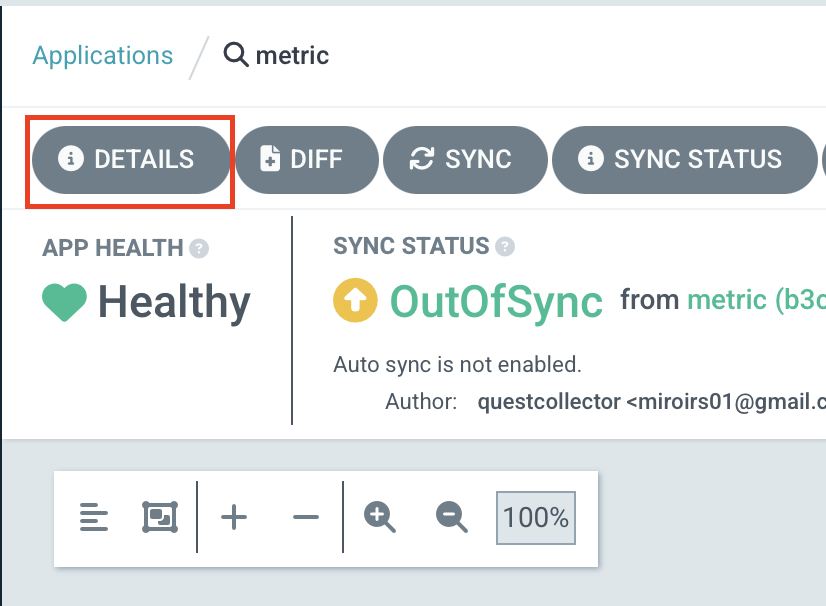
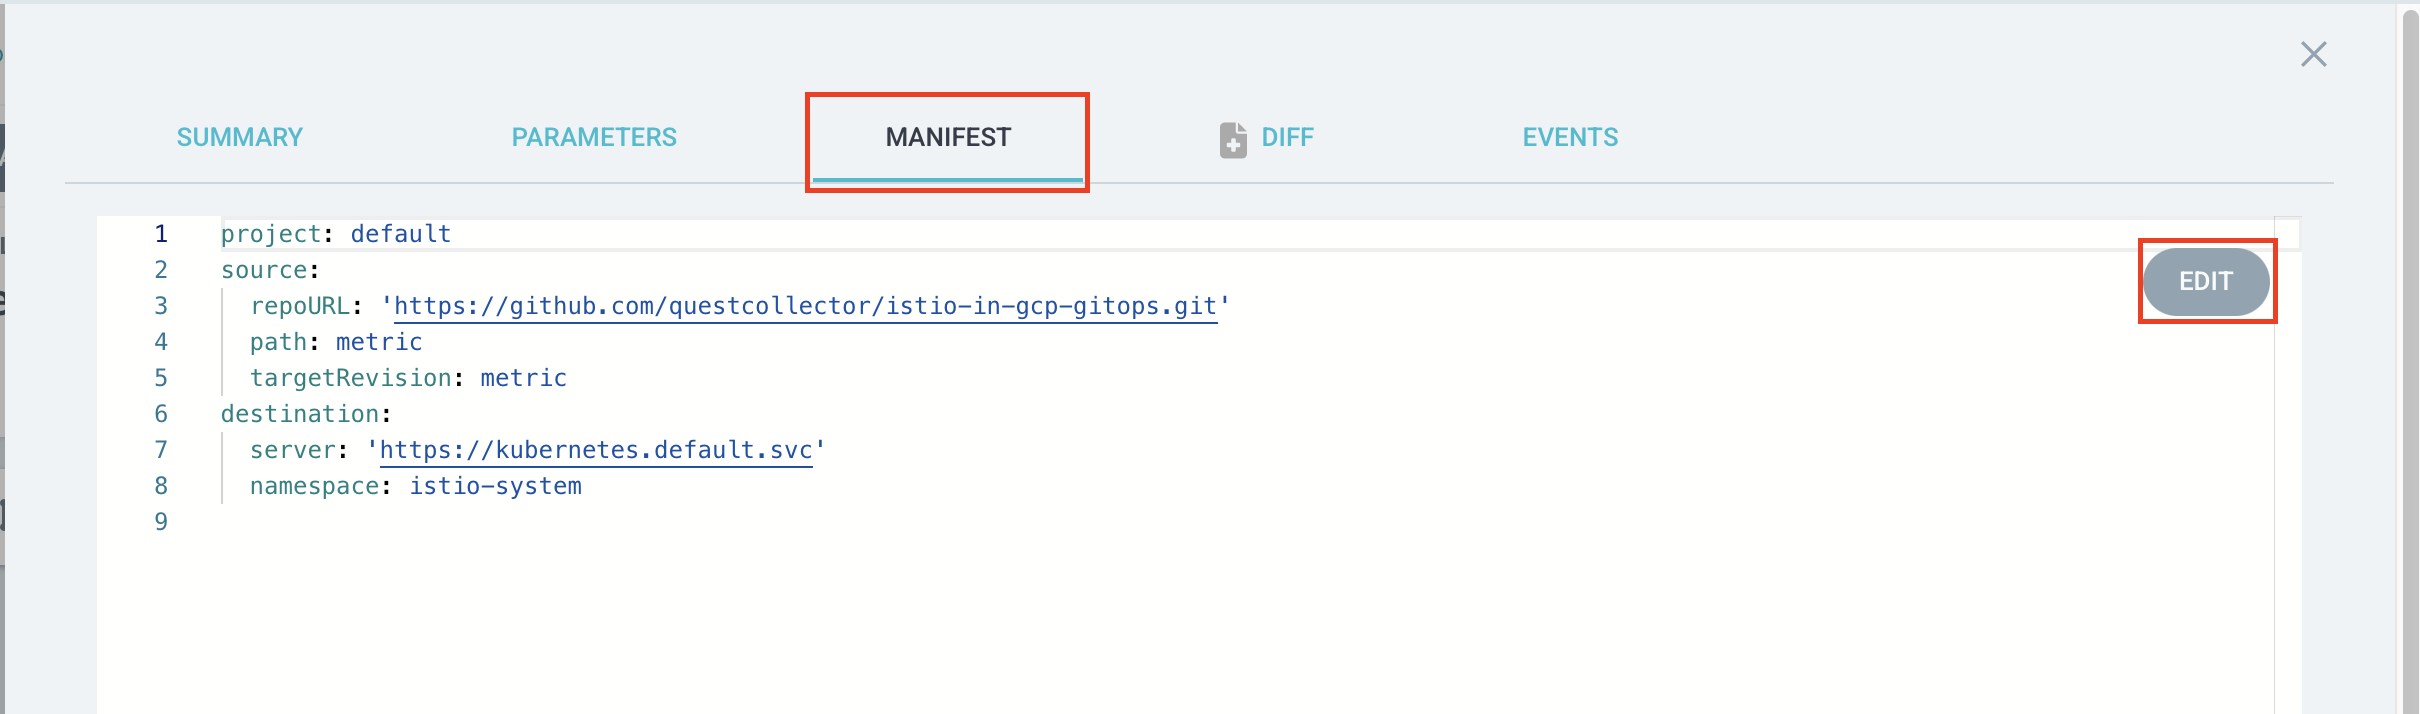
metric 애플리케이션의 DETAILS 버튼을 클릭한 다음 MANIFEST 탭에서 EDIT 버튼을 클릭합니다.
마지막 라인부터 아래 내용을 추가하고 SAVE 버튼을 클릭합니다.
ignoreDifferences:
  - kind: Secret
    name: metric-grafana
    jsonPointers:
      - /data/admin-password
  - group: apps
    kind: Deployment
    name: metric-grafana
    jsonPointers:
      - /spec/template/metadata/annotations/checksum~1secret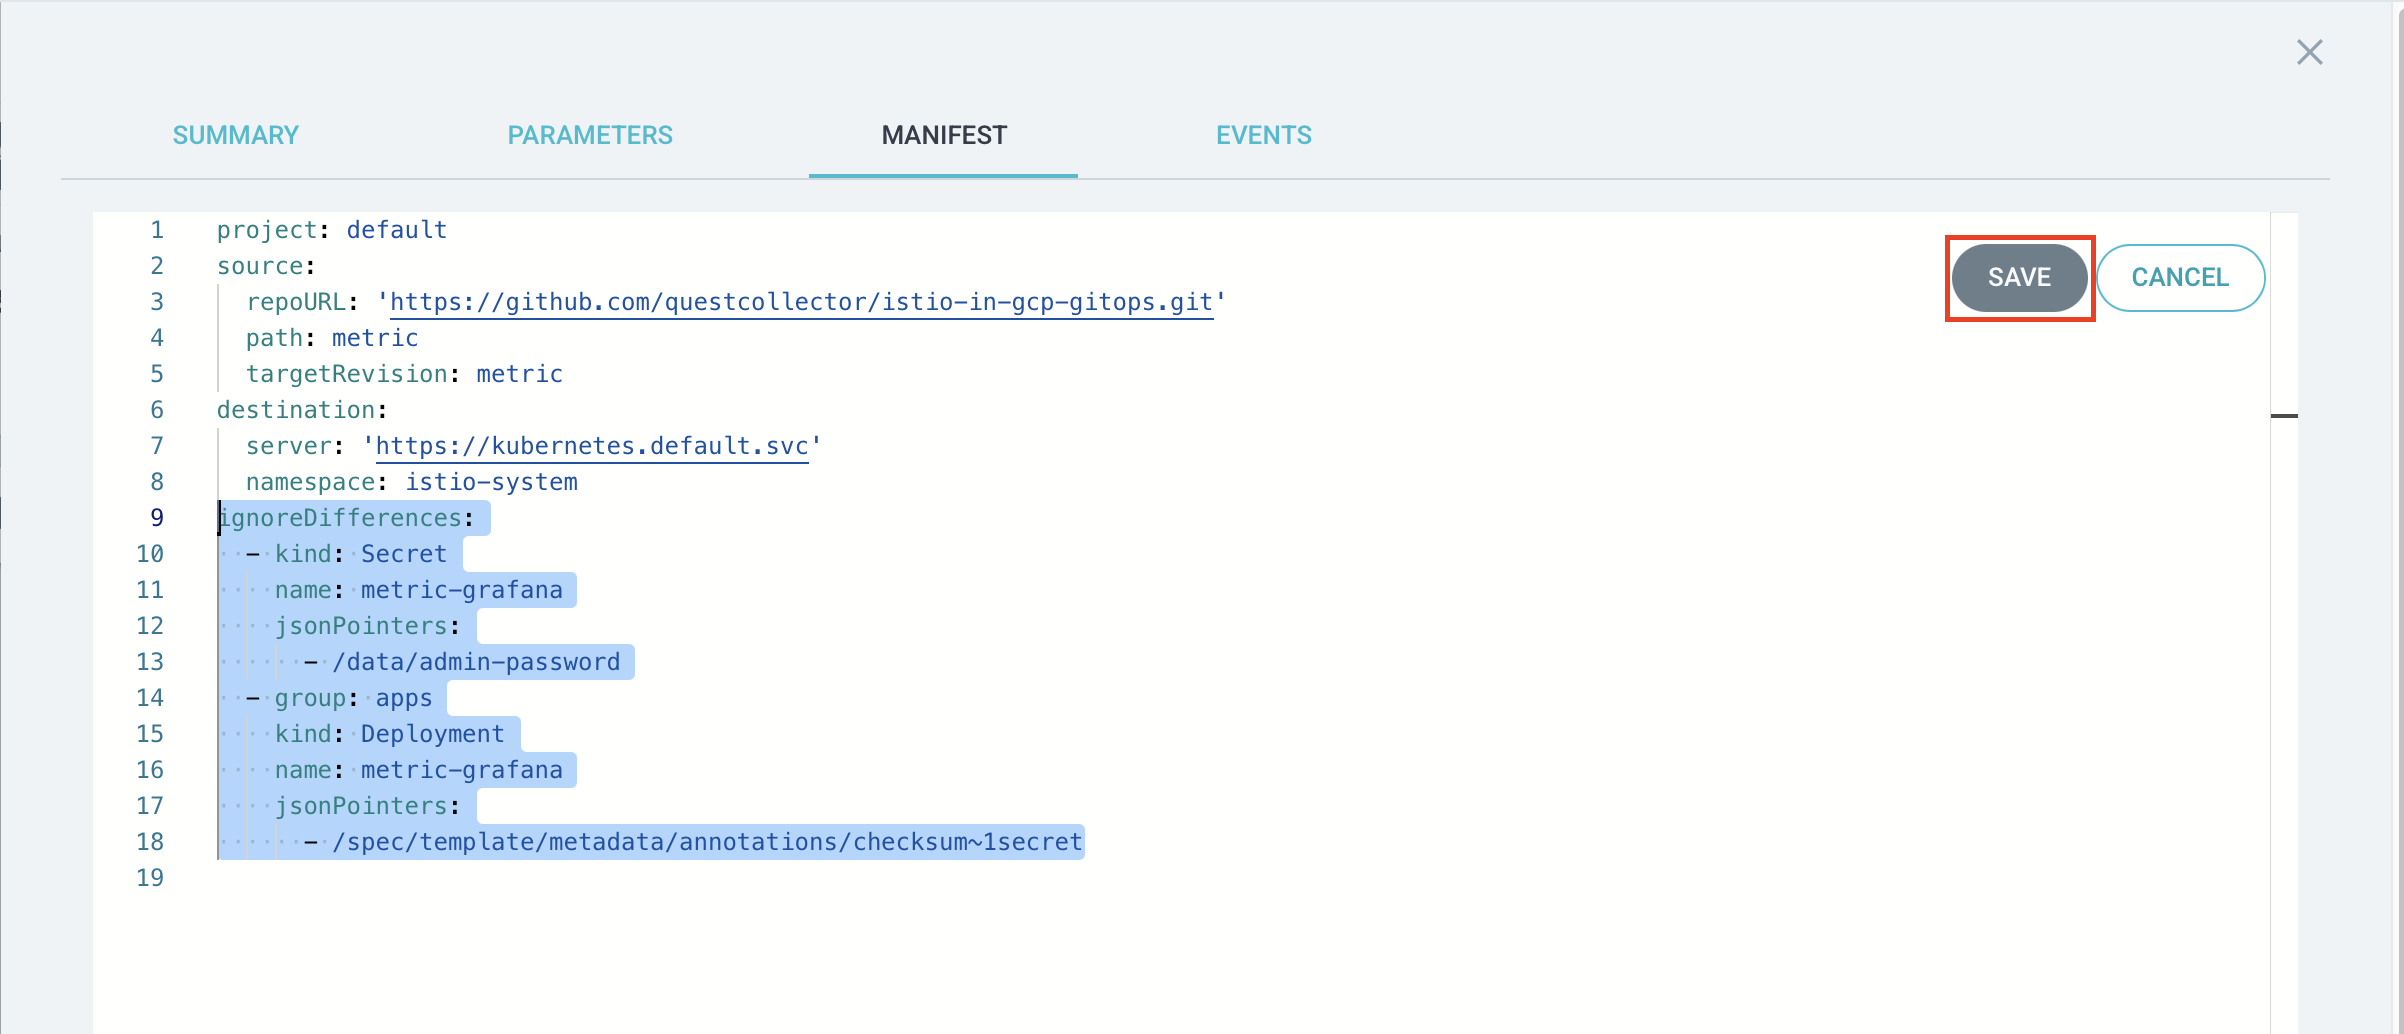
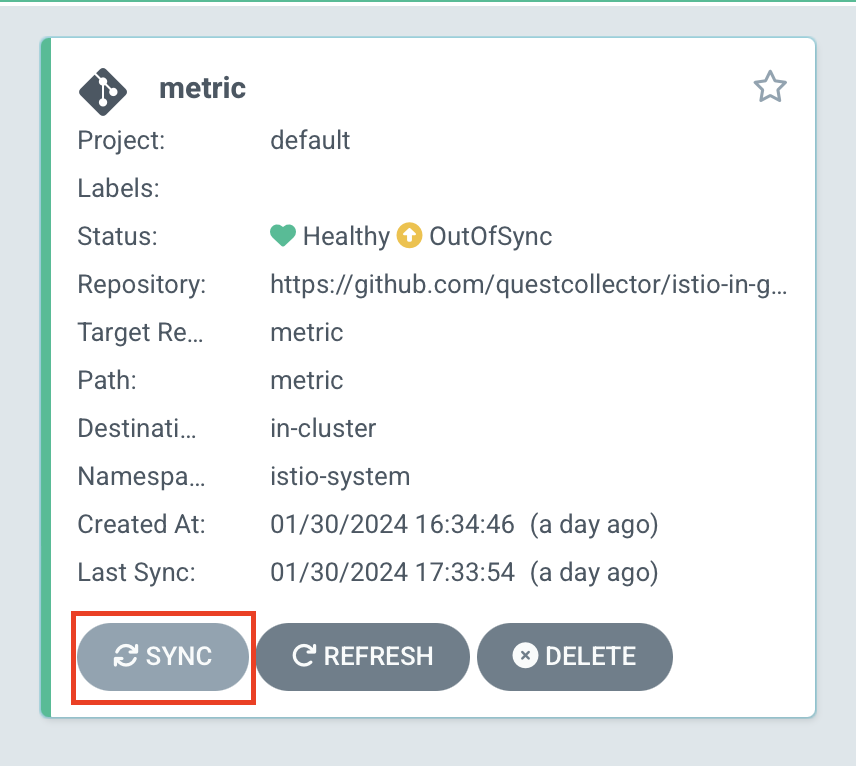
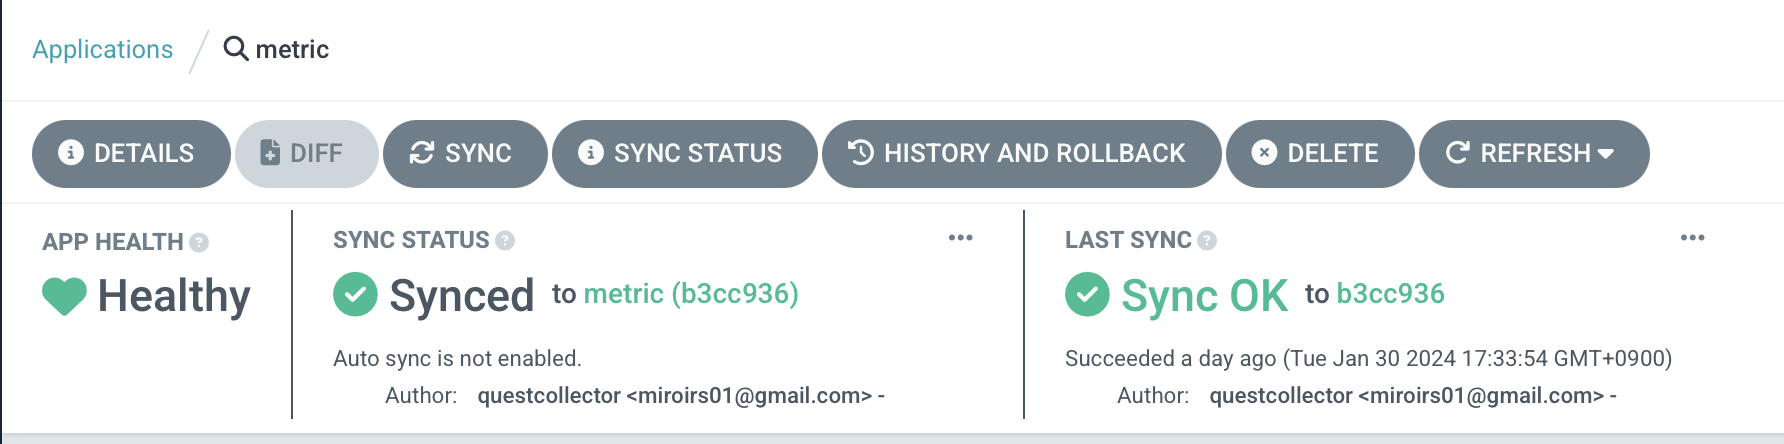
out of sync가 사라진 것을 확인할 수 있습니다.
jaeger 구성하기
jaeger도 마찬가지로 metric/charts 디렉토리에 서브차트를 구성하도록 하겠습니다.
cd ~/istio-in-gcp-gitops/metric/charts
helm repo add jaegertracing https://jaegertracing.github.io/helm-charts
helm pull jaegertracing/jaeger --untar
jaeger는 크게 collector, agent, query로 구성되는데
agent는 daemonset으로 노드마다 구성되어 collector로 로그들을 전송합니다.
query는 UI 서비스로 prometheus와 grafana와 마찬가지로 basePath를 지정할 수 있습니다.
일반적으로 cassandra 또는 elasticSearch, kafka를 기반으로 구동됩니다만, 이번 과정에서는 간단한 구성을 위해 메모리에 데이터를 저장하는 all-in-one 구조로 만들도록 하겠습니다.
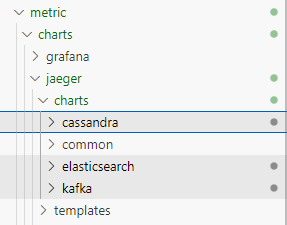
우선 jaeger 차트에서 subchart 중 cassandra, elasticsearch, kafka 차트를 삭제합니다.
metric 부모 차트의 values.yaml에 jaeger 서브차트에 대한 설정값들을 추가합니다.
all-in-one으로 구성하기 때문에 agent, collector, query 자원들을 따로 생성하지 않도록 enabled: false값을 부여합니다.
metric/values.yaml
...
jaeger:
  provisionDataStore:
    cassandra: false
  allInOne:
    enabled: true
    extraEnv:
    - name: QUERY_BASE_PATH
      value: /jaeger
    podLabels:
      app: jaeger
  storage:
    type: none
  agent:
    enabled: false
  collector:
    enabled: false
  query:
    enabled: false
그리고 metric-vs VirtualService에도 jaeger 설정을 추가하도록 하겠습니다.
metric/templates/metric-vs.yaml
apiVersion: networking.istio.io/v1alpha3
kind: VirtualService
metadata:
  name: metric-vs
  namespace: {{ .Release.Namespace }}
spec:
  hosts:
  - "*"
  gateways:
  - metric-gateway
  http:
  - name: jaeger
    match:
    - uri:
        exact: /jaeger
    - uri:
        prefix: /jaeger
    - uri:
        prefix: /js
    - uri:
        prefix: /static
    route:
    - destination:
        host: {{ include "metric.name" . }}-jaeger-query.{{ .Release.Namespace }}.svc.cluster.local
        port:
          number: 16686
  ...
그리고 istio에서 istiod의 meshConfig에도 jaeger-collector 서비스의 zipkin 포트와 함께 주소를 등록합니다.
🔗 https://istio.io/latest/docs/ops/integrations/jaeger/
istio/value.yaml
...
gateway:
  ...

istiod:
  meshConfig:
    defaultConfig:
      tracing:
        zipkin:
          address: metric-jaeger-collector.istio-system.svc:9411
이렇게 설정한 다음 다시 argocd에서 metric 애플리케이션을 sync합니다.
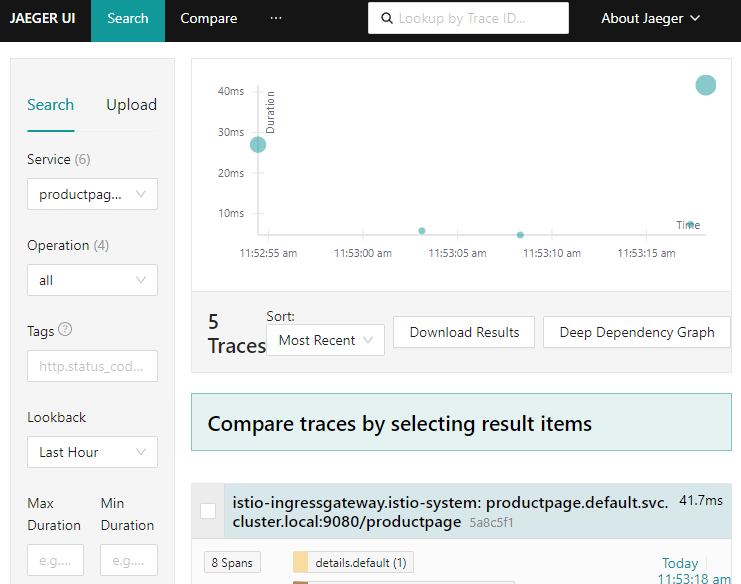
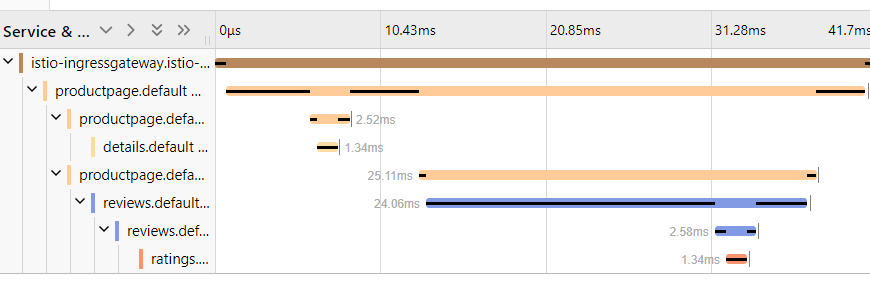
/productpage에 반복적으로 접속한 다음 도메인에 /jaeger 엔드포인트로 접속하면 jaeger query 서비스에서 샘플 애플리케이션의 트레이스 스팬을 확인할 수 있습니다.
kiali 구성하기
kiali도 마찬가지로 서브차트로 구성하도록 하겠습니다.
cd ~/istio-in-gcp-gitops/metric/charts
helm repo add kiali https://kiali.org/helm-charts
helm pull kiali/kiali-server --untar
kiali는 인증에 대해서 기본 설정으로 접속할 경우 ServiceAccount에서 토큰을 생성하여 접속합니다.
인증 과정을 생략하기 위해서는 auth.strategy 값으로 anonymous로 지정해야 합니다.
그리고 istio, jaeger, prometheus 등의 설정들도 추가합니다.
metric/values.yaml
...
kiali-server:
  auth:
    strategy: "anonymous"
  external_services:
    prometheus:
      url: http://metric-prometheus-server
    tracing:
      in_cluster_url: http://metric-jaeger-query/jaeger
    grafana:
      in_cluster_url: http://metric-grafana
    custom_dashboards:
      enabled: false
    istio:
      root_namespace: "istio-system"
...
argocd metric 애플리케이션의 ignoreDifference 부분에 kiali와 관련있는 부분을 추가하도록 합니다.
metric 애플리케이션의 DETAILS 버튼을 클릭한 다음 MANIFEST 탭에서 EDIT 버튼을 클릭합니다.
ignoreDifferences 하위에 아래 내용을 추가하고 SAVE 버튼을 클릭합니다.
ignoreDifferences:
...
  - kind: ConfigMap
    name: kiali
    jsonPointers:
      - /data/config.yaml
  - group: apps
    kind: Deployment
    name: kiali
    jsonPointers:
      - /spec/template/metadata/annotations/checksum~1config
이후 argocd에서 metric 애플리케이션을 sync하면 kiali-server가 생성됩니다.
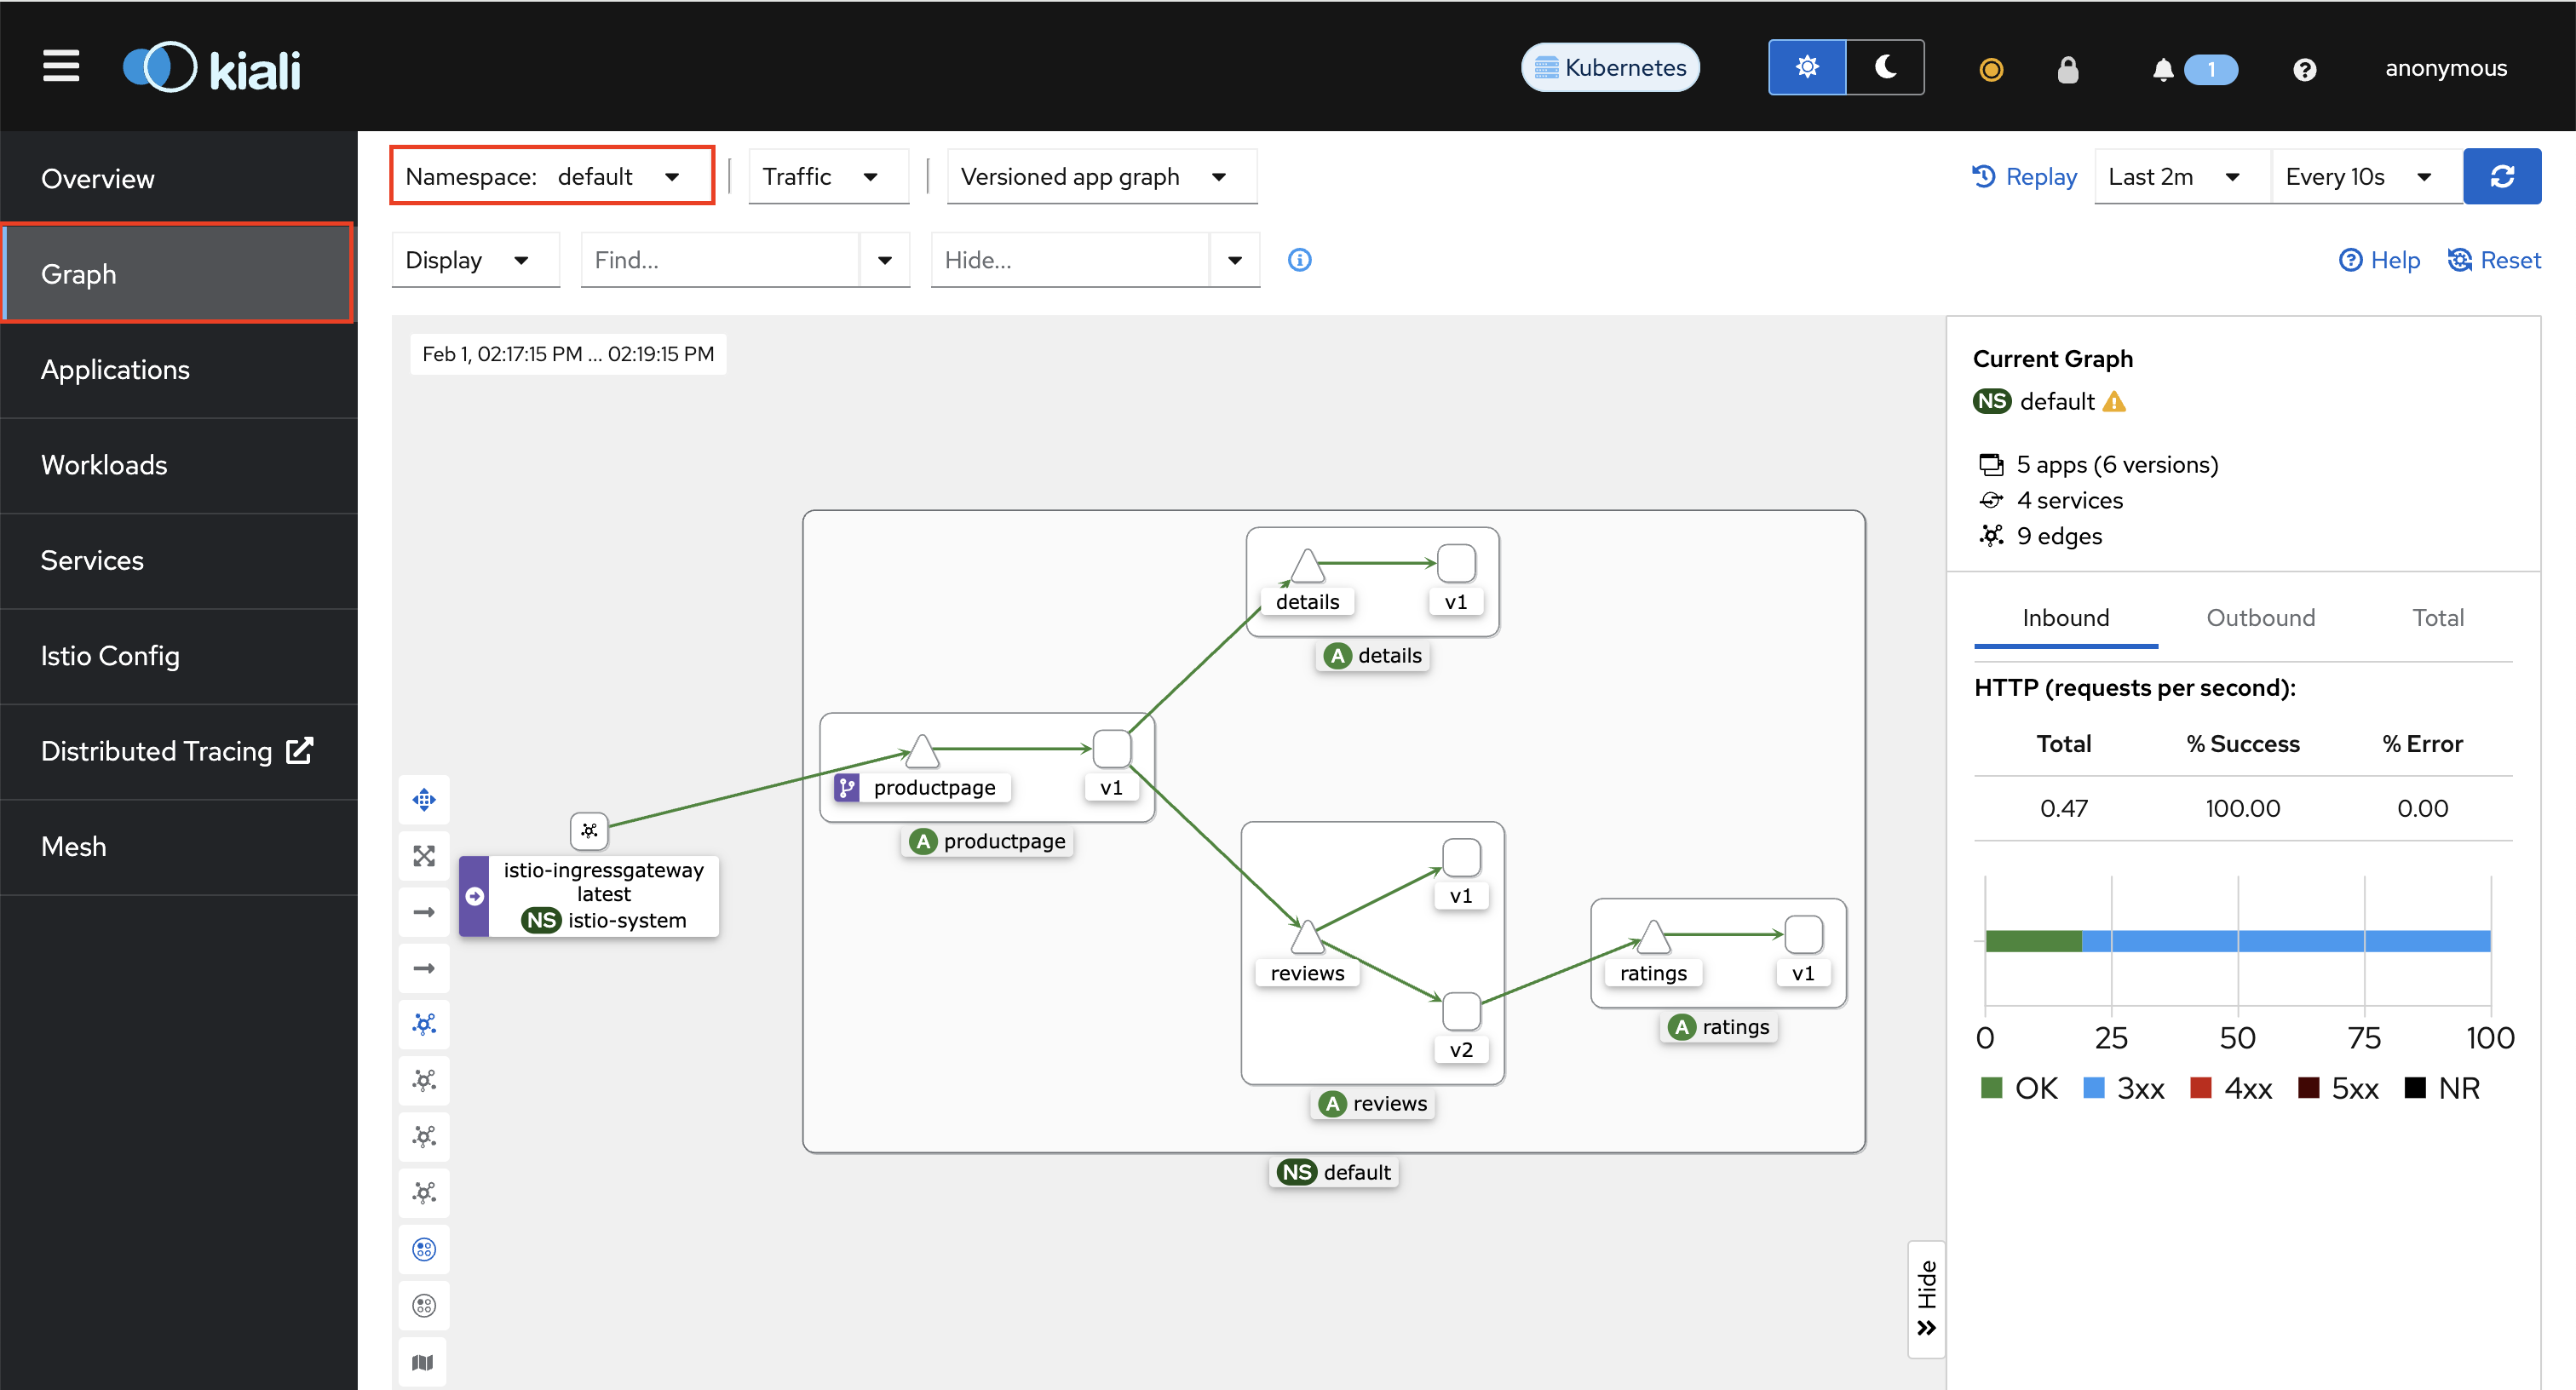
도메인에 /kiali 엔드포인트로 접속하면 kiali 서비스를 확인할 수 있습니다.
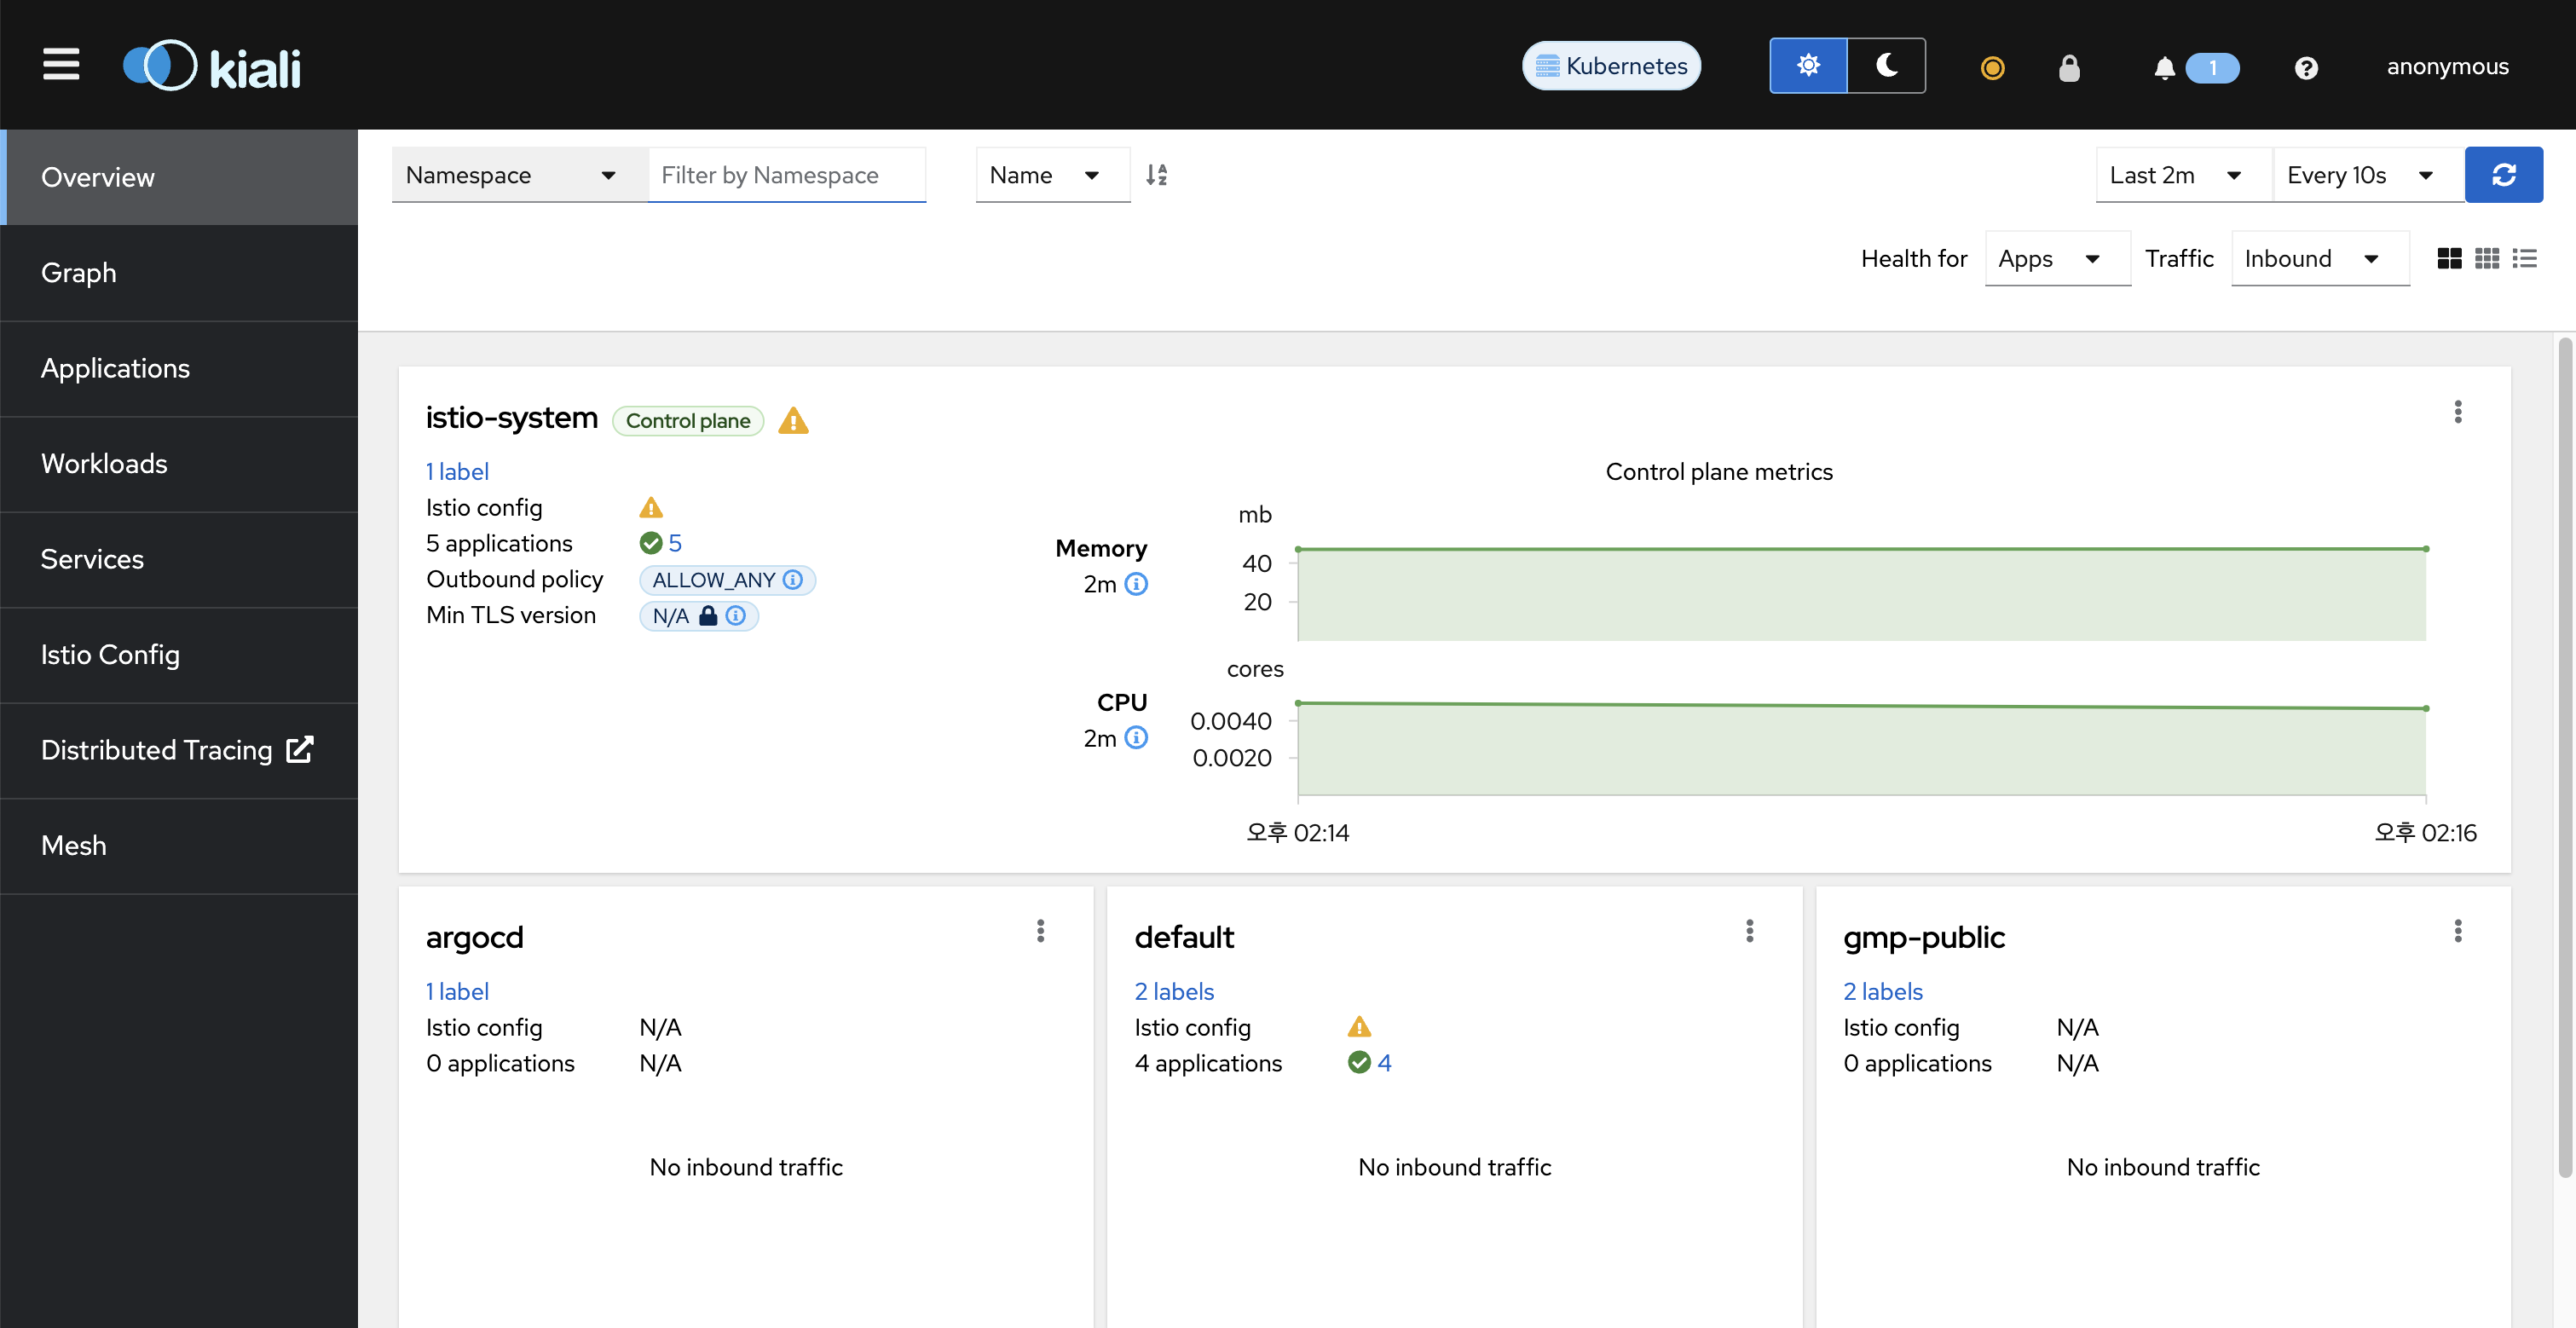
productpage에 수 차례 접속한 다음 Graph에서 default namespace를 지정하면 트래픽의 흐름도를 확인할 수 있습니다.