proc
리눅스 서버에 proc라는 특수한 디렉토리가 존재한다. 리눅스 매뉴얼에서는 커널의 자료구조에 접근할 수 있는 인터페이스를 제공하는 유사 파일 시스템(psuedo-filesystem)이라고 한다. 겉보기엔 파일 시스템 처럼 보이지만 실제로는 파일로 이루어지지 않았다는 뜻이다.
[ec2-user@ip-10-150-10-201 ~]$ ls /proc
1     1235  16920  2033   213    25     2608   27     27887  29916  3015   30449  30628  30742  30882  31593  32     3575  462   buddyinfo  execdomains  kmsg           mounts        swaps          zoneinfo
10    1236  17113  2034   21786  25018  26125  27093  27999  29930  30334  30450  30663  30743  30911  31602  32032  3676  468   bus        filesystems  kpagecgroup    mtrr          sys
11    1237  175    204    22     25084  26374  2730   28     29944  30352  30451  30665  30744  30922  31627  321    3708  6     cgroups    fs           kpagecount     net           sysrq-trigger
1176  1238  18     20476  2260   25561  26401  2754   28016  29958  30360  30452  30684  30745  30939  31636  324    3802  600   cmdline    interrupts   kpageflags     pagetypeinfo  sysvipc
12    1239  18690  205    23849  25608  26427  2758   28017  29964  30362  30453  30685  30752  30952  31653  3250   3881  648   consoles   iomem        latency_stats  partitions    thread-self
1227  13    18907  207    24     25826  26715  27604  2807   29996  30373  30585  30687  30778  30976  31654  3270   3986  676   cpuinfo    ioports      loadavg        sched_debug   timer_list
1228  1301  19     208    2442   25840  26747  2775   28079  30     30398  30591  30702  30807  31510  31686  329    3987  7     crypto     irq          locks          schedstat     tty
1231  14    19543  209    24455  26     26748  27811  2866   30060  30425  30593  30731  30818  31518  31689  33     4     8     devices    kallsyms     mdstat         self          uptime
1232  1435  2      21     2461   2603   26750  27812  2898   30065  30437  30607  30738  30836  31535  31690  3383   4081  8511  diskstats  kcore        meminfo        slabinfo      version
1233  15    20     210    2462   2604   26751  27813  2924   30066  30439  30617  30740  30848  31582  31823  3471   4251  9     dma        key-users    misc           softirqs      vmallocinfo
1234  16    2032   211    24874  26062  26906  27814  29902  30067  30448  30619  30741  30870  31591  31881  3573   4599  acpi  driver     keys         modules        stat          vmstat
cat /proc/cpuinfo 또는 cat /proc/meminfo를 해보면 free 명령어로 cpu를 모니터링 할 때와 같은 정보가 나오는데, 이는 free 명령어가 해당 정보를 바탕으로 출력해주고 있기 때문이다.
[ec2-user@ip-10-150-10-201 ~]$ cat /proc/cpuinfo
processor	: 0
vendor_id	: AuthenticAMD
cpu family	: 23
model		: 1
model name	: AMD EPYC 7571
stepping	: 2
microcode	: 0x800126c
cpu MHz		: 2545.324
cache size	: 512 KB
physical id	: 0
siblings	: 4
core id		: 0
cpu cores	: 2
apicid		: 0
initial apicid	: 0
fpu		: yes
fpu_exception	: yes
cpuid level	: 13
wp		: yes
flags		: fpu vme de pse tsc msr pae mce cx8 apic sep mtrr pge mca cmov pat pse36 clflush mmx fxsr sse sse2 ht syscall nx mmxext fxsr_opt pdpe1gb rdtscp lm constant_tsc rep_good nopl nonstop_tsc cpuid extd_apicid aperfmperf tsc_known_freq pni pclmulqdq ssse3 fma cx16 sse4_1 sse4_2 movbe popcnt aes xsave avx f16c rdrand hypervisor lahf_lm cmp_legacy cr8_legacy abm sse4a misalignsse 3dnowprefetch topoext vmmcall fsgsbase bmi1 avx2 smep bmi2 rdseed adx smap clflushopt sha_ni xsaveopt xsavec xgetbv1 clzero xsaveerptr arat npt nrip_save
bugs		: sysret_ss_attrs null_seg spectre_v1 spectre_v2 spec_store_bypass
bogomips	: 4399.80
TLB size	: 2560 4K pages
clflush size	: 64
cache_alignment	: 64
address sizes	: 48 bits physical, 48 bits virtual
power management:

processor	: 1
vendor_id	: AuthenticAMD
cpu family	: 23
model		: 1
model name	: AMD EPYC 7571
stepping	: 2
microcode	: 0x800126c
cpu MHz		: 2547.730
cache size	: 512 KB
physical id	: 0
siblings	: 4
core id		: 1
cpu cores	: 2
apicid		: 2
initial apicid	: 2
fpu		: yes
fpu_exception	: yes
cpuid level	: 13
wp		: yes
flags		: fpu vme de pse tsc msr pae mce cx8 apic sep mtrr pge mca cmov pat pse36 clflush mmx fxsr sse sse2 ht syscall nx mmxext fxsr_opt pdpe1gb rdtscp lm constant_tsc rep_good nopl nonstop_tsc cpuid extd_apicid aperfmperf tsc_known_freq pni pclmulqdq ssse3 fma cx16 sse4_1 sse4_2 movbe popcnt aes xsave avx f16c rdrand hypervisor lahf_lm cmp_legacy cr8_legacy abm sse4a misalignsse 3dnowprefetch topoext vmmcall fsgsbase bmi1 avx2 smep bmi2 rdseed adx smap clflushopt sha_ni xsaveopt xsavec xgetbv1 clzero xsaveerptr arat npt nrip_save
bugs		: sysret_ss_attrs null_seg spectre_v1 spectre_v2 spec_store_bypass
bogomips	: 4399.80
TLB size	: 2560 4K pages
clflush size	: 64
cache_alignment	: 64
address sizes	: 48 bits physical, 48 bits virtual
power management:

processor	: 2
vendor_id	: AuthenticAMD
cpu family	: 23
model		: 1
model name	: AMD EPYC 7571
stepping	: 2
microcode	: 0x800126c
cpu MHz		: 2548.958
cache size	: 512 KB
physical id	: 0
siblings	: 4
core id		: 0
cpu cores	: 2
apicid		: 1
initial apicid	: 1
fpu		: yes
fpu_exception	: yes
cpuid level	: 13
wp		: yes
flags		: fpu vme de pse tsc msr pae mce cx8 apic sep mtrr pge mca cmov pat pse36 clflush mmx fxsr sse sse2 ht syscall nx mmxext fxsr_opt pdpe1gb rdtscp lm constant_tsc rep_good nopl nonstop_tsc cpuid extd_apicid aperfmperf tsc_known_freq pni pclmulqdq ssse3 fma cx16 sse4_1 sse4_2 movbe popcnt aes xsave avx f16c rdrand hypervisor lahf_lm cmp_legacy cr8_legacy abm sse4a misalignsse 3dnowprefetch topoext vmmcall fsgsbase bmi1 avx2 smep bmi2 rdseed adx smap clflushopt sha_ni xsaveopt xsavec xgetbv1 clzero xsaveerptr arat npt nrip_save
bugs		: sysret_ss_attrs null_seg spectre_v1 spectre_v2 spec_store_bypass
bogomips	: 4399.80
TLB size	: 2560 4K pages
clflush size	: 64
cache_alignment	: 64
address sizes	: 48 bits physical, 48 bits virtual
power management:

processor	: 3
vendor_id	: AuthenticAMD
cpu family	: 23
model		: 1
model name	: AMD EPYC 7571
stepping	: 2
microcode	: 0x800126c
cpu MHz		: 2548.488
cache size	: 512 KB
physical id	: 0
siblings	: 4
core id		: 1
cpu cores	: 2
apicid		: 3
initial apicid	: 3
fpu		: yes
fpu_exception	: yes
cpuid level	: 13
wp		: yes
flags		: fpu vme de pse tsc msr pae mce cx8 apic sep mtrr pge mca cmov pat pse36 clflush mmx fxsr sse sse2 ht syscall nx mmxext fxsr_opt pdpe1gb rdtscp lm constant_tsc rep_good nopl nonstop_tsc cpuid extd_apicid aperfmperf tsc_known_freq pni pclmulqdq ssse3 fma cx16 sse4_1 sse4_2 movbe popcnt aes xsave avx f16c rdrand hypervisor lahf_lm cmp_legacy cr8_legacy abm sse4a misalignsse 3dnowprefetch topoext vmmcall fsgsbase bmi1 avx2 smep bmi2 rdseed adx smap clflushopt sha_ni xsaveopt xsavec xgetbv1 clzero xsaveerptr arat npt nrip_save
bugs		: sysret_ss_attrs null_seg spectre_v1 spectre_v2 spec_store_bypass
bogomips	: 4399.80
TLB size	: 2560 4K pages
clflush size	: 64
cache_alignment	: 64
address sizes	: 48 bits physical, 48 bits virtual
power management:
proc에서 알 수 있는 것은 메모리 사용량뿐만이 아니라 CPU 사용량, 디스크 I/O 사용량 등 대부분의 서버 모니터링 지표가 존재한다.
/proc/stat의 내용을 가지고 cpu 사용량을 계산할 수 있는데 솔직히 이걸 어떻게 활용해야하는지 감이 잘 오지 않는다. 뭔가.. 성능 최적화를 위해 cpu 사용에 관해 더 디테일하게 분석할때 쓸법한 것같다.
/proc/stat
[ec2-user@ip-10-150-10-201 ~]$ cat /proc/stat
cpu  2207862577 162529 334193373 32933489866 22559422 0 7267232 2055142 0 0
cpu0 518931567 33066 82478775 8270210426 2499777 0 2108826 360211 0 0
cpu1 551436043 50113 83739727 8236892295 2241257 0 1971501 375092 0 0
cpu2 583800353 46623 84659666 8197639367 8668968 0 1599364 658453 0 0
cpu3 553694613 32726 83315203 8228747776 9149419 0 1587540 661385 0 0
intr 33177268316 73 11 0 0 434 0 0 0 0 0 0 0 88 0 0 0 0 0 0 0 0 0 0 0 27208686 248704754 246209207 24516648 88992001 893589861 859614620 858707995 860536256 0 0 0 0 0 0 0 0 0 0 0 0 0 0 0 0 0 0 0 0 0 0 0 0 0 0 0 0 0 0 0 0 0 0 0 0 0 0 0 0 0 0 0 0 0 0 0 0 0 0 0 0 0 0 0 0 0 0 0 0 0 0 0 0 0 0 0 0 0 0 0 0 0 0 0 0 0 0 0 0 0 0 0 0 0 0 0 0 0 0 0 0 0 0 0 0 0 0 0 0 0 0 0 0 0 0 0 0 0 0 0 0 0 0 0 0 0 0 0 0 0 0 0 0 0 0 0 0 0 0 0 0 0 0 0 0 0 0 0 0 0 0 0 0 0 0 0 0 0 0 0 0 0 0 0 0 0 0 0 0 0 0 0 0 0 0 0 0 0 0 0 0 0 0 0 0 0 0 0 0 0 0 0 0 0 0 0 0 0 0 0 0 0 0 0 0 0 0 0 0 0 0 0 0 0 0 0 0 0 0 0 0 0 0 0 0 0 0 0 0 0 0 0 0 0 0 0 0 0 0 0 0 0 0 0 0 0 0 0 0 0 0 0 0 0 0 0 0 0 0 0 0 0 0 0 0 0 0 0 0 0 0 0 0 0 0 0 0 0 0 0 0 0 0 0 0 0 0 0 0 0 0 0 0 0 0 0 0 0 0 0 0 0 0 0 0 0 0 0 0 0 0 0 0 0 0 0 0 0 0 0 0 0 0 0 0 0 0 0 0 0 0 0 0 0 0 0 0 0 0 0 0 0 0 0 0 0 0 0 0 0 0 0 0 0 0 0 0 0 0 0 0 0 0 0 0 0 0 0 0 0 0 0 0 0 0 0 0 0 0 0 0 0 0 0 0 0 0 0 0 0 0 0 0 0 0 0 0 0 0 0 0 0 0 0 0 0 0 0 0 0 0 0 0 0 0 0 0 0 0 0 0 0 0 0 0 0 0 0 0 0 0 0
ctxt 191626620249
btime 1619668612
processes 318670200
procs_running 2
procs_blocked 0
softirq 19060367095 0 62514692 16751636 3233653984 0 0 86833 2250509064 0 611948998
왼쪽부터..
user: 유저 모드에서 사용한 시간.
nice: 유저 모드에서 우선순위가 낮은 프로세스에 사용한 시간.
system: system에서 사용한 시간.
idle: cpu가 사용되지 않은 시간.
iowait: 입출력이 끝날 때까지 대기하던 시간.
irq: 하드웨어 인터럽트에 사용한 시간.
softirq: 소프트웨어 인터럽트에 사용한 시간.
steal: 리눅스가 VM에서 실행되고 있을 때 같은 물리 장비를 사용하는 다른 VM이 사용한 시간.
guest: 버추얼박스 등을 이용해 VM을 만들었을 때 guest VM의 가상 CPU에서 사용한 시간.
guest_nice: guest VM의 가상 CPU에서 우선순위가 낮은 프로세스에 사용한 시간.
uname
[ec2-user@gitlab-primary ~]$ uname -a
Linux gitlab-primary 5.10.186-179.751.amzn2.x86_64 #1 SMP Tue Aug 1 20:51:38 UTC 2023 x86_64 x86_64 x86_64 GNU/Linux
Linux: 커널 명
gitlab-primary: 호스트 명
5.10.186-179.751.amzn2.x86_64: 커널 릴리즈 정보
#1 SMP Tue Aug 1 20:51:38 UTC 2023: 커널 버전
x86_64: 머신 하드웨어 이름
x86_64: 프로세서 종류
x86_64: 하드웨어 플랫폼
GNU/Linux: 운영체제
uname --help
[ec2-user@gitlab-primary ~]$ uname --help
Usage: uname [OPTION]...
Print certain system information.  With no OPTION, same as -s.

  -a, --all                print all information, in the following order,
                             except omit -p and -i if unknown:
  -s, --kernel-name        print the kernel name
  -n, --nodename           print the network node hostname
  -r, --kernel-release     print the kernel release
  -v, --kernel-version     print the kernel version
  -m, --machine            print the machine hardware name
  -p, --processor          print the processor type or "unknown"
  -i, --hardware-platform  print the hardware platform or "unknown"
  -o, --operating-system   print the operating system
      --help     이 도움말을 표시하고 끝냅니다
      --version  버전 정보를 출력하고 끝냅니다

GNU coreutils online help: <http://www.gnu.org/software/coreutils/>
Report uname translation bugs to <http://translationproject.org/team/>
For complete documentation, run: info coreutils 'uname invocation'

[ec2-user@gitlab-primary ~]$ uname -s
Linux
[ec2-user@gitlab-primary ~]$ uname -n
gitlab-primary
[ec2-user@gitlab-primary ~]$ uname -r
5.10.186-179.751.amzn2.x86_64
[ec2-user@gitlab-primary ~]$ uname -v
#1 SMP Tue Aug 1 20:51:38 UTC 2023
[ec2-user@gitlab-primary ~]$ uname -m
x86_64
[ec2-user@gitlab-primary ~]$ uname -p
x86_64
[ec2-user@gitlab-primary ~]$ uname -i
x86_64
[ec2-user@gitlab-primary ~]$ uname -o
GNU/Linux
[ec2-user@gitlab-primary ~]$
ifconfig
네트워크에 대한 기본 모니터링이다.
[ec2-user@gitlab-primary ~]$ ifconfig
br-a0d0801db6fd: flags=4163<UP,BROADCAST,RUNNING,MULTICAST>  mtu 1500
        inet 172.18.0.1  netmask 255.255.0.0  broadcast 172.18.255.255
        inet6 fe80::42:36ff:fea3:ed8a  prefixlen 64  scopeid 0x20<link>
        ether 02:42:36:a3:ed:8a  txqueuelen 0  (Ethernet)
        RX packets 0  bytes 0 (0.0 B)
        RX errors 0  dropped 0  overruns 0  frame 0
        TX packets 0  bytes 0 (0.0 B)
        TX errors 0  dropped 0 overruns 0  carrier 0  collisions 0

docker0: flags=4099<UP,BROADCAST,MULTICAST>  mtu 1500
        inet 172.17.0.1  netmask 255.255.0.0  broadcast 172.17.255.255
        ether 02:42:b9:f8:3d:51  txqueuelen 0  (Ethernet)
        RX packets 0  bytes 0 (0.0 B)
        RX errors 0  dropped 0  overruns 0  frame 0
        TX packets 0  bytes 0 (0.0 B)
        TX errors 0  dropped 0 overruns 0  carrier 0  collisions 0

eth0: flags=4163<UP,BROADCAST,RUNNING,MULTICAST>  mtu 9001
        inet 20.0.128.17  netmask 255.255.240.0  broadcast 20.0.143.255
        inet6 fe80::50:5fff:fe5e:3378  prefixlen 64  scopeid 0x20<link>
        ether 02:50:5f:5e:33:78  txqueuelen 1000  (Ethernet)
        RX packets 1944362  bytes 1700686753 (1.5 GiB)
        RX errors 0  dropped 0  overruns 0  frame 0
        TX packets 919277  bytes 220625782 (210.4 MiB)
        TX errors 0  dropped 0 overruns 0  carrier 0  collisions 0

lo: flags=73<UP,LOOPBACK,RUNNING>  mtu 65536
        inet 127.0.0.1  netmask 255.0.0.0
        inet6 ::1  prefixlen 128  scopeid 0x10<host>
        loop  txqueuelen 1000  (Local Loopback)
        RX packets 0  bytes 0 (0.0 B)
        RX errors 0  dropped 0  overruns 0  frame 0
        TX packets 0  bytes 0 (0.0 B)
        TX errors 0  dropped 0 overruns 0  carrier 0  collisions 0

veth0c3249c: flags=4163<UP,BROADCAST,RUNNING,MULTICAST>  mtu 1500
        inet6 fe80::c4af:a6ff:feb4:ac7d  prefixlen 64  scopeid 0x20<link>
        ether c6:af:a6:b4:ac:7d  txqueuelen 0  (Ethernet)
        RX packets 706600  bytes 120818150 (115.2 MiB)
        RX errors 0  dropped 0  overruns 0  frame 0
        TX packets 1224687  bytes 1647839603 (1.5 GiB)
TX errors 0 dropped 0 overruns 0 carrier 0 collisions 0- etho0, eth1: 흔히 랜 카드라고 불리는 유선 네트워크 인터페이스입니다.
- lo: 루프 백 인터페이스로 자기자신과 통신하는데 사용하는 가상 장치입니다. IP는 127.0.0.1입니다. IP 주소는 서버에 하나 씩 부여되는 것이 아니라 네트워크 인터페이스에 할당되기 때문에 각 네트워크 인터페이스마다 다른 IP 주소를 가지고 있습니다.
- inet: 네트워크 인터페이스에 할당된 IP 주소
- broadcast: 브로드캐스트 주소
- netmask: 넷 마스크
- MTU: 네트워크 최대 전송 단위
- RX packets: 받은 패킷 정보
- TX packets: 보낸 패킷 정보
- collision: 충돌된 패킷 수
- interrupt: 네트워크 인터페이스가 사용하는 인터럽트 번호
Ifconfig 명령어로는 private ip밖에 확인이 안되기 때문에 Public IP를 알고 싶다면 Curl을 설치해서 알 수 있다.
`curl ifconfig.me``
top
윈도우의 작업관리자와 비슷한 기능을 하는 명령어이다.
시스템 프로세스들의 CPU/Memory 점유율을 실시간으로 볼 수 있다. 현재 몇 개의 프로세스가 있는지, CPU의 자세한 사용률은 어떻게 되는지, Memory와 Swap은 얼마나 사용하고 있는지를 확인할 수 있다.
top - 05:09:39 up 21:03,  1 user,  load average: 0.18, 0.21, 0.26
Tasks: 230 total,   1 running, 178 sleeping,   0 stopped,   0 zombie
%Cpu(s):  4.3 us,  0.2 sy,  0.0 ni, 95.4 id,  0.0 wa,  0.0 hi,  0.0 si,  0.0 st
KiB Mem : 15897060 total,  4989520 free,  5839952 used,  5067588 buff/cache
KiB Swap:        0 total,        0 free,        0 used.  9675632 avail Mem

  PID USER      PR  NI    VIRT    RES    SHR S  %CPU %MEM     TIME+ COMMAND
 5295 rngd      20   0 4842960   1.3g  33272 S  10.6  8.6 174:51.13 ruby
32565 rngd      20   0 1593400   1.2g  18524 S   4.7  7.6   0:05.42 ruby
 5264 chrony    20   0   93800  34756   7108 S   0.7  0.2  11:33.65 redis-server
 1312 root      20   0  169080   4504   3944 R   0.3  0.0   0:00.01 top
 5170 rngd      20   0 1433720  52176  27936 S   0.3  0.3   3:09.39 gitlab-workhors
32582 rngd      20   0 1658424   1.2g  18420 S   0.3  7.8   0:06.09 ruby
    1 root      20   0   41648   5468   3888 S   0.0  0.0   0:03.19 systemd
    2 root      20   0       0      0      0 S   0.0  0.0   0:00.01 kthreadd
    3 root       0 -20       0      0      0 I   0.0  0.0   0:00.00 rcu_gp
    4 root       0 -20       0      0      0 I   0.0  0.0   0:00.00 rcu_par_gp
    6 root       0 -20       0      0      0 I   0.0  0.0   0:00.00 kworker/0:0H-ev
    8 root       0 -20       0      0      0 I   0.0  0.0   0:00.00 mm_percpu_wq
    9 root      20   0       0      0      0 S   0.0  0.0   0:00.00 rcu_tasks_rude_
   10 root      20   0       0      0      0 S   0.0  0.0   0:00.00 rcu_tasks_trace
   11 root      20   0       0      0      0 S   0.0  0.0   0:00.90 ksoftirqd/0
   12 root      20   0       0      0      0 I   0.0  0.0   0:19.37 rcu_sched
   13 root      rt   0       0      0      0 S   0.0  0.0   0:00.18 migration/0
   15 root      20   0       0      0      0 S   0.0  0.0   0:00.00 cpuhp/0
   16 root      20   0       0      0      0 S   0.0  0.0   0:00.00 cpuhp/1
   17 root      rt   0       0      0      0 S   0.0  0.0   0:00.26 migration/1
   18 root      20   0       0      0      0 S   0.0  0.0   0:01.02 ksoftirqd/1
   20 root       0 -20       0      0      0 I   0.0  0.0   0:00.00 kworker/1:0H-ev
   21 root      20   0       0      0      0 S   0.0  0.0   0:00.00 cpuhp/2
   22 root      rt   0       0      0      0 S   0.0  0.0   0:00.24 migration/2
   23 root      20   0       0      0      0 S   0.0  0.0   0:00.87 ksoftirqd/2
   25 root       0 -20       0      0      0 I   0.0  0.0   0:00.00 kworker/2:0H-ev
   26 root      20   0       0      0      0 S   0.0  0.0   0:00.00 cpuhp/3
   27 root      rt   0       0      0      0 S   0.0  0.0   0:00.25 migration/3
   28 root      20   0       0      0      0 S   0.0  0.0   0:01.00 ksoftirqd/3
   30 root       0 -20       0      0      0 I   0.0  0.0   0:00.00 kworker/3:0H-ev
   35 root      20   0       0      0      0 S   0.0  0.0   0:00.00 kdevtmpfs
   36 root       0 -20       0      0      0 I   0.0  0.0   0:00.00 netns
   39 root      20   0       0      0      0 S   0.0  0.0   0:00.06 kauditd
  322 root      20   0       0      0      0 S   0.0  0.0   0:00.05 khungtaskd
  323 root      20   0       0      0      0 S   0.0  0.0   0:00.00 oom_reaper
  324 root       0 -20       0      0      0 I   0.0  0.0   0:00.00 writeback
%Cpu(s)
- us: 사용자가 사용중인 사용률
- sy: 시스템이 사용중인 사용률
- ni: 프로세스 우선순위를 기반으로 사용되는 사용률
- id: 아무 일도 하지 않는 여유률
- wa: 입출력을 기다리는 프로세스 사용률
- hi: 하드웨어 인터럽트 사용률
- si: 소프트웨어 인터럽트 사용률
- st: 가상화 환경에서 손실률
User값이 높다면 사용자의 코드를 수행하는데 내부적으로 계산을 많이 하고 있다는 뜻이다.
System 값이 높다면 시스템에 의해 사용되고 있는 프로세스들이 시스템 호출 또는 I/O가 많다.
idle의 값이 항상 0이라면 CPU를 100% 사용하고 있다는 뜻이다. 이 때에는 CPU를 계속 사용하고 있는 프로세스를 찾아서 대응할 필요가 있다.
PROCESS
- PID: 프로세스 ID
- USER: 프로세스를 실행시킨 사용자 ID
- PR: 프로세스의 우선순위
- NI: NICE 값, 마이너스를 가지는 값이 우선순위가 높음
- VIRT: 가상 메모리의 사용량
- RES: 현재 페이지가 상주하고 있는 크기
- SHR: 가상 메모리 중 사용중인 메모리를 제외한 잔여 가상 메모리
- S: 프로세스의 상태
- D = uninterruptible sleep
- 디스크 혹은 네트워크 I/O 를 대기하고 있는 프로세스를 의미.
- R = running
- 실행 중인 프로세스. 실제로 CPU 자원을 소모.
- S = sleeping
- sleeping 상태의 프로세스로, D 상태와의 가장 큰 차이점은 요청한 리소스를 즉시 사용할 수 있는지 여부.
- T = traced or stopped
- 프로세스의 시스템 콜을 추적하고 있는 상태. (자주 볼 수 없는 상태)
- Z = zombie
- 부모 프로세스가 죽은 자식 프로세스를 의미. (자신을 만든 부모 프로세스가 완료된 상태인 경우)
- D = uninterruptible sleep
- %CPU: 프로세스가 사용하는 CPU 사용률
- %MEM: 프로세스가 사용하는 메모리의 사용률
- TIME+: 프로세스가 CPU를 사용한 시간
- COMMAND: 실행된 명령어
프로세스를 원하는 특정 기준에 따라 정렬할 수도 있다. top 실행 화면에서 Shift 키와 영문자를 누르면 프로세스의 정렬기준이 변경된다.
- SHIFT + M: 메모리 사용률 정렬
- SHIFT + N: PID 기준 정렬
- SHIFT + P: CPU 사용률 정렬
- SHIFT + T: 실행시간 기준 정렬
- SHIFT + R: 정렬 기준 변경 (오름차순, 내림차순간에 변경)
free
[root@gitlab-primary ~]# free -t
              total        used        free      shared  buff/cache   available
Mem:       15897060     5738200     5011620       46540     5147240     9776600
Swap:             0           0           0
Total: 15897060 5738200 5011620- Mem: 실제 메모리
- Swap: 일종의 가상 메모리
- Buffers: 일부 프로세스에 의해 발생한 임시 메모리
- Cached: 기존에 실행된 프로그램들이 사용했던 메모리로 실행 중이거나 새로 시작될 프로그램들이 필요할 때 빠르게 재 사용할 수 있는 메모리 영역
[root@gitlab-primary ~]# free -t
              total        used        free      shared  buff/cache   available
Mem:       15897060     5738200     5011620       46540     5147240     9776600
Swap:             0           0           0
Total:     15897060     5738200     5011620
[root@gitlab-primary ~]# free -b
              total        used        free      shared  buff/cache   available
Mem:    16278589440  5905166336  5292548096    47656960  5080875008  9982001152
Swap:             0           0           0
[root@gitlab-primary ~]# free -k
              total        used        free      shared  buff/cache   available
Mem:       15897060     5766840     5168408       46540     4961812     9747972
Swap:             0           0           0
[root@gitlab-primary ~]# free -m
              total        used        free      shared  buff/cache   available
Mem:          15524        5631        5047          45        4845        9519
Swap:             0           0           0
[root@gitlab-primary ~]# free -h
              total        used        free      shared  buff/cache   available
Mem:            15G        5.5G        4.9G         45M        4.7G        9.3G
Swap:            0B          0B          0B
[root@gitlab-primary ~]# free -g
              total        used        free      shared  buff/cache   available
Mem:             15           5           4           0           4           9
Swap:             0           0           0
[root@gitlab-primary ~]#
각각의 단위로 메모리를 확인할 수 있는데, free -h 를 가장 많이 사용할 것 같다. 사람이 보기 편한 단위로 보여준다.
vmstat
시스템 모니터링으로 시스템 작업, 하드웨어 및 시스템 정보를 확인할 수 있습니다. 메모리, 페이징, 블록장치의 I/O, CPU 상태 등을 볼 수 있습니다.
[root@gitlab-primary ~]# vmstat
procs -----------memory---------- ---swap-- -----io---- -system-- ------cpu-----
 r  b   swpd   free   buff  cache   si   so    bi    bo   in   cs us sy id wa st
 1  0      0 5128804   2088 4964556    0    0     8    34   57  120  5  1 94  0  0
procs
- r: CPU에서 대기중인 프로세스의 수를 의미한다.
- 통상적으로 r의 개수가 CPU 개수의 2배를 넘는다면 CPU의 성능을 올려주어야한다.
- b: 인터럽트가 불가능한 sleep 상태에 있는 프로세스의 수 (I/O 처리를 하는 동안 블록 처리된 프로세스)이다.
- b의 수치가 높은 경우라면 CPU가 계속 대기상태로 있다는 의미이므로 디스크 I/O를 확인해 볼 필요가 있습니다.
Swap
- si(swap in): 디스크 swap 공간에 있는 데이터를 메모리로 호출하는 양을 의미합니다.
- 사용되고 있는 swap 디스크가 해제되는 양(per sec)입니다.
- so(swap out)
- 메모리에서 디스크로 보내는 데이터의 양을 의미합니다. 물리적 메모리가 부족할 경우 디스크로부터 사용되는 메모리양(per sec)입니다.
- swap out이 지속적으로 발생한다면 메모리 부족을 의심해볼 수 있습니다. swap out값이 증가하면 메모리가 부족하다는 의미이므로 메모리를 늘려야 합니다.
- Swap out값은 0에 가까워야 좋고 초당 10블럭 이하가 좋습니다. swap필드의 값이 높다고 해도 free 메모리에 여유가 있다면 메모리가 부족한 것은 아닙니다.
- 메모리에서 디스크로 보내는 데이터의 양을 의미합니다. 물리적 메모리가 부족할 경우 디스크로부터 사용되는 메모리양(per sec)입니다.
-s 옵션을 주면 메모리 통계 항목들을 확인할 수 있습니다.
[root@gitlab-primary ~]# vmstat -s
     15897060 K total memory
      5760136 K used memory
       810904 K active memory
      9061004 K inactive memory
      5143552 K free memory
         2088 K buffer memory
      4991284 K swap cache
            0 K total swap
            0 K used swap
            0 K free swap
      1641274 non-nice user cpu ticks
          104 nice user cpu ticks
       203198 system cpu ticks
     29299538 idle cpu ticks
         4395 IO-wait cpu ticks
            0 IRQ cpu ticks
         6971 softirq cpu ticks
         2964 stolen cpu ticks
      2393161 pages paged in
     10626263 pages paged out
            0 pages swapped in
            0 pages swapped out
    104351095 interrupts
    167259684 CPU context switches
   1708589184 boot time
        67648 forks
vm stat [delay [count]]를 사용하면 실시간으로 메모리 상태를 확인할 수 있습니다.
ex) verstat 3 5: 3초 간격으로 모니터링 정보를 5번 출력
iostat
평균 CPU부하와 디스크 I/O의 세부적인 내용을 확인할 수 있다.
[root@gitlab-primary ~]# iostat
Linux 5.10.186-179.751.amzn2.x86_64 (gitlab-primary) 	2024년 02월 23일 	_x86_64_	(4 CPU)

avg-cpu:  %user   %nice %system %iowait  %steal   %idle
           5.27    0.00    0.67    0.01    0.01   94.04

Device:            tps    kB_read/s    kB_wrtn/s    kB_read    kB_wrtn
nvme0n1           4.48        30.60       136.16    2393257   10647590
Device
- tps: 디바이스에 초당 전송 요청 건수
- kB_read/s: 디바이스에서 초당 쓴 데이터 블록 단위
- KB_wrtn/s: 디바이스에서 초당 쓴 데이터 블록 단위
- kB_read: 디바이스에서 지정한 간격 동안 읽은 블록 수
- kB_wrtn: 디바이스에서 지정한 간격동안 쓴 전체 블록 수
-x 옵션을 사용하면 더 자세한 내역을 볼 수 있습니다.
[root@gitlab-primary ~]# iostat -x
Linux 5.10.186-179.751.amzn2.x86_64 (gitlab-primary) 	2024년 02월 23일 	_x86_64_	(4 CPU)

avg-cpu:  %user   %nice %system %iowait  %steal   %idle
           5.27    0.00    0.67    0.01    0.01   94.04

Device:         rrqm/s   wrqm/s     r/s     w/s    rkB/s    wkB/s avgrq-sz avgqu-sz   await r_await w_await  svctm  %util
nvme0n1           0.00     0.37    1.48    2.98    30.42   135.85    74.48     0.00    0.94    0.56    1.12   0.72   0.32
vmstat과 마찬가지로 iostat 3 5 하면 3초간격으로 5번 출력하게 된다.
netstat
현재 시스템에 연결된 네트워크 상태, 라우팅 테이블, 인터페이스 상태 등을 볼 수 있습니다.
[ec2-user@ip-10-150-10-201 ~]$ netstat
Active Internet connections (w/o servers)
Proto Recv-Q Send-Q Local Address           Foreign Address         State
tcp        0      0 ip-10-150-10-201.ap:ssh 41.111.218.206:44726    SYN_RECV
tcp        0    200 ip-10-150-10-201.ap:ssh 221.148.114.22:46115    ESTABLISHED
tcp        0      0 ip-10-150-10-201.ap:ssh dsl-187-200-56-18:59666 SYN_RECV
tcp        0      0 ip-10-150-10-201.ap:ssh 167.71.136.141:33390    SYN_RECV
Active UNIX domain sockets (w/o servers)
Proto RefCnt Flags       Type       State         I-Node   Path
unix  2      [ ]         DGRAM                    1024     /run/systemd/shutdownd
unix  2      [ ]         DGRAM                    17702    /var/run/chrony/chronyd.sock
unix  3      [ ]         DGRAM                    489      /run/systemd/notify
unix  2      [ ]         DGRAM                    491      /run/systemd/cgroups-agent
unix  6      [ ]         DGRAM                    506      /run/systemd/journal/socket
unix  15     [ ]         DGRAM                    508      /dev/log
unix  3      [ ]         STREAM     CONNECTED     17102
...-
Active Internet connections: TCP, UDP, raw로 연결된 목록
-
Active UNIX domain sockets: 도메인 소켓으로 연결된 목록
-
명령어의 옵션
- n: 호스트명, 포트명을 lookup하지 않고 IP, Port번호를 보여준다.
- a: 모든 네트워크 상태를 보여준다.
- localhost 까지도
- t: TCP 프로토콜만 보여준다.
- u: UDP 프로토콜만 보여준다.
- p: 해당 포트를 사용하는 프로그램과 프로세스ID를 보여준다.
- r: 라우팅 테이블 출력
- s: 프로토콜 별 (IP, ICMP, TCP, UDP 등)로 통계를 보여줍니다.
- l: 대기중인 소켓 목록을 보여줍니다.
State는 아래와 같이 표현됩니다.
- 공백: 연결되어 있지 않음
- FREE: socket은 존재하지만 할당되어 있지 않다.
- LISTENING: 연결요청에 대한 응답 준비가 되어 있는 상태
- CONNECTING: 연결이 막 이루어진 상태
- UNKNOWN: 알 수 없는 연결, 알려지지 않은 연결 상태
- LISTEN: 연결 가능하도록 daemon이 떠있으며 연결이 가능한 상태
- SYS-SENT: 연결을 요청한 상태
- SYN_RECEIVED: 연결요구에 응답 후 확인 메시지 대기중인 상태
- ESTABLEISHED: 연결이 완료된 상태
- FIN-WAIT1: 소켓이 닫히고 연결이 종료되고 있는 상태
- FIN-WAIT2: 로컬이 원결으로부터 연결 종료 요구를 기다리는 상태
- CLOSE-WAIT: 종료 대기 중
- CLOSING: 전송된 메세지가 유실되었음
- TIME-WAIT: 연결종료 후 한동안 유지되어 있음
- CLOSED: 연결이 완전히 종료
옵션에 따라 다른 정보를 확인할 수 있습니다.
- netstat -r: 서버의 라우팅 테이블 출력
- netstat -na --ip: tcp/udp의 세션 목록 표시
- netstat -na | grep ESTABLISHED | wc -l: 활성화된 세션 수 확인
- netstat -nap | grep :80 | grep ESTABLISHED | wc -l: 80포트 동시 접속자 수
- netstat -nltp: LISTEN 중인 포트 정보 표시
df: 디스크 모니터링
현재 디스크의 전체 용량 및 남은 용량을 확인할 수 있습니다.
[ec2-user@ip-10-150-10-201 ~]$ df
Filesystem     1K-blocks      Used Available Use% Mounted on
devtmpfs         8008320         0   8008320   0% /dev
tmpfs            8019088         0   8019088   0% /dev/shm
tmpfs            8019088       548   8018540   1% /run
tmpfs            8019088         0   8019088   0% /sys/fs/cgroup
/dev/nvme0n1p1   8376300   5586600   2789700  67% /
/dev/nvme1n1   309504832 161009960 132749848  55% /mnt
tmpfs            1603820         0   1603820   0% /run/user/1000
옵션은 아래와 같습니다.
- h: 용량을 읽기 쉽게 단위를 계산하여 출력
- T: 파일 시스템 종류와 함께 디스크 정보 출력
lsof: 열린 파일 나열
lsof 명령은 많은 Linux/Unix 계열 시스템에서 열려있는 모든 파일 및 프로세스 목록을 표시하는 데 사용됩니다.
- 디스크 파일
- 네트워크 소켓
- 파이프
- 장치
- 프로세스
mzc01-repush@MZC01-REPUSH gitlab-runner % lsof | less
COMMAND PID USER FD TYPE DEVICE SIZE/OFF NODE NAME
loginwind 157 mzc01-repush cwd DIR 1,18 640 2 /
loginwind 157 mzc01-repush txt REG 1,18 2722208 1152921500312137157 /System/Library/CoreServices/loginwindow.app/Contents/MacOS/loginwindow
loginwind 157 mzc01-repush txt REG 1,18 123 1152921500312135015 /System/Library/CoreServices/SystemVersion.bundle/ko.lproj/SystemVersion.strings
loginwind 157 mzc01-repush txt REG 1,18 17136 1152921500312228770 /System/Library/Input Methods/KoreanIM.app/Contents/PlugIns/KIM_Extension.appex/Contents/Resources/InfoPlist.loctable
loginwind 157 mzc01-repush txt REG 1,18 209664 1152921500312234978 /System/Library/LoginPlugins/FSDisconnect.loginPlugin/Contents/MacOS/FSDisconnect
loginwind 157 mzc01-repush txt REG 1,18 675 1152921500312230175 /System/Library/Input Methods/VietnameseIM.app/Contents/Resources/InfoPlist.loctable
loginwind 157 mzc01-repush txt REG 1,18 338048 1152921500312234928 /System/Library/LoginPlugins/DisplayServices.loginPlugin/Contents/MacOS/DisplayServices
loginwind 157 mzc01-repush txt REG 1,18 237952 26719599 /private/var/db/timezone/tz/2024a.1.0/icutz/icutz44l.dat
loginwind 157 mzc01-repush txt REG 1,18 137016 1152921500312134679 /System/Library/CoreServices/SystemAppearance.bundle/Contents/Resources/SystemAppearance.car
loginwind 157 mzc01-repush txt REG 1,18 1455236 1152921500312230423 /System/Library/Keyboard Layouts/AppleKeyboardLayouts.bundle/Contents/Resources/AppleKeyboardLayouts-L.dat
loginwind 157 mzc01-repush txt REG 1,18 39542 1152921500312178200 /System/Library/Frameworks/LocalAuthentication.framework/Support/SharedUtils.framework/Versions/A/Resources/Shared.loctable
loginwind 157 mzc01-repush txt REG 1,18 234934 1152921500312230425 /System/Library/Keyboard Layouts/AppleKeyboardLayouts.bundle/Contents/Resources/InfoPlist.loctable
loginwind 157 mzc01-repush txt REG 1,18 671 1152921500312228882 /System/Library/Input Methods/KoreanIM.app/Contents/Resources/InfoPlist.loctable
loginwind 157 mzc01-repush txt REG 1,18 5876 1152921500312226645 /System/Library/Input Methods/AinuIM.app/Contents/Resources/InfoPlist.loctable
loginwind 157 mzc01-repush txt REG 1,18 673 1152921500312229857 /System/Library/Input Methods/TrackpadIM.app/Contents/Resources/InfoPlist.loctable
loginwind 157 mzc01-repush txt REG 1,18 4620 1152921500312228433 /System/Library/Input Methods/JapaneseIM-KanaTyping.app/Contents/Resources/InfoPlist.loctable
loginwind 157 mzc01-repush txt REG 1,18 2331 1152921500312226581 /System/Library/Input Methods/50onPaletteServer.app/Contents/Resources/InfoPlist.loctable
loginwind 157 mzc01-repush txt REG 1,18 4889 1152921500312226708 /System/Library/Input Methods/Assistive Control.app/Contents/Resources/InfoPlist.loctable
loginwind 157 mzc01-repush txt REG 1,18 1122 1152921500312228942 /System/Library/Input Methods/PluginIM.app/Contents/Resources/InfoPlist.loctable
loginwind 157 mzc01-repush txt REG 1,18 4462 1152921500312227659 /System/Library/Input Methods/DictationIM.app/Contents/Resources/InfoPlist.loctable
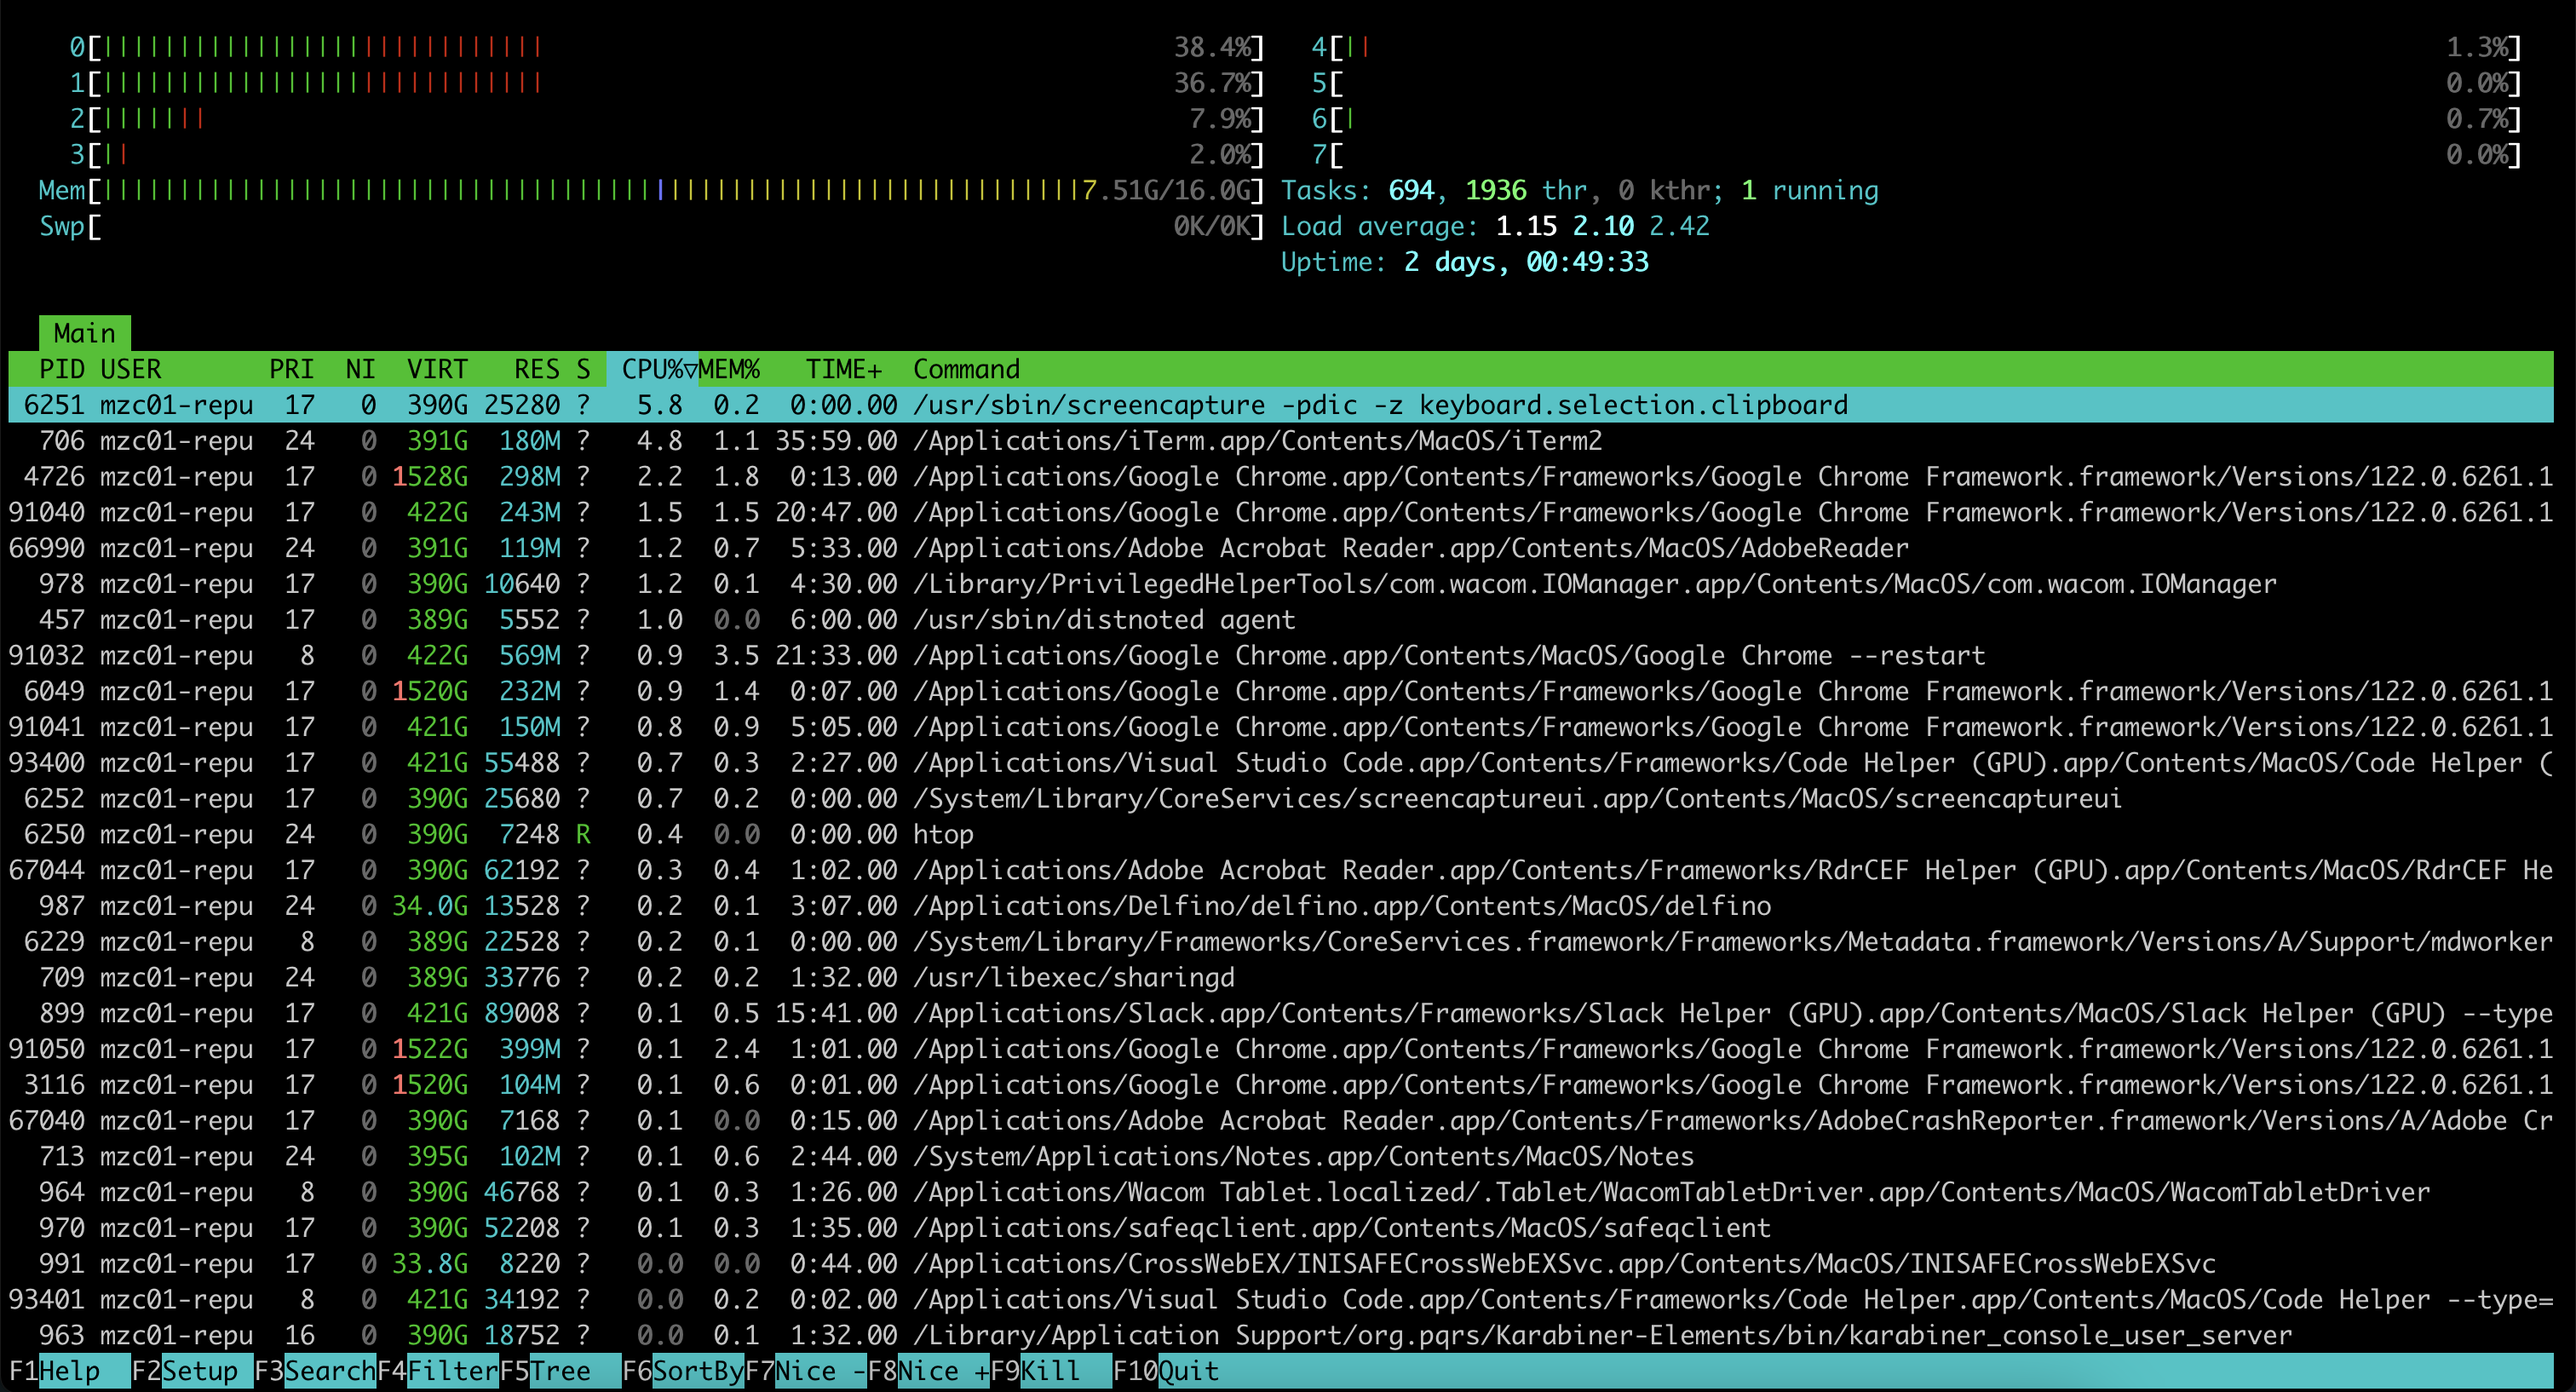
:htop: 리눅스 프로세스 모니터링
top과 매우 유사하지만 사용자-프로세스, 단축키, 프로세스의 수직 및 수평보기 등을 관리할 수 있는 친숙한 인터페이스 입니다.
f6으로 Sort 기능을 쓰면 모니터링이 더 수월해집니다.
lotop: Linux 디스크 I/O 모니터링
iotop은 top 명령 및 htop 프로그램과 매우 유사하지만 실시간으로 모니터링하고 표시하는 계정 기능이 있습니다.
디스크 I/O를 확인하는데 유용합니다.

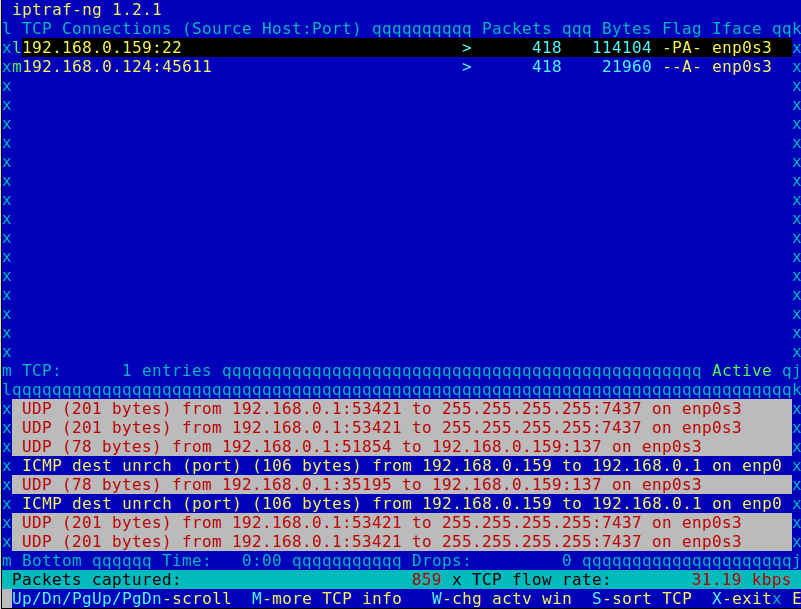
iptraf
ac: 사용자 활동 모니터링
해당 유저가 접속한 시간을 확인하는 명령어 입니다.
nethogs: 프로세스별 네트워크 대역폭 모니터링
NetHogs version 0.8.7

    PID USER     PROGRAM                                                                                                          DEV         SENT      RECEIVED
      ? root     unknown TCP                                                                                                                  0.963       0.829 KB/sec

  TOTAL                                                                                                                                       0.963       0.829 KB/sec
iftop: 네트워크 대역폭 모니터링
iftop은 시스템의 네트워크 인터페이스를 통과하는 네트워크 대역폭 사용률(소스 및 대상 호스트)의 자주 업데이트되는 목록을 표시하는 또 다른 터미널 기반 무료 오픈소스 시스템 모니터링 유틸리티입니다.