📌 상관분석
- 두 변수 간의 선형적 관계를 상관이라고 하며, 이러한 관계에 대한 분석을 상관분석이라 한다.
- 두 변수는 일반적으로 연속형 변수를 가정한다.
> library(MASS)
> str(cats)  # 고양이 성별에 따른 몸무게와 심장의 무게
'data.frame':	144 obs. of  3 variables:
 $ Sex: Factor w/ 2 levels "F","M": 1 1 1 1 1 1 1 1 1 1 ...
 $ Bwt: num  2 2 2 2.1 2.1 2.1 2.1 2.1 2.1 2.1 ...
 $ Hwt: num  7 7.4 9.5 7.2 7.3 7.6 8.1 8.2 8.3 8.5 ...
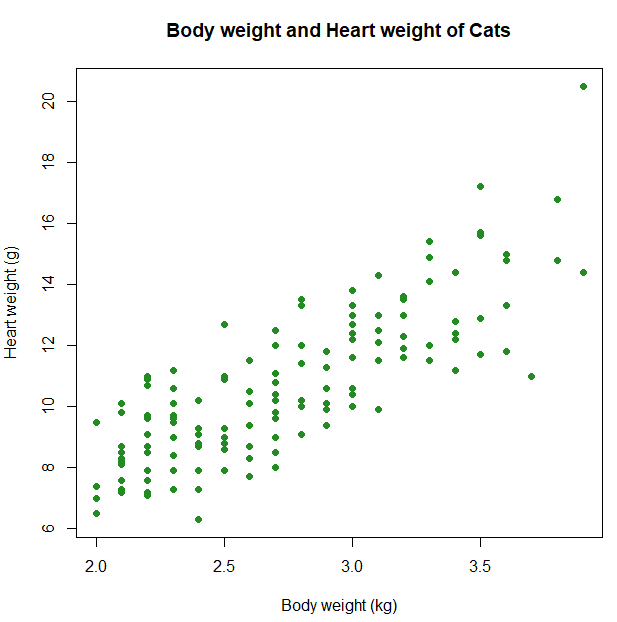
상관분석을 통해 고양이의 몸무게와 심장 무게 간의 관계를 분석한다. 상관분석을 수행하기 전에 대략적인 관계를 산점도로 살펴보자.
> plot(cats$Hwt ~ cats$Bwt, col="forestgreen", pch=19,
+      xlab="Body weight (kg)", ylab="Heart weight (g)",
+      main="Body weight and Heart weight of Cats")
📌 상관계수(Correlation coefficient)
두 변수 간의 선형관계의 강도를 측정
- -1 ~ +1 사이의 값을 가진다.
- -1 : 음의 상관관계
- +1 : 양의 상관관계
- 0 : 두 변수 간의 선형관계가 없다.
- 대칭이어서 x와 y의 상관계수는 y와 x의 상관계수와 일치
- 선형변환에 의해 영향을 받지 않는다
> cor(cats$Bwt, cats$Hwt)
[1] 0.8041274
고양이의 몸무게와 심장의 무게의 상관계수가 0.8041274로 1에 가까운 값을 갖는다. 양의 선형관계가 존재함을 알 수 있다.
method=c("pearson", "kendall", "spearman")
method 인수에 3가지 옵션을 지정할 수 있다.
- 데이터셋이 연속형인 경우 "pearson"
- 데이터셋이 서열 척도로 되어 있는 경우 "kendall", "searman"
📝 Pearson 상관계수 vs Spearman 상관계수
- Pearson 상관계수는 정규성 가정 필요하다.
- Spearman 상관계수는 정규성 가정을 충족하지 못하는 서열척도의 데이터를 바탕으로 계산되며, 이상점에 덜 민감하다.
- Pearson 상관계수와 Spearman 상관계수가 많이 다르면 Pearson 상관계수에 큰 영향을 미치는 이상점이 데이터에 포함되어 있을 가능성이 있다.
cor() 함수는 상관계수를 계산해주지만 유의성 검정을 해주지는 않는다. 상관계수에 대한 유의성 검정은 cor.test() 함수를 이용한다.
귀무가설 : 모집단에 대한 상관계수가 0이다.
대립가설 : 모집단에 대한 상관계수가 0이 아니다.
> cor.test(cats$Bwt, cats$Hwt)

	Pearson's product-moment correlation

data:  cats$Bwt and cats$Hwt
t = 16.119, df = 142, p-value < 2.2e-16
alternative hypothesis: true correlation is not equal to 0
95 percent confidence interval:
 0.7375682 0.8552122
sample estimates:
      cor
0.8041274
p-value=2.2e-16 이므로 귀무가설을 기각한다.
즉, 고양이의 몸무게와 심장 무게 간에는 상관관계가 존재한다.
> cor.test(cats$Bwt, cats$Hwt, alternative="greater", conf.level=0.99)

	Pearson's product-moment correlation

data:  cats$Bwt and cats$Hwt
t = 16.119, df = 142, p-value < 2.2e-16
alternative hypothesis: true correlation is greater than 0
99 percent confidence interval:
 0.7231755 1.0000000
sample estimates:
      cor
0.8041274
alternative="greater"
귀무가설 : 상관계수가 0보다 작다.
대립가설 : 상관계수가 0보다 크다
p-value = 2.2e-16 이므로 귀무가설을 기각한다. 즉, 상관계수는 0보다 크다. 위와 같은 결과를 갖는다.
> cor.test(~ Bwt + Hwt, data=cats)

	Pearson's product-moment correlation

data:  Bwt and Hwt
t = 16.119, df = 142, p-value < 2.2e-16
alternative hypothesis: true correlation is not equal to 0
95 percent confidence interval:
 0.7375682 0.8552122
sample estimates:
      cor
0.8041274
포뮬려 형식을 이용하면 subset 별로 함수를 적용할 수 있다는 장점이 있다.
p-value = 0.0001186 이므로 귀무가설을 기각한다.
암컷 고양이에 대해서도 고양이의 몸무게와 심장 무게 간에 상관관계가 존재한다.
단, cor.test() 함수는 두 변수 간의 상관계수 유의성 검정만 사용 가능하다는 한계가 존재한다.
📌 상관계수 행렬
> str(iris)
'data.frame':	150 obs. of  5 variables:
 $ Sepal.Length: num  5.1 4.9 4.7 4.6 5 5.4 4.6 5 4.4 4.9 ...
 $ Sepal.Width : num  3.5 3 3.2 3.1 3.6 3.9 3.4 3.4 2.9 3.1 ...
 $ Petal.Length: num  1.4 1.4 1.3 1.5 1.4 1.7 1.4 1.5 1.4 1.5 ...
 $ Petal.Width : num  0.2 0.2 0.2 0.2 0.2 0.4 0.3 0.2 0.2 0.1 ...
 $ Species     : Factor w/ 3 levels "setosa","versicolor",..: 1 1 1 1 1 1 1 1 1 1 ...

> iris.cor <- cor(iris[-5])
> iris.cor

             Sepal.Length Sepal.Width Petal.Length Petal.Width
Sepal.Length    1.0000000  -0.1175698    0.8717538   0.8179411
Sepal.Width    -0.1175698   1.0000000   -0.4284401  -0.3661259
Petal.Length    0.8717538  -0.4284401    1.0000000   0.9628654
Petal.Width     0.8179411  -0.3661259    0.9628654   1.0000000

> class(iris.cor)  # 행렬 형식
[1] "matrix" "array

> iris.cor["Petal.Width", "Petal.Length"]
[1] 0.9628654
> library(psych)
>corr.test(iris[-5])
Call:corr.test(x = iris[-5])
Correlation matrix
Sepal.Length Sepal.Width Petal.Length Petal.Width
Sepal.Length 1.00 -0.12 0.87 0.82
Sepal.Width -0.12 1.00 -0.43 -0.37
Petal.Length 0.87 -0.43 1.00 0.96
Petal.Width 0.82 -0.37 0.96 1.00
Sample Size
[1] 150
Probability values (Entries above the diagonal are adjusted for multiple tests.)
Sepal.Length Sepal.Width Petal.Length Petal.Width
Sepal.Length 0.00 0.15 0 0
Sepal.Width 0.15 0.00 0 0
Petal.Length 0.00 0.00 0 0
Petal.Width 0.00 0.00 0 0
To see confidence intervals of the correlations, print with the short=FALSE option1번째 : 상관계수 행렬
2번째 : 상관계수에 대한 p-value
📌 상관계수의 95% 신뢰구간
> print(corr.test(iris[-5]), short=FALSE)
Call:corr.test(x = iris[-5])
Correlation matrix
             Sepal.Length Sepal.Width Petal.Length Petal.Width
Sepal.Length         1.00       -0.12         0.87        0.82
Sepal.Width         -0.12        1.00        -0.43       -0.37
Petal.Length         0.87       -0.43         1.00        0.96
Petal.Width          0.82       -0.37         0.96        1.00
Sample Size
[1] 150
Probability values (Entries above the diagonal are adjusted for multiple tests.)
             Sepal.Length Sepal.Width Petal.Length Petal.Width
Sepal.Length         0.00        0.15            0           0
Sepal.Width          0.15        0.00            0           0
Petal.Length         0.00        0.00            0           0
Petal.Width          0.00        0.00            0           0

 Confidence intervals based upon normal theory.  To get bootstrapped values, try cor.ci
            raw.lower raw.r raw.upper raw.p lower.adj upper.adj
Spl.L-Spl.W     -0.27 -0.12      0.04  0.15     -0.27      0.04
Spl.L-Ptl.L      0.83  0.87      0.91  0.00      0.81      0.91
Spl.L-Ptl.W      0.76  0.82      0.86  0.00      0.74      0.88
Spl.W-Ptl.L     -0.55 -0.43     -0.29  0.00     -0.58     -0.25
Spl.W-Ptl.W     -0.50 -0.37     -0.22  0.00     -0.51     -0.20
Ptl.L-Ptl.W      0.95  0.96      0.97  0.00      0.94      0.98
📌 상관계수 행렬 시각화
> str(state.x77)
 num [1:50, 1:8] 3615 365 2212 2110 21198 ...
 - attr(*, "dimnames")=List of 2
  ..$ : chr [1:50] "Alabama" "Alaska" "Arizona" "Arkansas" ...
  ..$ : chr [1:8] "Population" "Income" "Illiteracy" "Life Exp" ...

> cor(state.x77)
            Population     Income  Illiteracy    Life Exp     Murder     HS Grad      Frost        Area
Population  1.00000000  0.2082276  0.10762237 -0.06805195  0.3436428 -0.09848975 -0.3321525  0.02254384
Income      0.20822756  1.0000000 -0.43707519  0.34025534 -0.2300776  0.61993232  0.2262822  0.36331544
Illiteracy  0.10762237 -0.4370752  1.00000000 -0.58847793  0.7029752 -0.65718861 -0.6719470  0.07726113
Life Exp   -0.06805195  0.3402553 -0.58847793  1.00000000 -0.7808458  0.58221620  0.2620680 -0.10733194
Murder      0.34364275 -0.2300776  0.70297520 -0.78084575  1.0000000 -0.48797102 -0.5388834  0.22839021
HS Grad    -0.09848975  0.6199323 -0.65718861  0.58221620 -0.4879710  1.00000000  0.3667797  0.33354187
Frost      -0.33215245  0.2262822 -0.67194697  0.26206801 -0.5388834  0.36677970  1.0000000  0.05922910
Area        0.02254384  0.3633154  0.07726113 -0.10733194  0.2283902  0.33354187  0.0592291  1.00000000

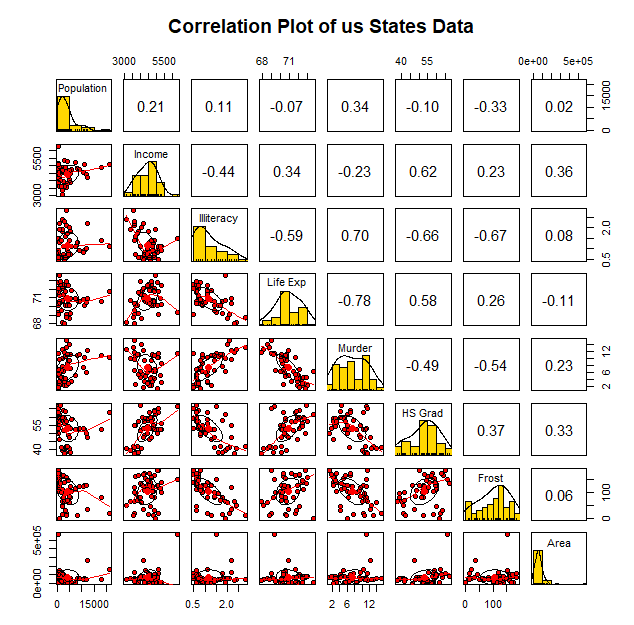
> # 산점도, 히스토그램, 상관계수 동시에 보여줌
> pairs.panels(state.x77, pch=21, bg="red", hist.col="gold",
+              main="Correlation Plot of us States Data")
> library(corrgram)
> # 산점도, 히스토그램, 상관계수 동시에 보여줌
> pairs.panels(state.x77, pch=21, bg="red", hist.col="gold",
+              main="Correlation Plot of us States Data")
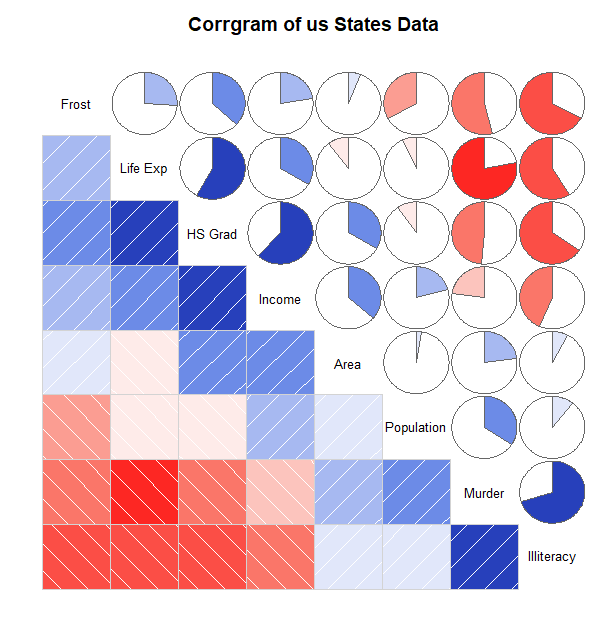
> corrgram(state.x77, lower.panel=panel.shade,
+          upper.panel=panel.pie, text.panel=panel.txt,
+          order=TRUE, main="Corrgram of us States Data")
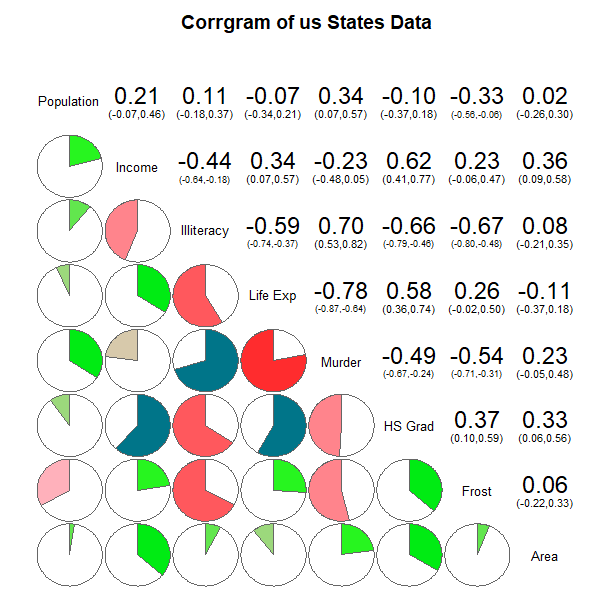
> cols <- colorRampPalette(c("red", "pink", "green", "blue"))
> corrgram(state.x77, col.regions=cols,
+          lower.panel=panel.pie, upper.panel=panel.conf,
+          text.panel=panel.txt, order=FALSE,
+          main="Corrgram of us States Data")
