📌 이원분산분석(two-way ANOVA)
집단을 구분하는 독립변수가 두 개일 때 모집단 간 평균의 동일성 검정한다.
- 주효과(main effect) 검정 : 각 독립변수에 의해 만들어지는 집단 간 평균의 차이에 대한 검정(두 독립변수가 각각 종속변수에 유의한 영향을 미치는지)
- 상호작용효과(interaction effect) 검정 : 두 독립변수의 조합에 의해 만들어지는 집단 간 평균의 차이에 대한 검정
비타민 C가 기니피그 이빨 성장에 미치는 영향
- len : 이빨의 길이 (종속변수)
- supp : 비타민 C (독립변수)
- dose : 투여량 (독립변수)
> str(ToothGrowth)
'data.frame':	60 obs. of  3 variables:
 $ len : num  4.2 11.5 7.3 5.8 6.4 10 11.2 11.2 5.2 7 ...
 $ supp: Factor w/ 2 levels "OJ","VC": 2 2 2 2 2 2 2 2 2 2 ...
 $ dose: Factor w/ 3 levels "low","med","high": 1 1 1 1 1 1 1 1 1 1 ...

 > ToothGrowth$dose <- factor(ToothGrowth$dose, levels=c(0.5, 1.0, 2.0), labels=c("low", "med", "high"))
> str(ToothGrowth)
'data.frame':	60 obs. of  3 variables:
 $ len : num  4.2 11.5 7.3 5.8 6.4 10 11.2 11.2 5.2 7 ...
 $ supp: Factor w/ 2 levels "OJ","VC": 2 2 2 2 2 2 2 2 2 2 ...
 $ dose: Factor w/ 3 levels "low","med","high": 1 1 1 1 1 1 1 1 1 1 ...

 > head(ToothGrowth)
   len supp dose
1  4.2   VC  low
2 11.5   VC  low
3  7.3   VC  low
4  5.8   VC  low
5  6.4   VC  low
6 10.0   VC  low
> # with() : 데이터셋 이름을 반복적으로 적지 않아도 됨
> with(ToothGrowth, tapply(len, list(supp, dose), length))
low med high
OJ 10 10 10
VC 10 10 10
> with(ToothGrowth, tapply(len, list(supp, dose), mean))
low med high
OJ 13.23 22.70 26.06
VC 7.98 16.77 26.14
> with(ToothGrowth, tapply(len, list(supp, dose), sd))
low med high
OJ 4.459709 3.910953 2.655058
VC 2.746634 2.515309 4.797731투여량이 많을수록 이빨 성장에 영향을 미친다.
이원분산분석을 통해 정확하게 알아보자.
> # 동일한 코드
> ToothGrowth.aov <- aov(len ~ supp * dose, data=ToothGrowth)
> ToothGrowth.aov <- aov(len ~ supp + dose + supp:dose, data=ToothGrowth)

> summary(ToothGrowth.aov)
            Df Sum Sq Mean Sq F value   Pr(>F)
supp         1  205.4   205.4  15.572 0.000231 ***
dose         2 2426.4  1213.2  92.000  < 2e-16 ***
supp:dose    2  108.3    54.2   4.107 0.021860 *
Residuals   54  712.1    13.2
---
Signif. codes:  0 ‘***’ 0.001 ‘**’ 0.01 ‘*’ 0.05 ‘.’ 0.1 ‘ ’ 1
주효과와 상호작용이 없다는 귀무가설을 기각한다. 즉, 기니피그 이빨 성장은 보충제 종류와 투여량에 따라 영향을 받는다.
> # 각 효과에 따른 요약 통계량
> model.tables(ToothGrowth.aov, type="means")
Tables of means
Grand mean

18.81333

 supp
supp
    OJ     VC
20.663 16.963

 dose
dose
   low    med   high
10.605 19.735 26.100

 supp:dose
    dose
supp low   med   high
  OJ 13.23 22.70 26.06
  VC  7.98 16.77 26.14
> windows(width=12, height=8)
> boxplot(len ~ supp * dose, data=ToothGrowth,
+ col=c("deeppink", "yellowgreen"), las=1,
+ xlab="Vitamin C Type", ylab="Tooth Growth",
+ main="Effect of Vitamin C on Tooth Growth of Guinea Pigs")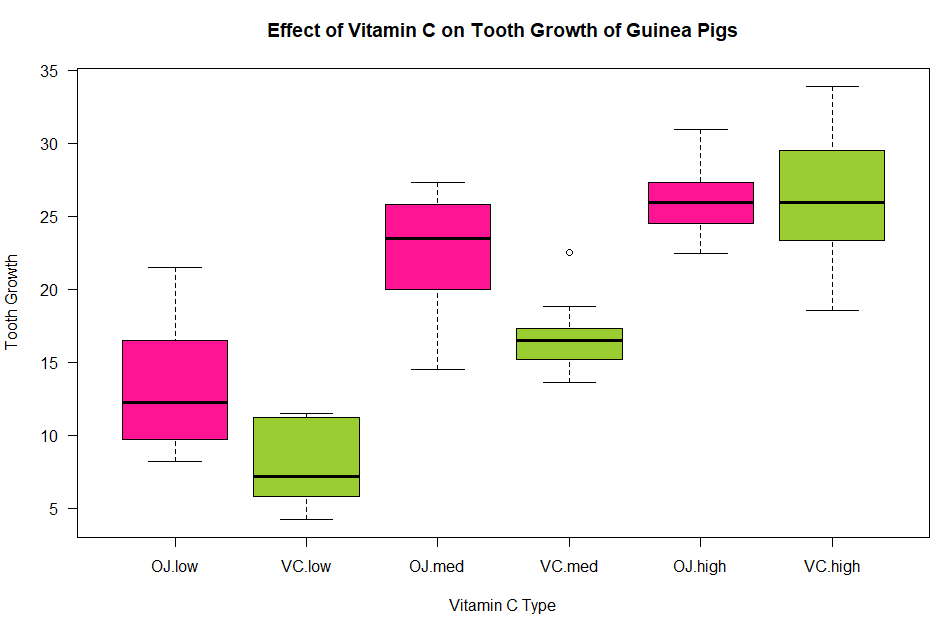
interaction.plot(x.factor=집단변수, trace.factor=선으로 그려질 집단변수, response=종속변수)
> # interaction() 상호작용 도표
> # 주효과와 상호작용 효과를 선도표 형태로 시각화
> interaction.plot(x.factor=ToothGrowth$dose,
+                  trace.factor=ToothGrowth$supp,
+                  response=ToothGrowth$len,
+                  trave.label="Supplement",
+                  las=1, type="b", pch=c(1, 19),
+                  col=c("blue", "red"),
+                  xlab="Dose Level", ylab="Tooth length",
+                  main="Interaction Plot for Tooth Grow of Guinea Pigs")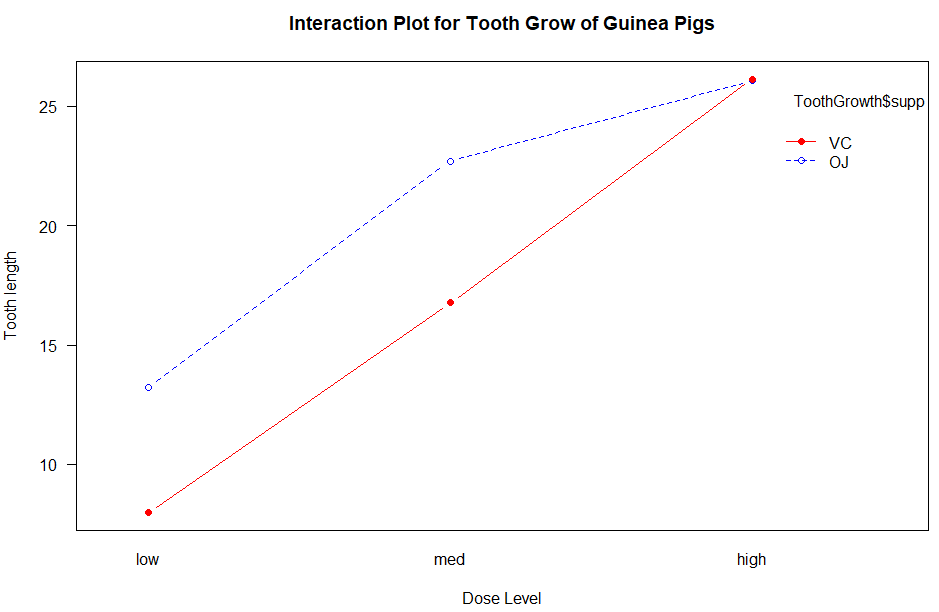
> library(gplots)
> plotmeans(len ~ interaction(supp, dose, sep=" "), data=ToothGrowth,
+           connect=list(c(1, 3, 5), c(2, 4, 6)),
+           col=c("red", "green3"),
+           xlab="Supplement and Dose Combination",
+           ylab="Tooth Growth",
+           main="Means Plot for Tooth Grow of Guinea Pigs")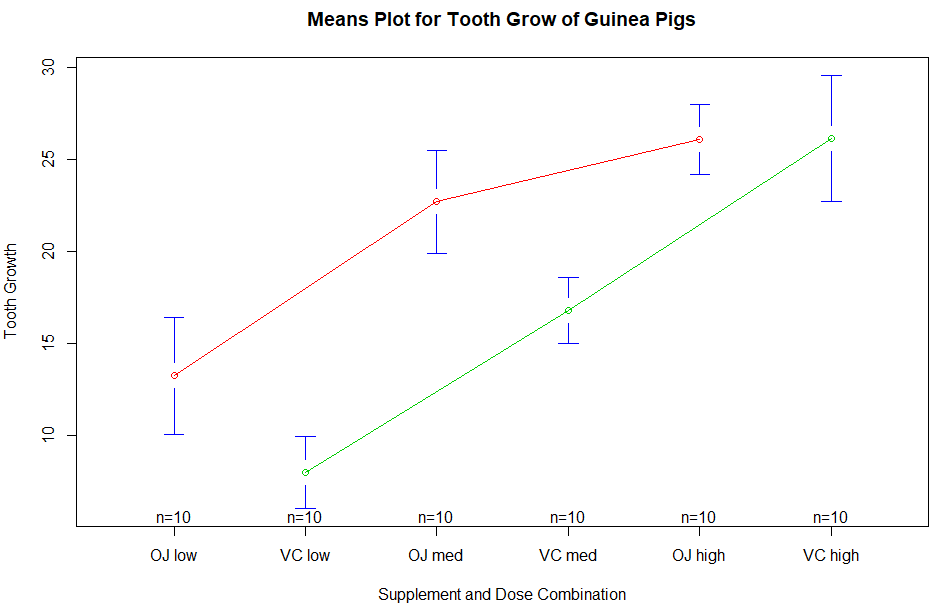
coplot() : 두 개의 집단변수가 있을 때 하나의 집단변수를 기준으로 나머지 집단변수와 종속변수 간 관계의 산점도
> coplot(len ~ dose | supp, data=ToothGrowth,
+        col="steelblue", pch=19,
+        panel=panel.smooth, lwd=2, col.smooth="darkorange",
+        xlab="Dose Level", ylab="Tooth Growth")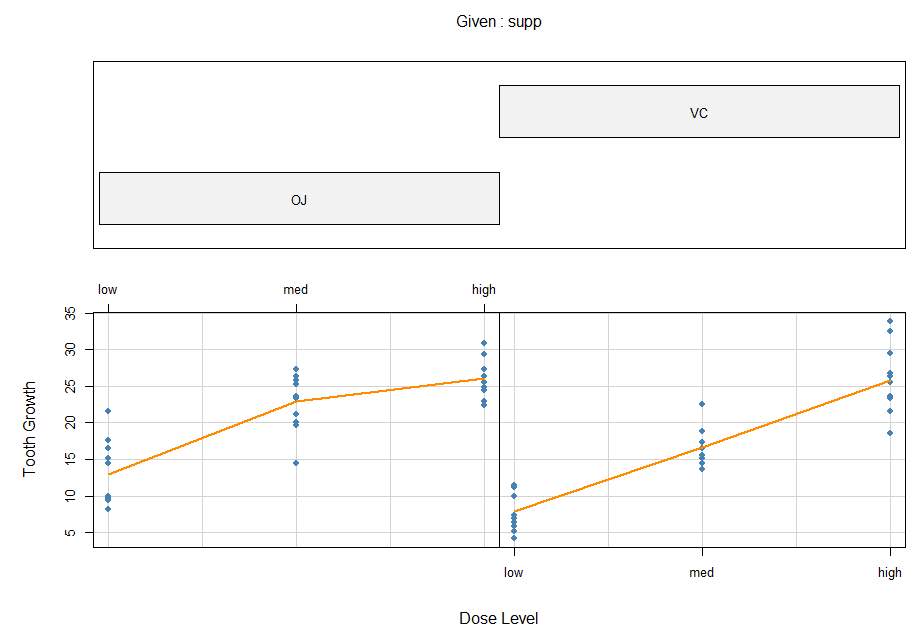
HH 패키지의 interaction2wt() 함수
주효과와 상호작용 효과를 별도의 패널에서 동시에 볼 수 있는 그래프
> library(HH)
> interaction2wt(len ~ supp * dose, data=ToothGrowth)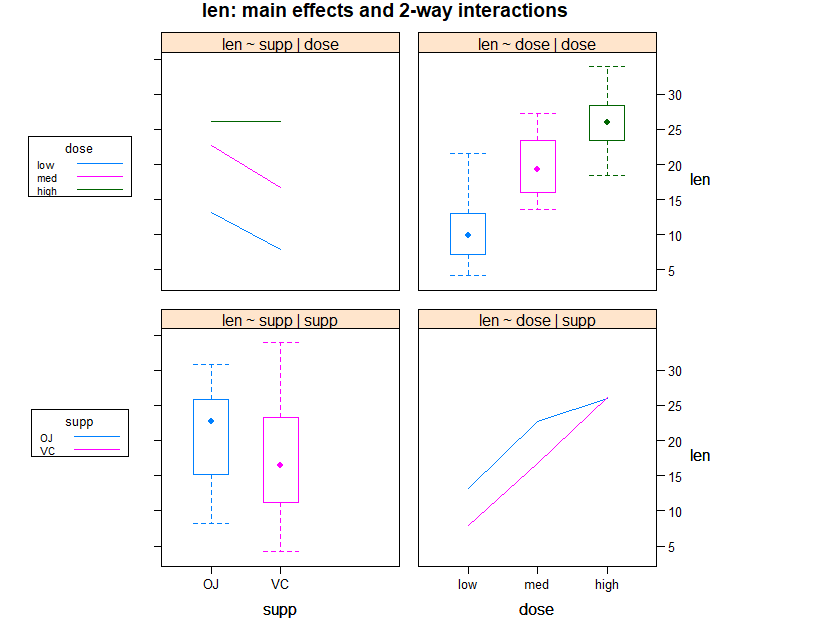
- 대각선 상의 상자도표는 주효과
- 비대각선 상의 선도표는 상호작용 효과
> # 이원분산에서 귀무가설을 기각할 경우 사후분석을 통해 집단 간 차이를 통해 추가 검정 진행
> TukeyHSD(ToothGrowth.aov)
  Tukey multiple comparisons of means
    95% family-wise confidence level

Fit: aov(formula = len ~ supp + dose + supp:dose, data = ToothGrowth)

$supp
      diff       lwr       upr     p adj
VC-OJ -3.7 -5.579828 -1.820172 0.0002312

$dose
           diff       lwr       upr   p adj
med-low   9.130  6.362488 11.897512 0.0e+00
high-low 15.495 12.727488 18.262512 0.0e+00
high-med  6.365  3.597488  9.132512 2.7e-06

$`supp:dose`
                 diff        lwr        upr     p adj
VC:low-OJ:low   -5.25 -10.048124 -0.4518762 0.0242521
OJ:med-OJ:low    9.47   4.671876 14.2681238 0.0000046
VC:med-OJ:low    3.54  -1.258124  8.3381238 0.2640208
OJ:high-OJ:low  12.83   8.031876 17.6281238 0.0000000
VC:high-OJ:low  12.91   8.111876 17.7081238 0.0000000
OJ:med-VC:low   14.72   9.921876 19.5181238 0.0000000
VC:med-VC:low    8.79   3.991876 13.5881238 0.0000210
OJ:high-VC:low  18.08  13.281876 22.8781238 0.0000000
VC:high-VC:low  18.16  13.361876 22.9581238 0.0000000
VC:med-OJ:med   -5.93 -10.728124 -1.1318762 0.0073930
OJ:high-OJ:med   3.36  -1.438124  8.1581238 0.3187361
VC:high-OJ:med   3.44  -1.358124  8.2381238 0.2936430
OJ:high-VC:med   9.29   4.491876 14.0881238 0.0000069
VC:high-VC:med   9.37   4.571876 14.1681238 0.0000058
VC:high-OJ:high  0.08  -4.718124  4.8781238 1.0000000

> TukeyHSD(ToothGrowth.aov, which=c("dose"), conf.level=0.99)
  Tukey multiple comparisons of means
    99% family-wise confidence level

Fit: aov(formula = len ~ supp + dose + supp:dose, data = ToothGrowth)

$dose
           diff       lwr       upr   p adj
med-low   9.130  5.637681 12.622319 0.0e+00
high-low 15.495 12.002681 18.987319 0.0e+00
high-med  6.365  2.872681  9.857319 2.7e-06
dose의 p-value를 확인한다. 귀무가설을 기각한다. 집단별로 차이가 있다. 주효과가 유의하다.
'supp:dose'의 p-value를 확인한다. high인 경우 집단별로 차이가 없다.
