📌 일원분산분석(one-way ANOVA)
집단을 구분하는 독립변수가 한 개일 때 모집단 간 평균의 동일성 검정
- 귀무가설 : 집단 간 평균은 모두 동일하다.
- 대립가설 : 집단 간 평균은 모두 동일하지 않다. (한 집단이라도 통계적으로 유의한 차이를 보인다면 귀무가설 기각)
> # 살충제에 대한 실험 데이터
> # count : 살아남은 해충의 개수, spray : 스프레이 변수
> str(InsectSprays)
'data.frame':	72 obs. of  2 variables:
 $ count: num  10 7 20 14 14 12 10 23 17 20 ...
 $ spray: Factor w/ 6 levels "A","B","C","D",..: 1 1 1 1 1 1 1 1 1 1 ...
> head(InsectSprays)
  count spray
1    10     A
2     7     A
3    20     A
4    14     A
5    14     A
6    12     A

> # 집단별 표본 크기
> tapply(InsectSprays$count, InsectSprays$spray, length)
 A  B  C  D  E  F
12 12 12 12 12 12

> tapply(InsectSprays$count, InsectSprays$spray, mean)  # 살충제별 평균
        A         B         C         D         E         F
14.500000 15.333333  2.083333  4.916667  3.500000 16.666667

> tapply(InsectSprays$count, InsectSprays$spray, sd)  # 살충제별 표준편차
       A        B        C        D        E        F
4.719399 4.271115 1.975225 2.503028 1.732051 6.213378

> library(gplots)
> windows(width=12, height=8)  # window 창 열기
📌 집단 간 차이 그래프로 시각화
plotmeans()
plotmeans(종속변수 ~ 독립변수, data=)
집단별 평균과 평균에 대한 95% 신뢰구간 그래프
> plotmeans(count ~ spray, data=InsectSprays,
+           barcol ="tomato", barwidth=,
+           col="cornflowerblue", lwd=2,
+           xlab="Type of Sprays", ylab="Insect Count",
+           main="Performance of Insect Sprays")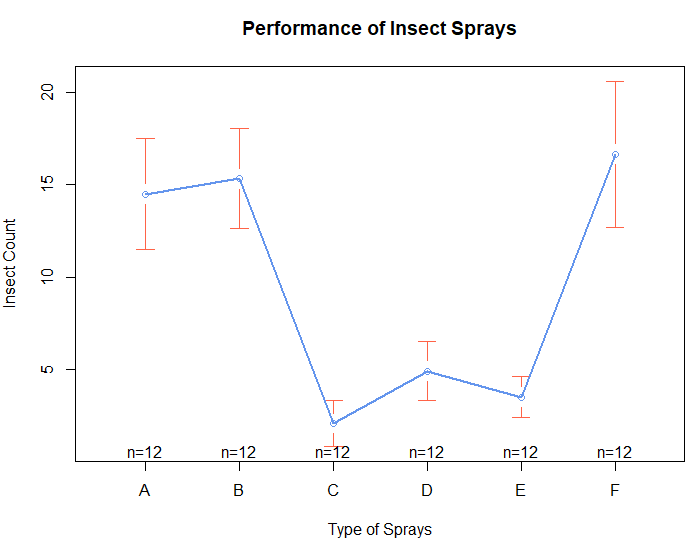
boxplot()
boxplot(종속변수 ~ 독립변수, data=)
> boxplot(count ~ spray, data=InsectSprays, col="tomato",
+         xlab="Type of Sprays", ylab="Insect Count",
+         main="Performance of Insect Sprays")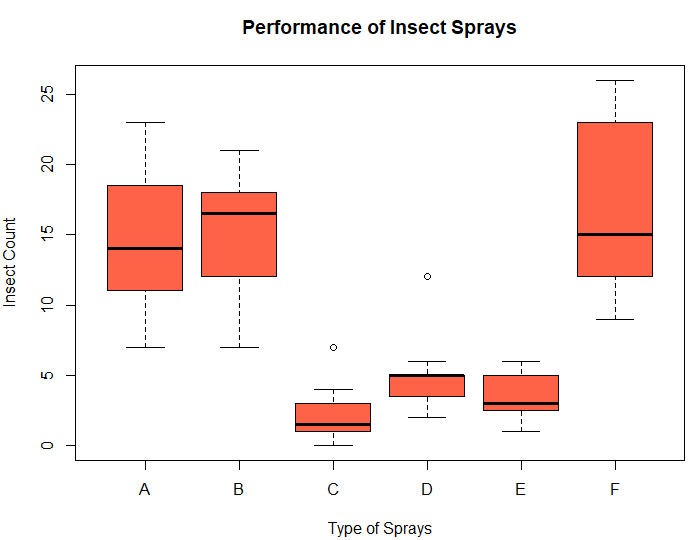
📌 분산분석(ANOVA)
aov(종속변수 ~ 독립변수, data=)
> spray.aov <- aov(count ~ spray, data=InsectSprays)
> spray.aov
Call:
   aov(formula = count ~ spray, data = InsectSprays)

Terms:
                   spray Residuals
Sum of Squares  2668.833  1015.167
Deg. of Freedom        5        66

Residual standard error: 3.921902
Estimated effects may be unbalanced

> summary(spray.aov)
            Df Sum Sq Mean Sq F value Pr(>F)
spray        5   2669   533.8    34.7 <2e-16 ***
Residuals   66   1015    15.4
---
Signif. codes:  0 ‘***’ 0.001 ‘**’ 0.01 ‘*’ 0.05 ‘.’ 0.1 ‘ ’ 1
귀무가설을 기각한다. 즉, 평균에 차이가 있다. 그러나 어떤 집단의 평균이 다른 건지는 알 수 없다.
어떤 집단 간에 차이가 있는가❓
model.tables
model.tables(분산분석 모델, type=c("mean", "effects")
개별 집단간 평균 차이 확인
# type="mean" 전체 평균과 함께 각 집단의 평균
> model.tables(spray.aov, type="mean")
Tables of means
Grand mean

9.5

 spray
spray
     A      B      C      D      E      F
14.500 15.333  2.083  4.917  3.500 16.667

# type="effects" : 각 집단평균과 전체평균의 차이
> model.tables(spray.aov, type="effects")
Tables of effects

 spray
spray
     A      B      C      D      E      F
 5.000  5.833 -7.417 -4.583 -6.000  7.167
⭐ 사후분석 ⭐
TukeyHSD()
터키 HSD 검정(Tukey HSD test)
통계적으로 유의미한 차이가 있는지를 검정한다.
> spray.compare <- TukeyHSD(spray.aov)
> spray.compare
  Tukey multiple comparisons of means
    95% family-wise confidence level

Fit: aov(formula = count ~ spray, data = InsectSprays)

$spray
           diff        lwr       upr     p adj
B-A   0.8333333  -3.866075  5.532742 0.9951810
C-A -12.4166667 -17.116075 -7.717258 0.0000000
D-A  -9.5833333 -14.282742 -4.883925 0.0000014
E-A -11.0000000 -15.699409 -6.300591 0.0000000
F-A   2.1666667  -2.532742  6.866075 0.7542147
C-B -13.2500000 -17.949409 -8.550591 0.0000000
D-B -10.4166667 -15.116075 -5.717258 0.0000002
E-B -11.8333333 -16.532742 -7.133925 0.0000000
F-B   1.3333333  -3.366075  6.032742 0.9603075
D-C   2.8333333  -1.866075  7.532742 0.4920707
E-C   1.4166667  -3.282742  6.116075 0.9488669
F-C  14.5833333   9.883925 19.282742 0.0000000
E-D  -1.4166667  -6.116075  3.282742 0.9488669
F-D  11.7500000   7.050591 16.449409 0.0000000
F-E  13.1666667   8.467258 17.866075 0.0000000

> # 살충제 D와 C만 추출
> spray.compare$spray['D-C', ]  # 두 살충제간 차이가 없다.
      diff        lwr        upr      p adj
 2.8333333 -1.8660752  7.5327418  0.4920707

 > plot(spray.compare, col="blue", las=1)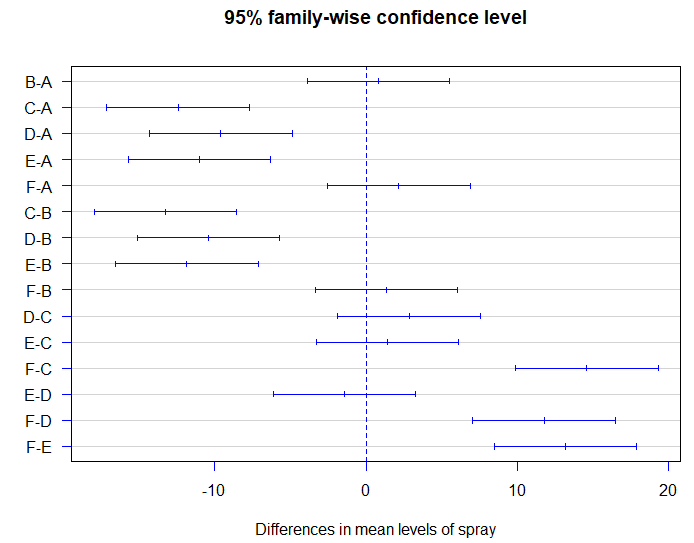
가로선은 집단 간 평균의 차이에 대한 신뢰구간을 나타내며, 0을 포함하지 않으면 통계적으로 유의하다.
glht()
glht() 이용해 TukeyHSD 검정 수행
glht(model=모델 객체, linfct=검정할 가설)
> library(multcomp)

> tuk.hsd <- glht(model=spray.aov, linfct=mcp(spray="Tukey"))
> tuk.hsd

	 General Linear Hypotheses

Multiple Comparisons of Means: Tukey Contrasts


Linear Hypotheses:
           Estimate
B - A == 0   0.8333
C - A == 0 -12.4167
D - A == 0  -9.5833
E - A == 0 -11.0000
F - A == 0   2.1667
C - B == 0 -13.2500
D - B == 0 -10.4167
E - B == 0 -11.8333
F - B == 0   1.3333
D - C == 0   2.8333
E - C == 0   1.4167
F - C == 0  14.5833
E - D == 0  -1.4167
F - D == 0  11.7500
F - E == 0  13.1667

> cld(tuk.hsd, level=0.05)
  A   B   C   D   E   F
"b" "b" "a" "a" "a" "b"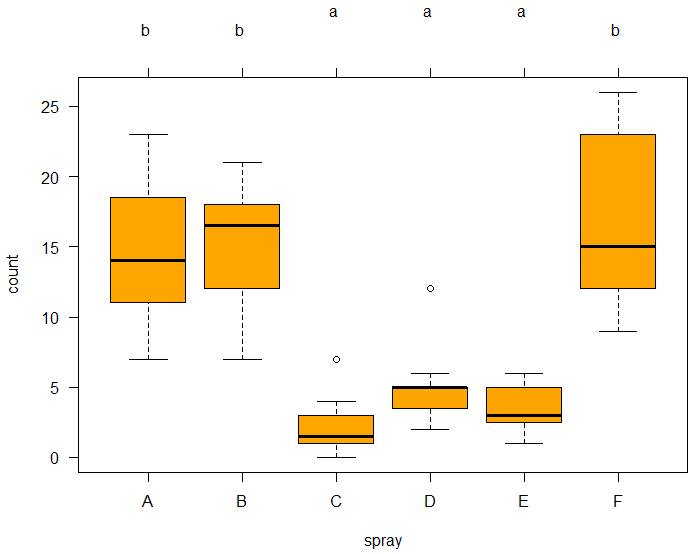
A, B, F의 평균이 같고, C, D, E의 평균이 같다.
📌 분산분석의 가정
- 정규성 : 종속변수는 정규분포를 따른다.
- 등분산성 : 각 집단의 분포는 모두 동일한 분산을 가진다.
정규성
qqplot(data vector, id=)
> library(car)

> plot(cld(tuk.hsd, level=0.05), col="orange", las=1)
> qqPlot(InsectSprays$count, id=FALSE, pch=20, col="deepskyblue",
+        xlab="Theoretical Quantiles", ylab="Empirical Quantiles",
+        main="Q-Q Plot")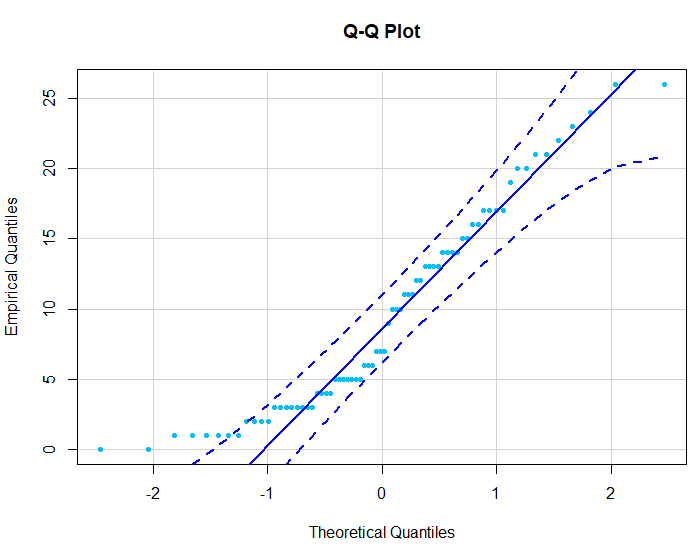
> shapiro.test(InsectSprays$count)

	Shapiro-Wilk normality test

data:  InsectSprays$count
W = 0.9216, p-value = 0.0002525
정규성 가정을 만족하지 못한다.
이상점
car 패키지의 outlietTest() 함수
> outlierTest(spray.aov)
No Studentized residuals with Bonferroni p < 0.05
Largest |rstudent|:
   rstudent unadjusted p-value Bonferroni p
69 2.590966           0.011804       0.8499
Bonferroni p > 0.05 이면 이상점이 존재하지 않는다.
등분산성
car 패키지의 leveneTest() 함수 or stats 패키지의 bartlett.test() 함수
> leveneTest(count ~ spray, data=InsectSprays)
Levene's Test for Homogeneity of Variance (center = median)
      Df F value   Pr(>F)
group  5  3.8214 0.004223 **
      66
---
Signif. codes:  0 ‘***’ 0.001 ‘**’ 0.01 ‘*’ 0.05 ‘.’ 0.1 ‘ ’ 1

> bartlett.test(count ~ spray, data=InsectSprays)

	Bartlett test of homogeneity of variances

data:  count by spray
Bartlett's K-squared = 25.96, df = 5, p-value = 9.085e-05
귀무가설을 기각하므로 등분산성을 만족하지 못 한다.
📌 등분산 가정 O : aov()
> summary(aov(count ~ spray, data=InsectSprays))
            Df Sum Sq Mean Sq F value Pr(>F)
spray        5   2669   533.8    34.7 <2e-16 ***
Residuals   66   1015    15.4
---
Signif. codes:  0 ‘***’ 0.001 ‘**’ 0.01 ‘*’ 0.05 ‘.’ 0.1 ‘ ’ 1
📌 등분산 가정 X : oneway.test()
> oneway.test(count ~ spray, data=InsectSprays)

	One-way analysis of means (not assuming equal variances)

data:  count and spray
F = 36.065, num df = 5.000, denom df = 30.043, p-value = 7.999e-12
📌 등분산 가정 O : equal=TRUE
> oneway.test(count ~ spray, data=InsectSprays,var.equal=TRUE)

	One-way analysis of means

data:  count and spray
F = 34.702, num df = 5, denom df = 66, p-value < 2.2e-16
등분산 가정을 만족하지 못 한다.
따라서 이번 데이터셋의 경우 oneway.test() 함수로 일원분산분석을 수행하는 것이 더 적절해 보인다.
