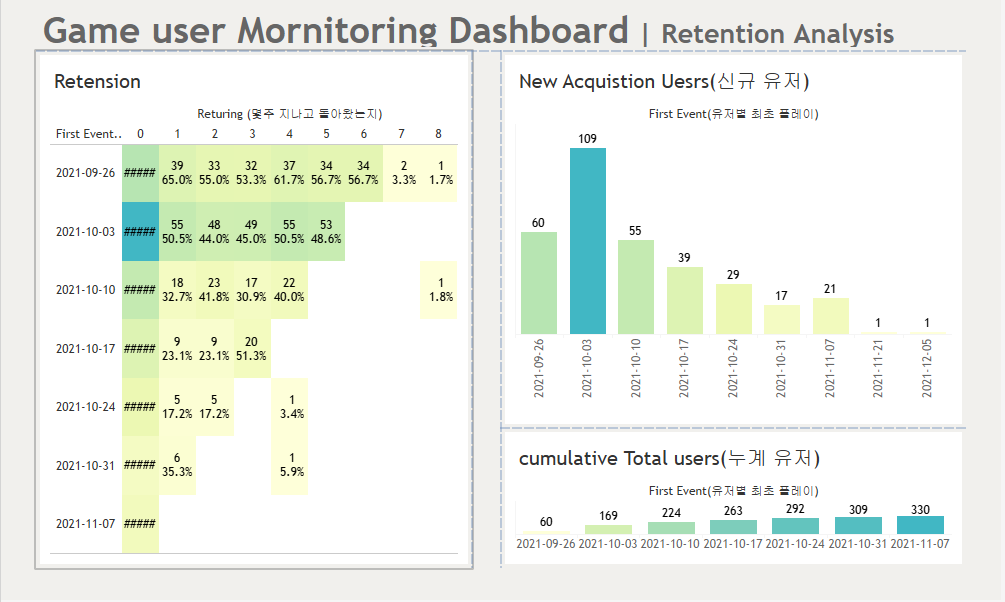
Retension 대시보드
기능 : 기존 고객 잔존율 , 신규 고객 획득 트렌드 관찰
요구사항
-> 최근 몇주간 기존 고객 유지율 보여줄것
-> 신규 획득 고객 트랜드를 보여줄것
-> 총 누적 고객 트렌드를 보여줄것
view % Data % calc
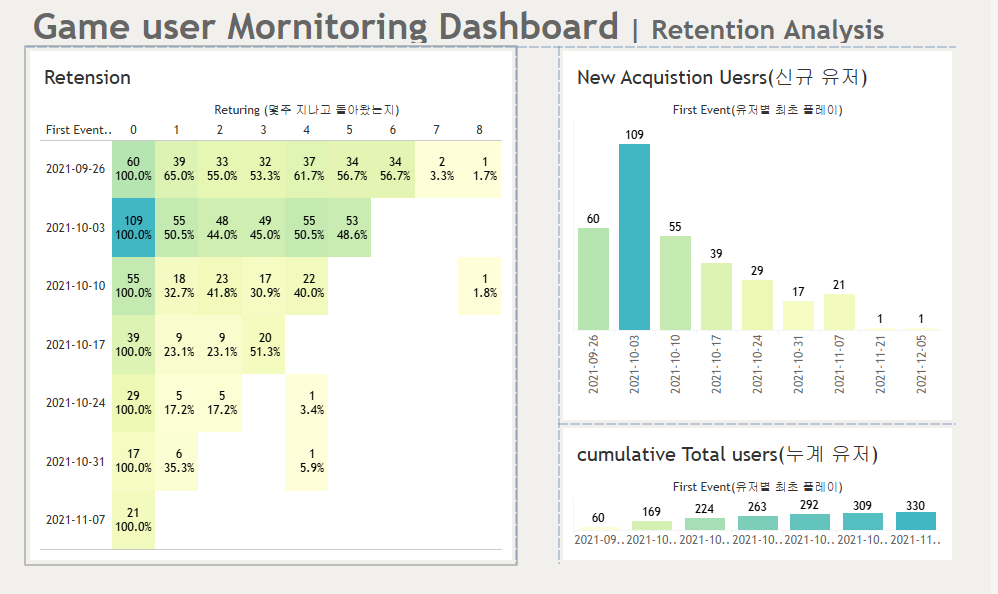
1.Retention analysis
-> user id + Event Time
---> 유저별 최초 플레이 시점 : Fixed[Uesr ID]:Min[Event Time]
---> 재방문까지 걸린 주 : DATEDIFF('week',최초 플레이 시점,Event Time)
---> 리텐션 : 재방문까지 걸린 주 - 각각 User Id 수 / 해당 주차 획득 User Id 수
2. New Acquistion Users
-> 유저별 최초 플레이 시점 + COUNTD(user id)
3. cumulatvie Total Users
-> 유저별 최초 플레이 시점 + COUNTD(user id) + 테이블 계산'누계'
기본 시트 제작
1) New Acquistion Uesrs(신규 유저)
## 'First Event(유저별 최초 플레이)'

DATE(DATETRUNC('week',{FIXED [User ID] :MIN([Event Time])}))
-> 'First Event(유저별 최초 플레이)' 열선반에 올리고 정확한 날짜 , 불연속형으로 변경
2) 누계 유저
-> 열선반 : First Event(유저별 최초 플레이)
행선반 : user id 카운트(고유) -> 누계
3) Retension
## 'Returing (몇주 지나고 돌아왔는지)'

DATEDIFF('week',[First Event(유저별 최초 플레이)],[Event Time])
-> 열선반 :'Returing (몇주 지나고 돌아왔는지)' / 행선반 : 'First Event(유저별 최초 플레이)' / 레이블 ,색상에 uesr id 카운트(고유) 넣음
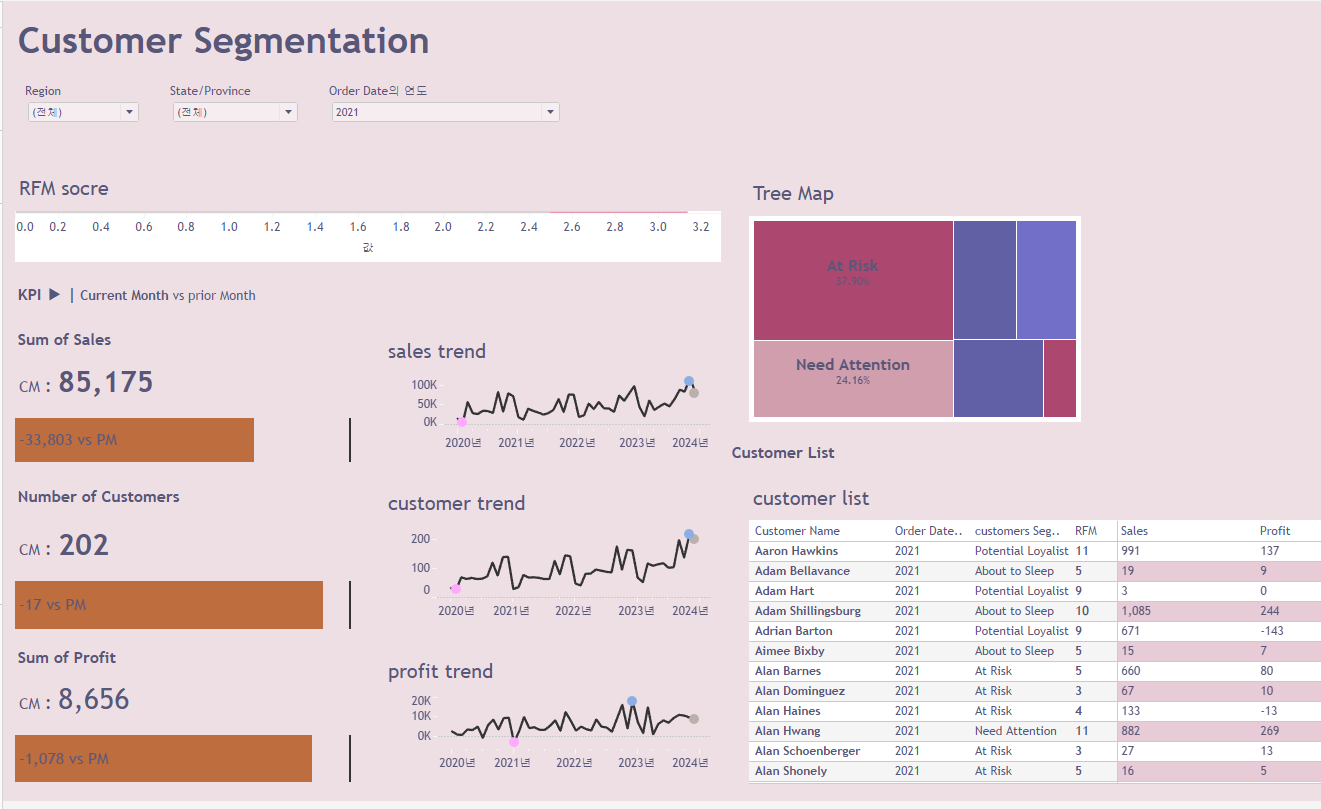
Maketing Segmentation 대시보드
기능 : 효율적 개인화 마케팅
분석 모델 : RFM Anlaysis (CRM마케팅 분야에서 널리 사용)
--> Recency : 고객이 얼마나 최근에 구매했는가?
--> Frequency : 고객이 얼마나 자주 방문했는가 ?
--> Monetary : 고객이 돈을 얼마나 썼는가
요구사항
1. 고객 세그먼트별 비중을 한눈에 볼 수 잇도록
2. 해당하는 고객 리스트와 정보를 보여줄것
3. 지역별 KPI 지표 트렌드(매출,고객,수익) 표시
view & Data & Calc
-> Customer Segmentation(customer name + order date + order Id + sales)
-> Recency(최근성)
--> DATEDIFF('day',{FIXED [Customer Name],Year([Order Date]) : MAX([Order Date])},[Max order Data of the Year])+1
-> Frequency(구매빈도)
--> {FIXED [Customer Name],Year([order date]) : [Number of order]}
-> Monetary (구매금액)
--> {FIXED [Customer Name],Year([order date]) : SUM([Sales])}
1. 기본 시트 만들기 (ben , trend)
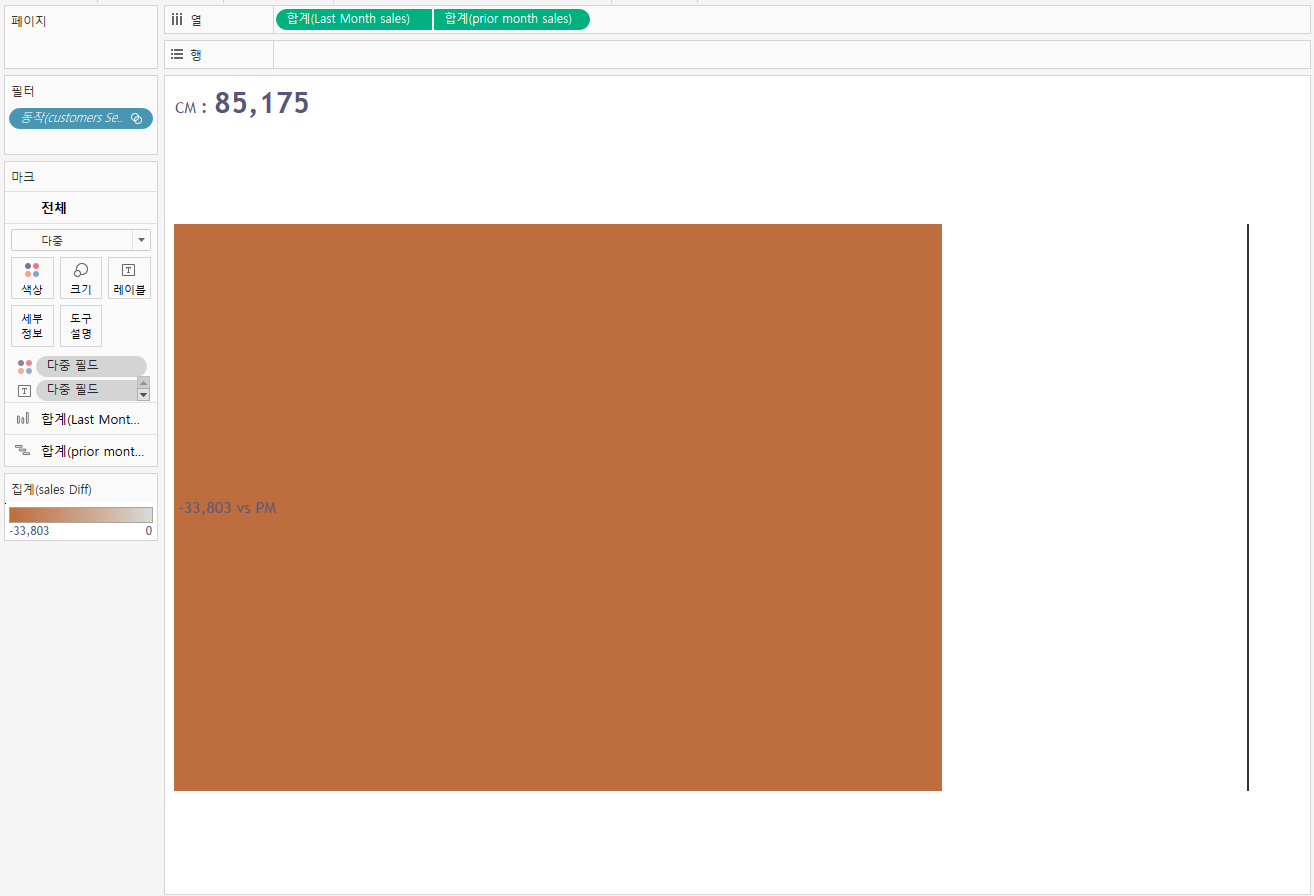
1) Sales/profit/customer Ban bar
## 'Last month'

[Order Date] > DATEADD('month',-1,{MAX([Order Date])})
## 'Last month sales'
IF [Last Month] = TRUE then [Sales] END ->최근한달 sales반환## 'prior Month(바로전 달)'
[Order Date] > DATEADD('month',-2,{MAX([Order Date])})
AND [Order Date] <= DATEADD('month',-1,{MAX([Order Date])})## 'piror month sales'
IF [prior Month(바로전 달)] = TRUE then [Sales] END
-> Last month sales , prior month sales 이중축으로 하고 하나는 막대 , 하나는 간트차트
## 'sales diff'

SUM([Last Month sales]) - SUM([prior month sales])
->'sales diff' 색상에 넣고 0기준에 따라 색 다르게
-> profit Ban bar , customer ban bar 마찬 가지로 진행
2)sales/profit/customer trend
## 'dot-sales'
IF SUM([Sales])=WINDOW_MIN(SUM([Sales])) then 'min'
ELSEIF SUM([Sales]) = WINDOW_MAX(SUM([Sales])) then 'max'
ELSEIF LAST()=0 then 'most recent' END
-> 열선반 : order date(월) , 행선반 : sales 이중축 , 색변경
-> 마찬가지로 나머지도 진행
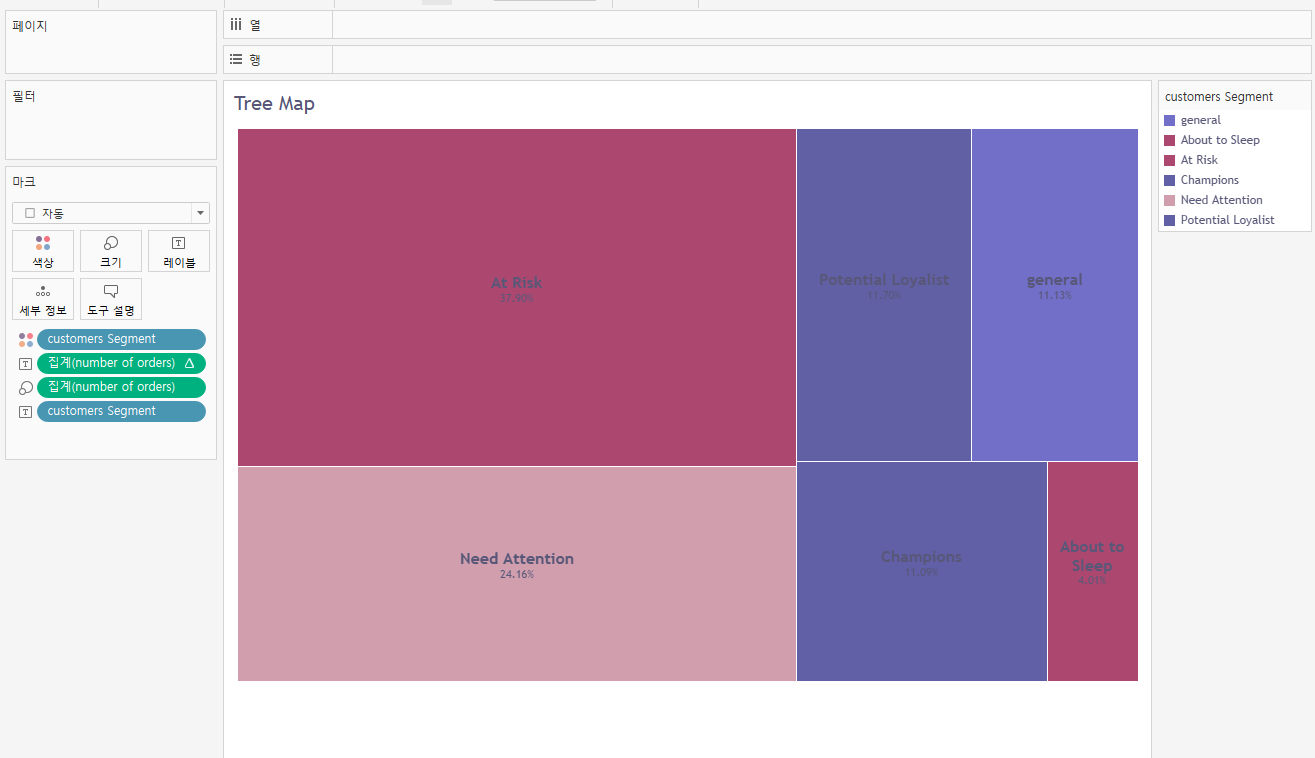
2.Tree map 시트 만들기
1)변수만들기
-> Countd(order id)인 'number of orders'만듬
## 'Max order Data of the Year'

{FIXED YEAR([Order Date]) : MAX([Order Date])}
## 'Recency'
DATEDIFF('day',{FIXED [Customer Name],Year([Order Date]) : MAX([Order Date])}
,[Max order Data of the Year]) ->해당연도의 최근부터 해당 고객이 주문한 가장 최근 day 차이
## 'frequency'

{FIXED [Customer Name],YEAR([Order Date]): COUNTD([Order ID])}
## 'monetary'

{FIXED [Customer Name],YEAR([Order Date]):SUM([Sales])}
## 'recency score'

IF [Recency] >= {FIXED YEAR([Order Date]) : PERCENTILE([Recency],0.75)} then 1
ELSEIF [Recency] >= {FIXED YEAR([Order Date]) : PERCENTILE([Recency],0.5)} then 2
ELSEIF [Recency] >= {FIXED YEAR([Order Date]) : PERCENTILE([Recency],0.25)} then 3
ELSE 4 END
## 'Frequency score'
IF [Recency] >= {FIXED YEAR([Order Date]) : PERCENTILE([Recency],0.75)} then 1
ELSEIF [Recency] >= {FIXED YEAR([Order Date]) : PERCENTILE([Recency],0.5)} then 2
ELSEIF [Recency] >= {FIXED YEAR([Order Date]) : PERCENTILE([Recency],0.25)} then 3
ELSE 4 END ## 'Monetary score'
IF [Monetary] >= {FIXED YEAR([Order Date]) : PERCENTILE([Monetary],0.75)} then 4
ELSEIF [Monetary] >= {FIXED YEAR([Order Date]) : PERCENTILE([Monetary],0.5)} then 3
ELSEIF [Monetary] >= {FIXED YEAR([Order Date]) : PERCENTILE([Monetary],0.25)} then 2
ELSE 1 END
## 'customer segment'

if [Frequency score]>= 4 and [Monetary score]>= 4 and [Recency score]>= 4 then 'Champions'
ELSEIF [Recency score]>=2 and [Recency score]<=4    and [Frequency score]>=3 and [Frequency score]<=4 and [Monetary score]>=5 then 'Loyal Customers'
ELSEIF [Recency score]>=3  and [Frequency score]>=1 and [Frequency score]<=3 and [Monetary score]>=1 and [Monetary score]<=3 then 'Potential Loyalist'
ELSEIF [Recency score]>=4   and [Frequency score]<2   and [Monetary score]<2 then 'New Customers'
ELSEIF [Recency score]>=3 and [Recency score]<=4    and [Frequency score]<2 and [Monetary score]<2 then 'Promising'
ELSEIF [Recency score]>=3 and [Recency score]<=4    and [Frequency score]>=3 and [Frequency score]<=4 and [Monetary score]>=3 and [Monetary score]<=4 then 'Need Attention'
ELSEIF [Recency score]>=2 and [Recency score]<=3    and [Frequency score]<3 and [Frequency score]<3 then 'About to Sleep'
ELSEIF [Recency score]<3  and [Frequency score]>=2 and [Frequency score]<=5 and [Frequency score]>=2 and [Monetary score]<=5 then 'At Risk'
ELSEIF [Recency score]<2  and [Frequency score]>=4 and [Monetary score]>=4  then 'Cant Lose Them'
ELSEIF [Recency score]>=2 and [Recency score]<=3 and [Frequency score]>=2 and [Frequency score]<=3 and [Monetary score]>=2 and [Monetary score]<=3 then 'Hibernating'
ELSEIF [Recency score]<2  and [Frequency score]<2  and [Monetary score]<2  then 'Lost' END
2) 필드 넣기
-> 'customer segment'는 색상 , 'number of orders'는 크기에 넣고 customer segment,number of orders 레이블
3. customer list 시트 만들기
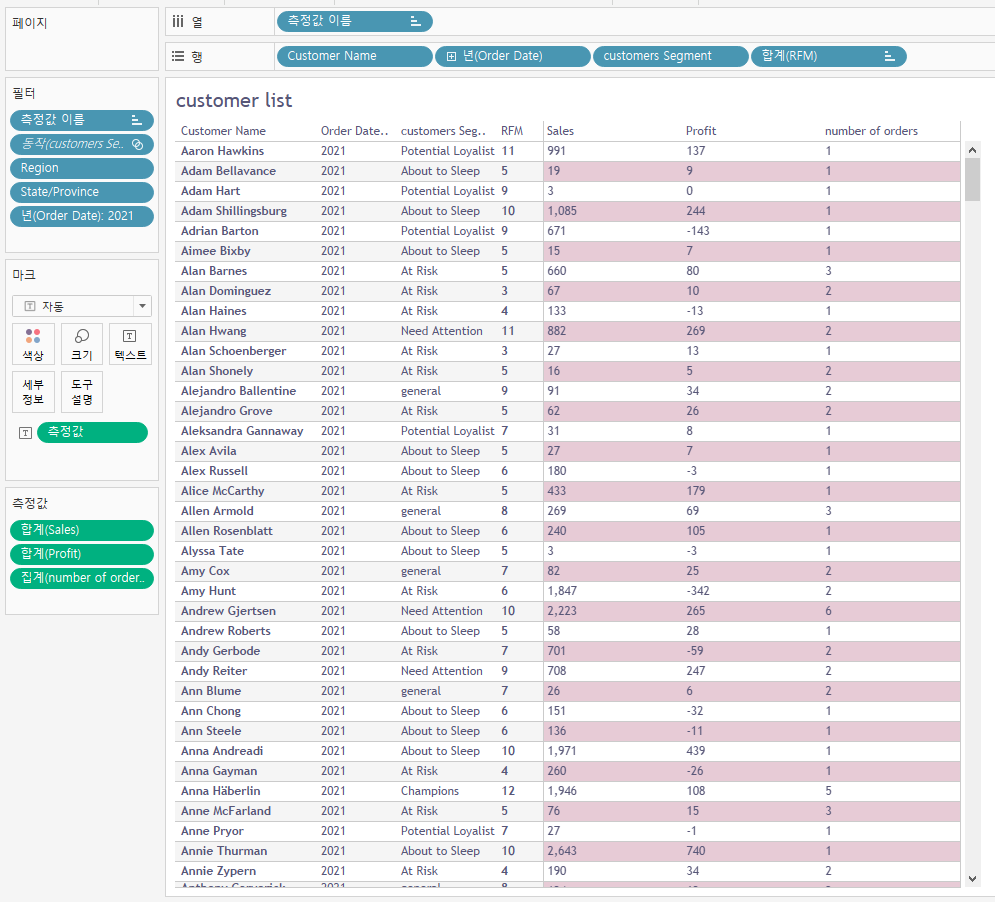
-> [Recency score]+[Frequency score]+[Monetary score] 인 'RFM' 만들기
-> cusmoter name , order date(연) , customers segment , Rfm 측정값 넣기
4. RFM 시트 만들기
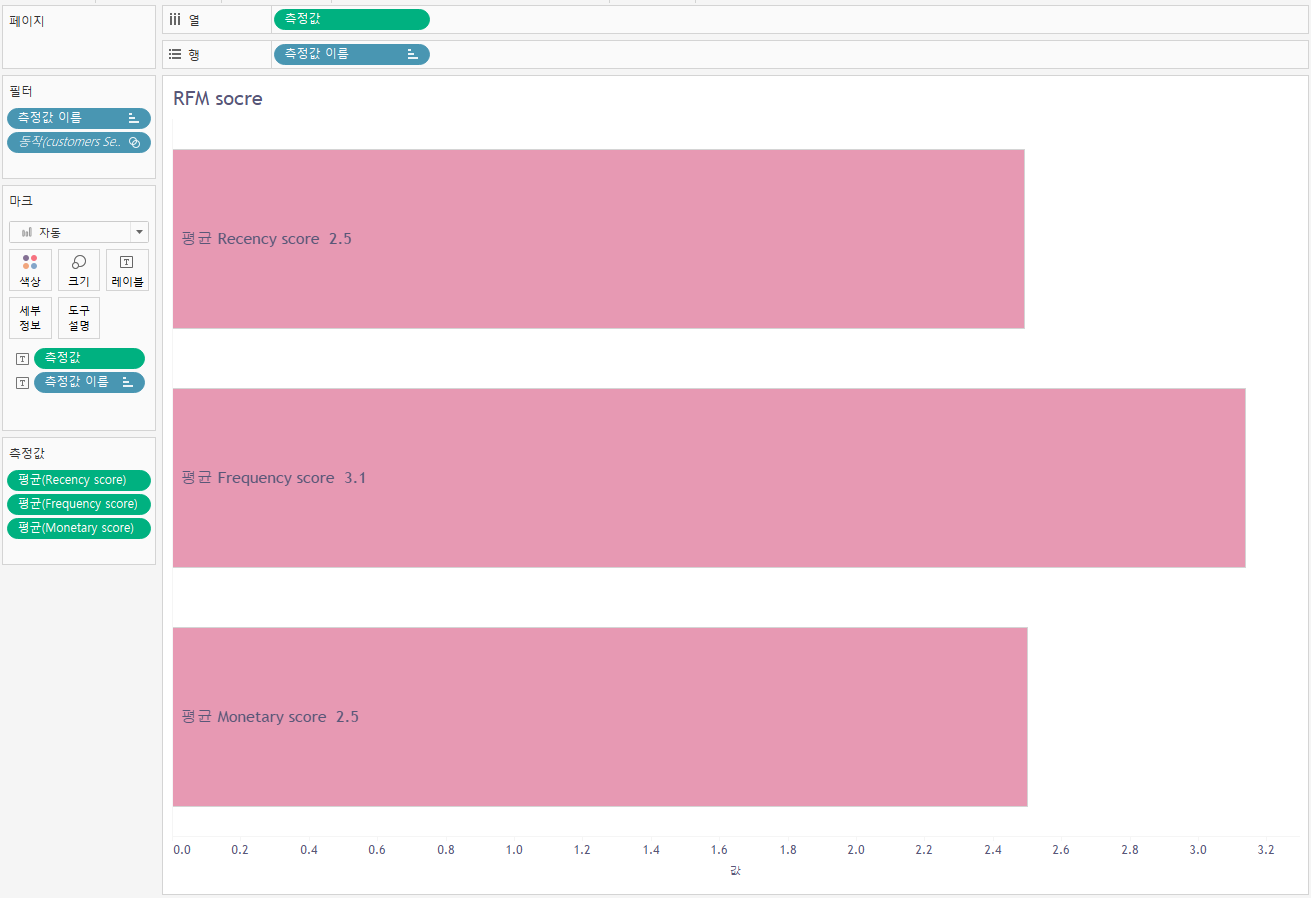
-> 스코어 3개 변수 측정값으로 넣음 , 측정값필드 열선반에 올림 (열선반:측정값 , 행선반:측정값이름)
-> 레이블에 측정값,측정값이름 넣고 막대로 바꿈
-> 측정값을 평균으로 바꾸고 정렬