오차행렬
학습된 분류 모델이 예측을 수행하면서 얼마나 헷갈리고 있는지도 함께 보여줌
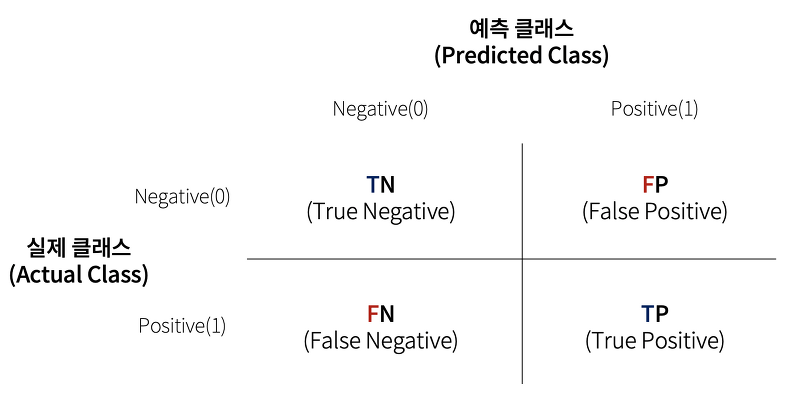
TN: 예측값을 negative 0으로 예측 -> 실제값도 nagetive 0
FP: 예측값을 Positive 1로 예측 -> 실제값은 negative 0
FN: 예측값을 negative 0으로 예측 -> 실제값은 positive 1
TP: 예측값을 positive 1로 예측 -> 실제값도 positive 1
confusion_matrix() API 제공
from sklearn.metrics import confusion_matrix

# 앞절의 예측 결과인 fakepred와 실제 결과인 y_test의 Confusion Matrix출력
confusion_matrix(y_test , fakepred)
array([[405, 0],
[ 45, 0]], dtype=int64)
정확도 = 예측 결과와 실제 값이 동일한 건수/전체 데이터 수 = (TN + TP)/(TN FP + FN + TP)
일반적으로 Positive는 1, negative는 0

mingdue02