Infrastructure Enhancement and Zero-Downtime Deployment
This Post translate from 인프라 고도화 및 무중단 배포.
writer: Im Subin(robin)
Distributed Server Setup
Summary of Changes and Additions
- Added a production EC2 instance
- Added an ALB
- Dockerfile (log identifier settings)
- compose.yml (log identifier settings)
- compose.dev.yml (log identifier settings, added Promtail)
- logback-spring.xml (log identifier settings)
- Added /health API (for ALB Health Check API)
- application-common.yml (log identifier settings)
- Development server:
- Modified custom.conf (passing request identifier to WAS)
- Added nginx.conf (adding request identifier to logs)
- Added Promtail configuration (collecting Nginx logs)
- Monitoring server:
- Modified Prometheus config file (added new EC2 instance to monitoring targets)
- Deleted existing production WAS EC2 instance
- Deleted existing production DB instance
EC2 Setup
As this article focuses on distributed environment setup, the basic EC2 creation steps are omitted. Since the setup is distributed across two WAS instances, we created two instances.
Swap Memory Setup
Higher EC2 hardware specifications increase costs, especially memory. However, disk space is relatively affordable. Given that our service doesn’t require ultra-fast memory performance, we used part of the disk as swap memory in Ubuntu with the following commands:
1. sudo free -m
2. sudo swapon -s
3. (if active swap memory exists) sudo swapoff -a
4. sudo fallocate -l 2G /swapfile
5. sudo chmod 600 /swapfile # Set permissions
6. sudo mkswap /swapfile    # Prepare for activation
7. sudo swapon /swapfile    # Activate
8. sudo nano /etc/fstab # Add "/swapfile swap swap defaults 0 0" at the bottom
Docker Installation and Permission
Since Docker is used in the deployment environment, it needs to be installed on EC2. Ubuntu doesn’t include the Docker repository by default, so a few additional steps are required.
1. sudo apt update
2. sudo apt install apt-transport-https ca-certificates curl software-properties-common
3. curl -fsSL https://download.docker.com/linux/ubuntu/gpg | sudo apt-key add -
4. sudo add-apt-repository "deb [arch=amd64] https://download.docker.com/linux/ubuntu bionic stable"
5. sudo apt update
6. sudo apt install docker-ce
7. sudo usermod -aG docker ${USER}
8. Restart the shell session
Recent Docker versions include Docker Compose, so separate installation is unnecessary.
Installing GitHub Actions Self-Hosted Runner
If an EC2 instance is accessible by SSH from any location, it can be a security risk. Many companies restrict SSH access to within their internal or VPN networks. As external SSH access to EC2 is restricted at Woowahan Tech Campus, files built via GitHub Actions cannot be sent to EC2. Using GitHub Actions’ Self-Hosted Runner provides a solution. Follow GitHub’s guide for setup.
Self-Hosted Runner initiates the connection from the server to GitHub, so it works under the current environment where outbound policies are unrestricted.
ALB Setup and Configuration
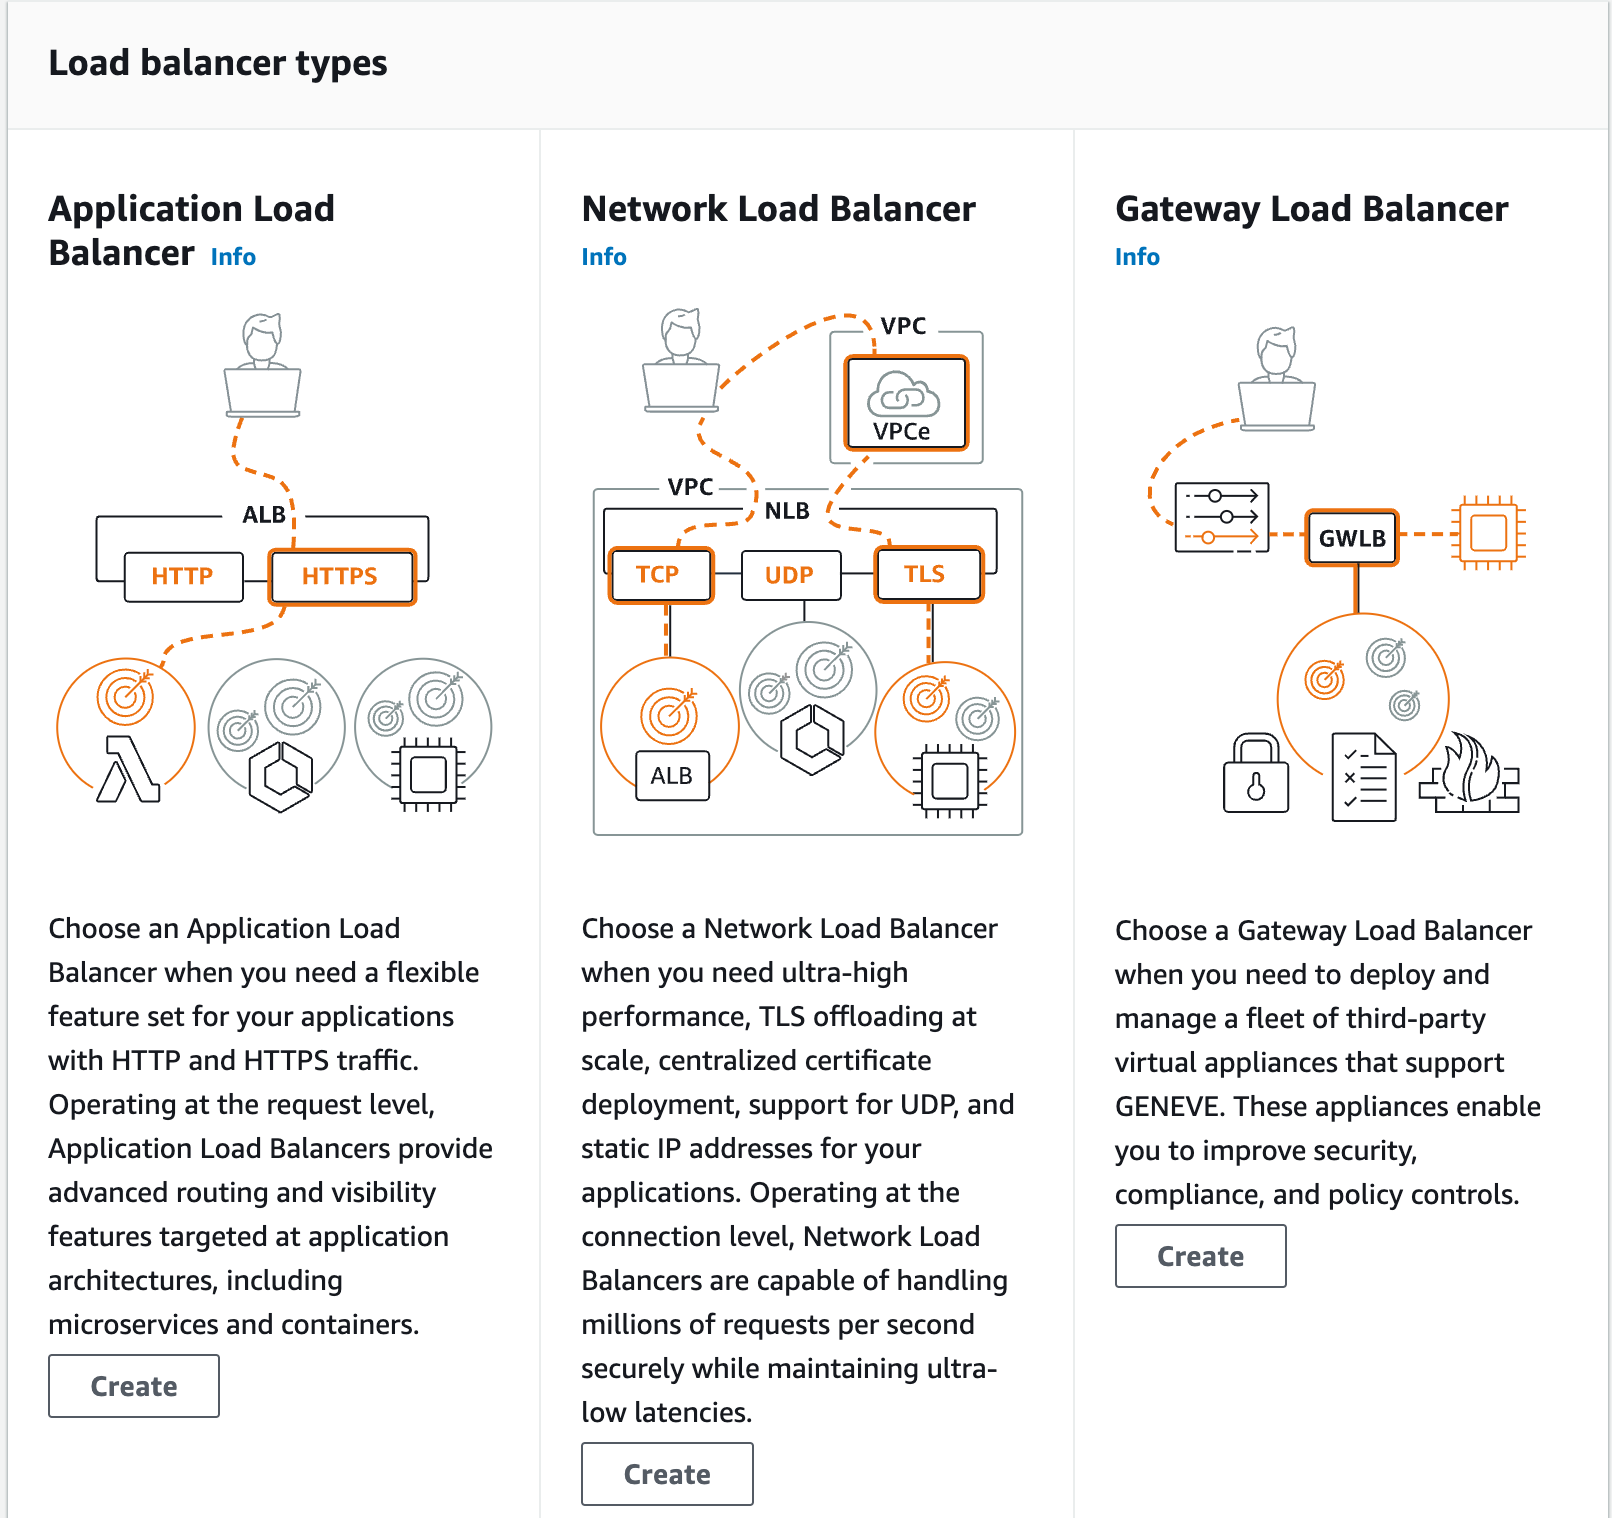
ALB (Application Load Balancer) operates on the application layer (OSI Layer 7). We configured ALB for HTTP and HTTPS protocols, assigning a name and selecting a VPC and subnet.
Listener & Rule
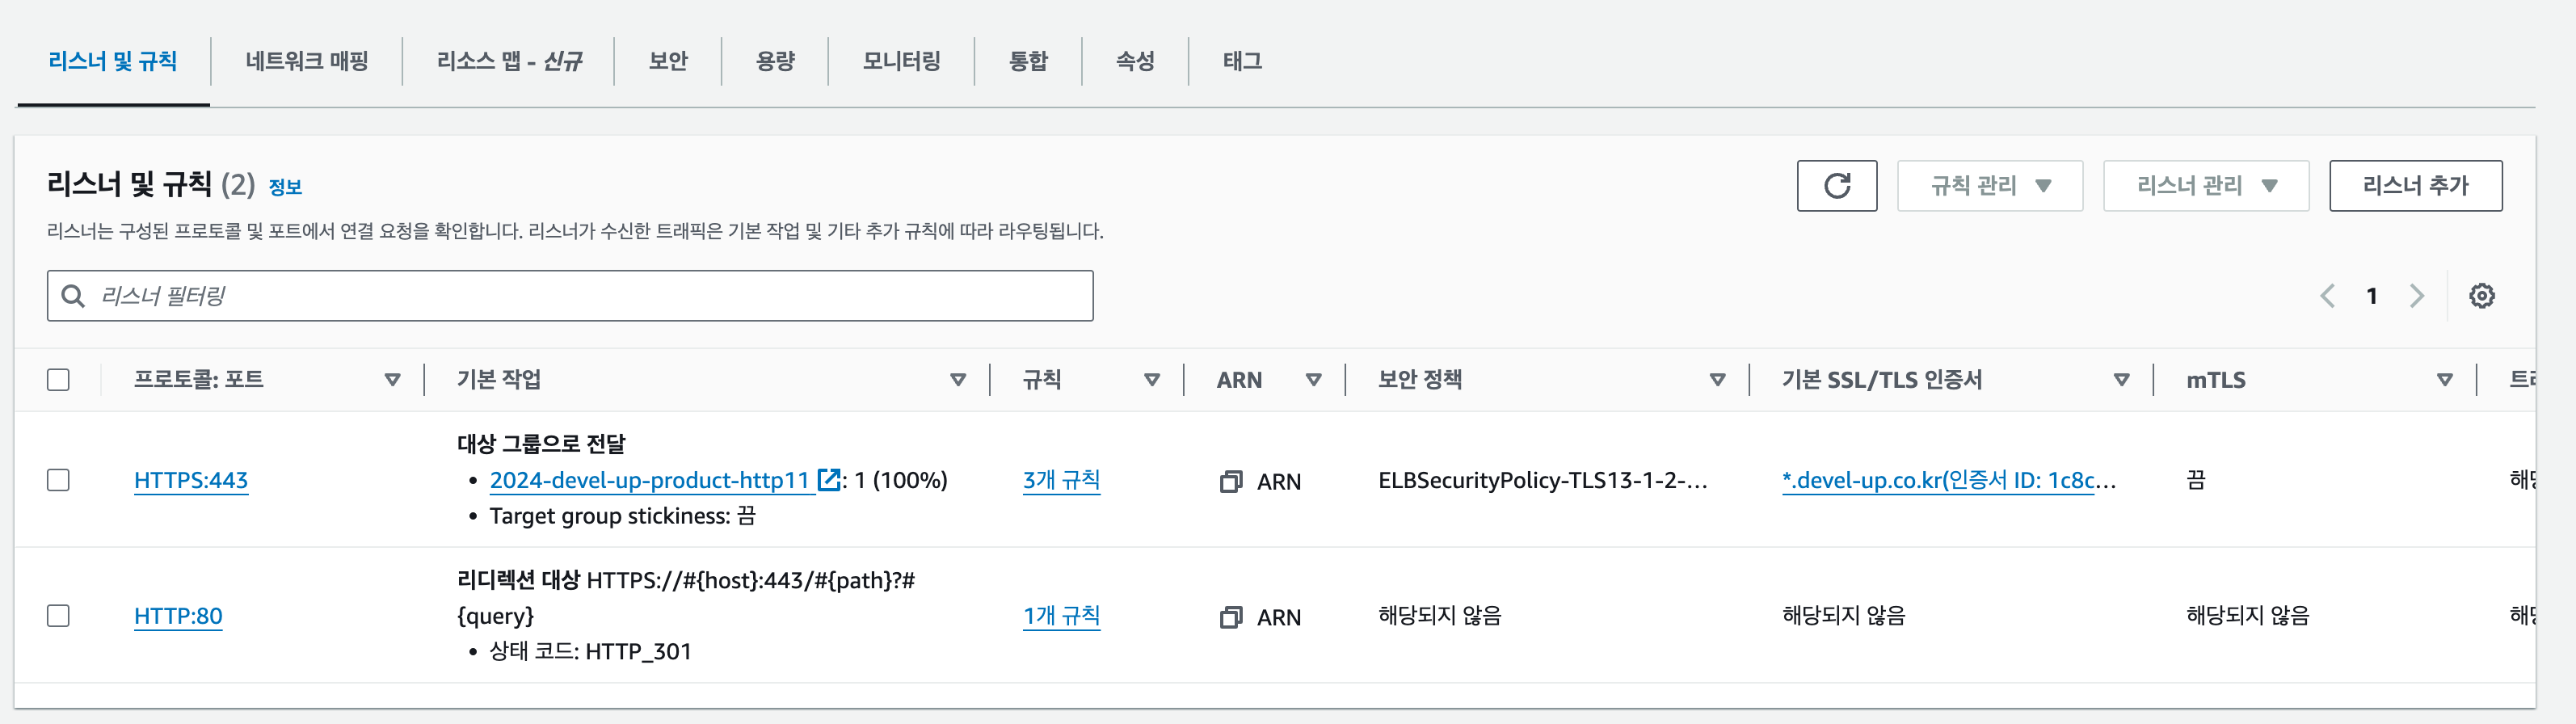
Listeners determine which protocol and port to listen on, while Rules define how to route requests. Priority can be assigned to each Rule within a Listener.
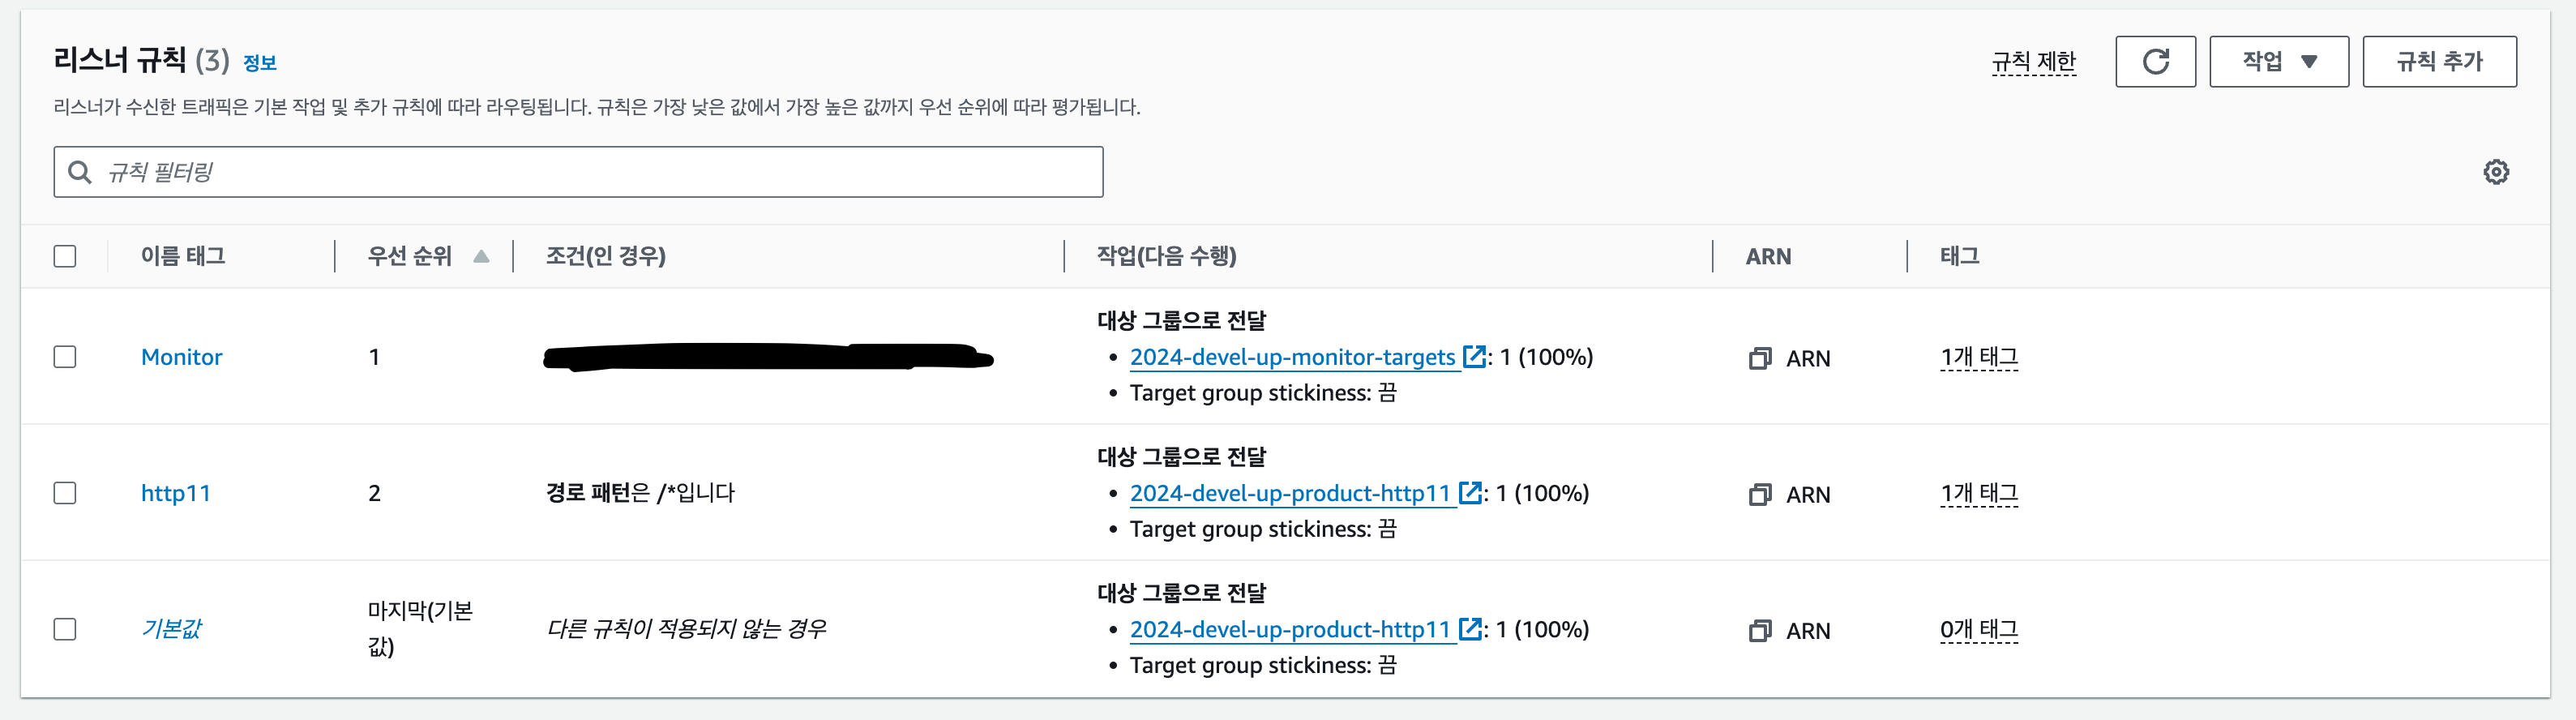
The HTTP Listener includes a rule to redirect HTTP requests to HTTPS.
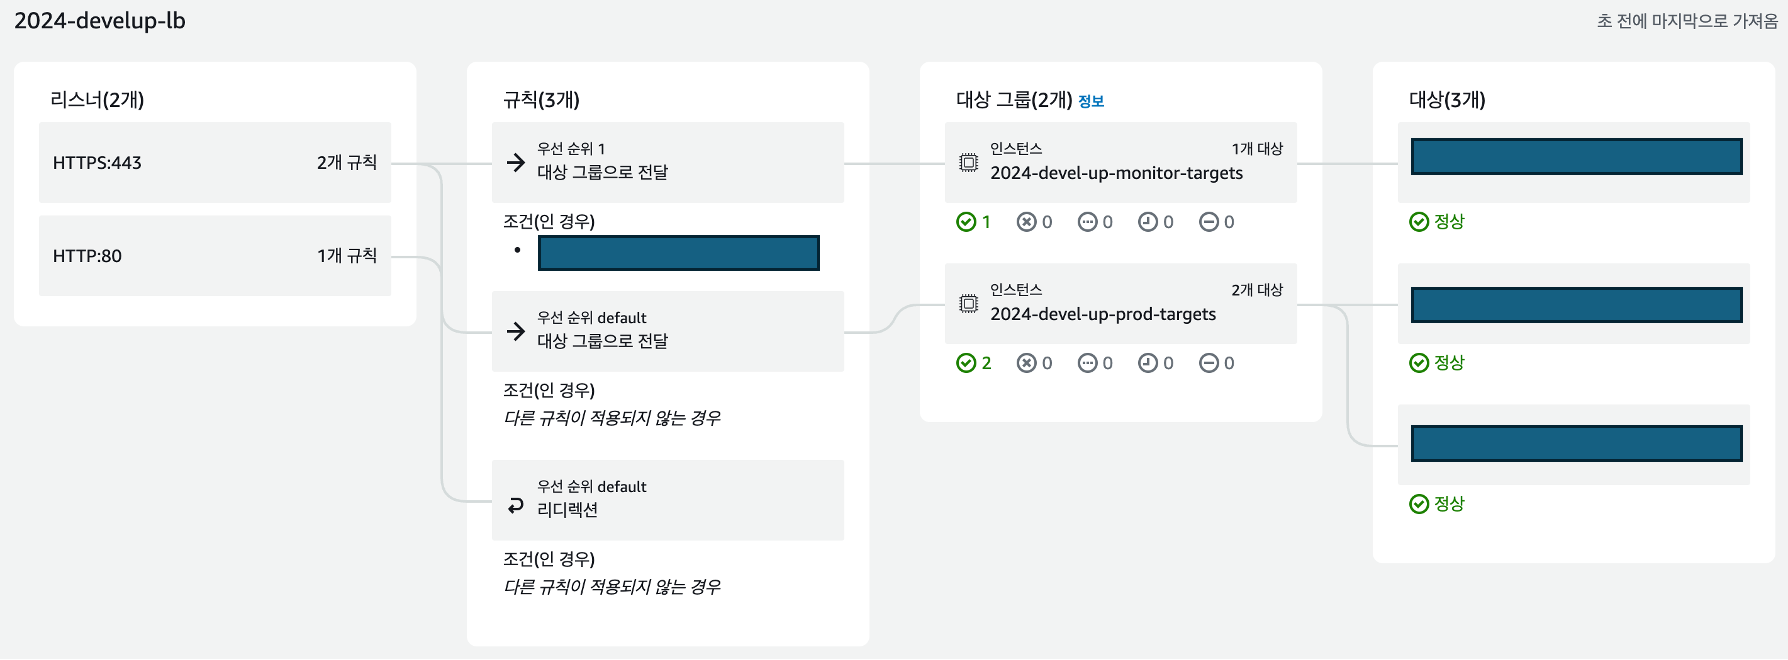
The Resource Map feature provides a comprehensive view of Listeners and Rules.
Target Group
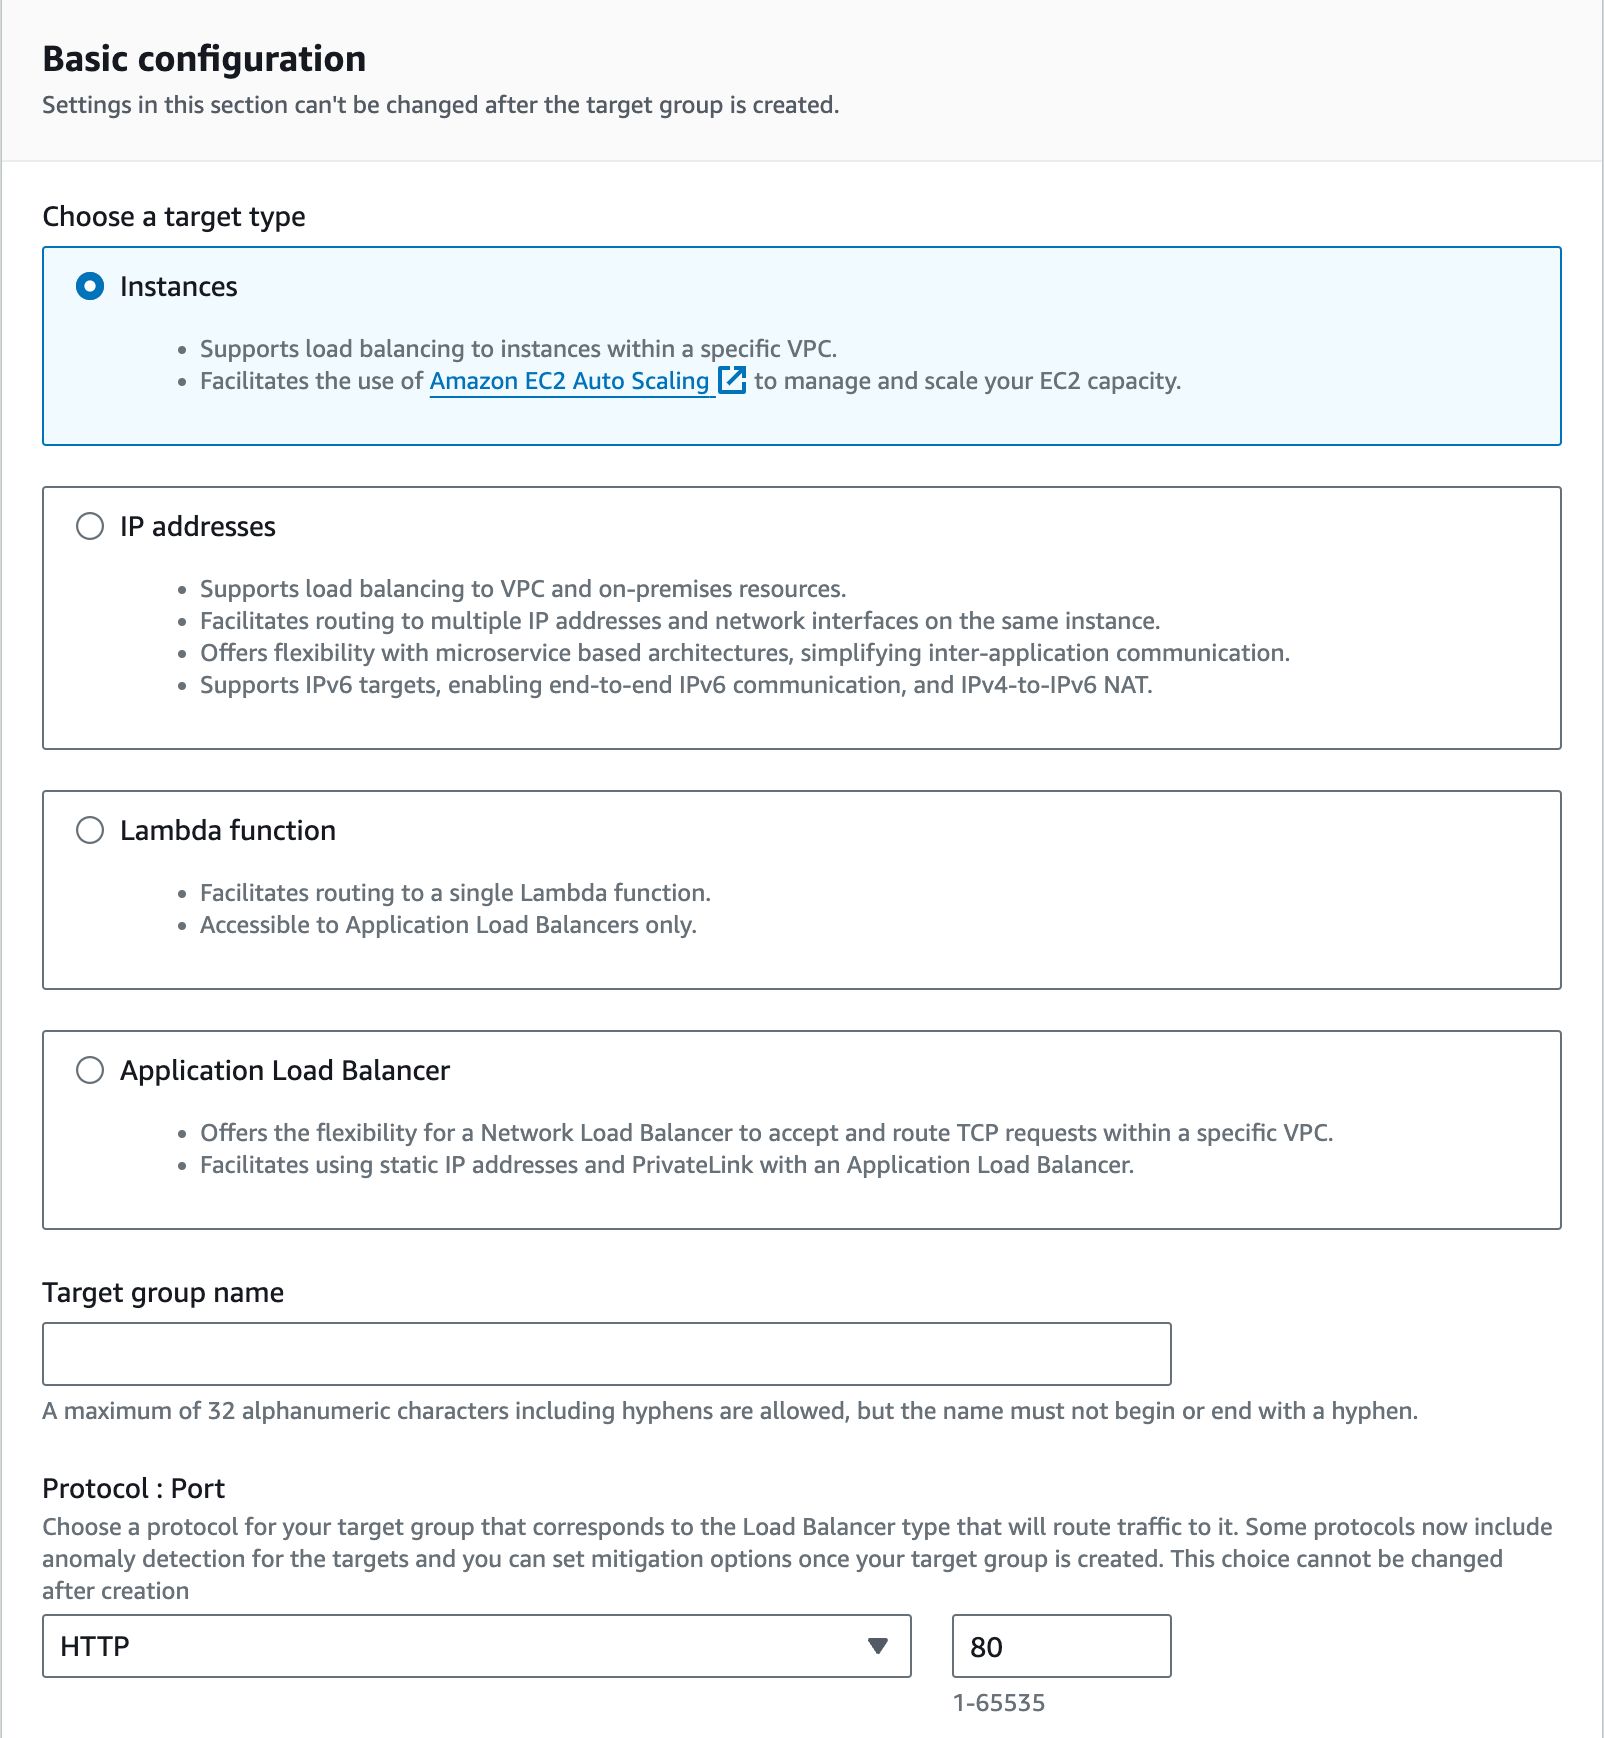
The Target Group defines the targets to which the load balancer will distribute requests. In DevelUp, we use a production server group and a monitoring server group. Since the web server within each EC2 instance handles requests, we set the type to Instances.
After selecting the protocol, port, IP version, VPC, and protocol version, choose the production EC2 instance from within the VPC and add it to the Target Group. Proper security group configuration is essential to ensure that the load balancer can access the EC2 instance on the selected port.
The production server belongs to the project-app security group, while the ALB belongs to the project-lb security group.
In project-app, only requests on ports 80 and 443 from project-lb are allowed. Thus, the production server’s Tomcat needs to be accessible on port 80. To achieve this, we mapped port 8080 inside the Docker container to port 80 externally.
Health Check
The purpose of a load balancer is to ensure that requests are routed to functioning servers, even if some servers experience issues. To achieve this, the load balancer must verify whether a server is ready to handle requests. This process is known as a Health Check.
Health Checks operate on the simple principle that “if a specific API is working correctly, other APIs should also function properly.” In other words, if a predetermined API responds successfully, the server is assumed to be capable of handling requests. Spring Actuator, which we use to collect server metrics, also provides a Health Check API.
In typical scenarios, this API can be used directly. However, due to security group settings restricting ALB access to only ports 80 and 443 on the EC2 instance, we added a simple controller instead of using the default Actuator Health Check API.
@RestController
public class HealthApi {
@GetMapping("/health")
public ResponseEntity<ApiResponse<String>> health() {
return ResponseEntity.ok(new ApiResponse<>("up"));
}
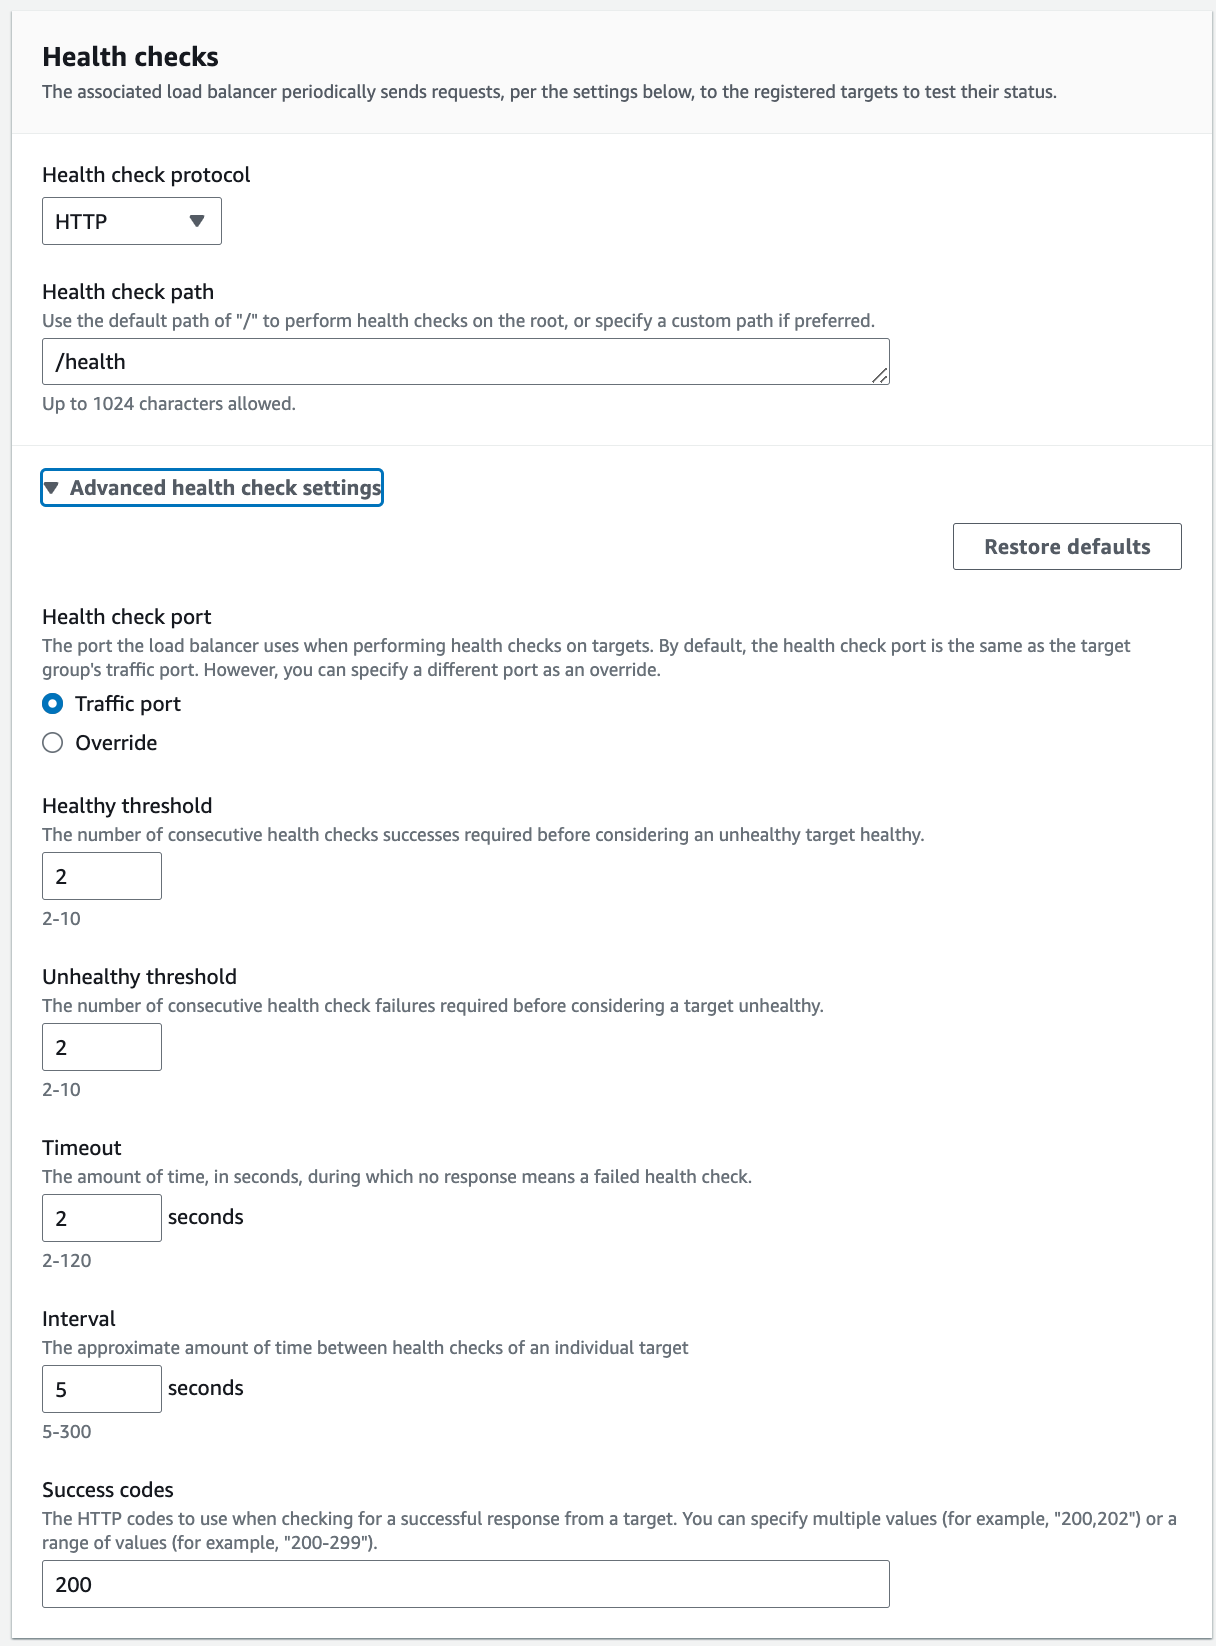
}The final Health Check settings applied are as follows:
Zero-Downtime Deployment
Comparison of Zero-Downtime Deployment Methods
There are three main types of zero-downtime deployment methods:
- Rolling
- Blue-Green
- Canary
The Rolling deployment method sequentially updates multiple servers to the next version. This approach may result in multiple versions being served simultaneously, so compatibility between versions requires extra attention. At any given time, the server resources in use (regardless of their availability for service) remain consistent.
The Blue-Green method designates a Blue group running the current version and a Green group with the new version, switching all traffic to Green in a single step. This ensures that only one version is live at a time. If an issue arises with Green, the Blue group remains live, allowing immediate rollback by redirecting traffic back to Blue. However, since only one group is used for active service, this method requires double the physical server resources.
The Canary method, categorized differently from the previous two, gradually shifts traffic to the new version while keeping both versions running simultaneously. This allows the new version to be validated and bugs identified, making it particularly suitable for A/B testing.
Both Blue-Green and Canary methods are complex to implement and require relatively more server resources. Additionally, since we do not plan to conduct supplementary tasks such as A/B testing, we determined that these methods would only add unnecessary complexity. Thus, we chose the Rolling deployment method.
Implementing Rolling Deployment
The Rolling deployment method sequentially updates multiple servers to the next version. It has two key characteristics:
- Two versions may be running concurrently.
- It requires no additional resources and is straightforward to implement.
Regardless of the deployment method, backward compatibility must be maintained, meaning the current version and the next version must at least be compatible. Therefore, having both versions live simultaneously was not considered a significant issue. Additionally, since our current budget utilization is already at 80%, deployment methods requiring extra resources were not feasible.
From this point forward, we will refer to the two EC2 instances in our infrastructure as Server A and Server B. Potential issues when implementing zero-downtime deployment with the Rolling method include:
- Deploying to Server A, but deploying to Server B before Server A is fully operational.
- Deploying to Server A, but encountering issues on Server A.
- Successful deployment to Server A, followed by deployment to Server B, which then experiences issues.
In scenario 1, we ensure that Server A is ready to handle requests before deploying to Server B. For scenario 2, Server B continues to run the stable previous version, allowing a quick rollback on Server A, with results sent to Slack for notification.
However, scenarios 3 and 4 cannot be resolved automatically since responses vary depending on the root cause. For example, if a disaster occurs in the availability zone where Server B operates, or if there’s a sporadic bug causing server downtime, the solutions will differ significantly. Therefore, we decided to focus on identifying the root cause for such cases and added an alert function to aid in this process.
The final deployment flow is as follows:
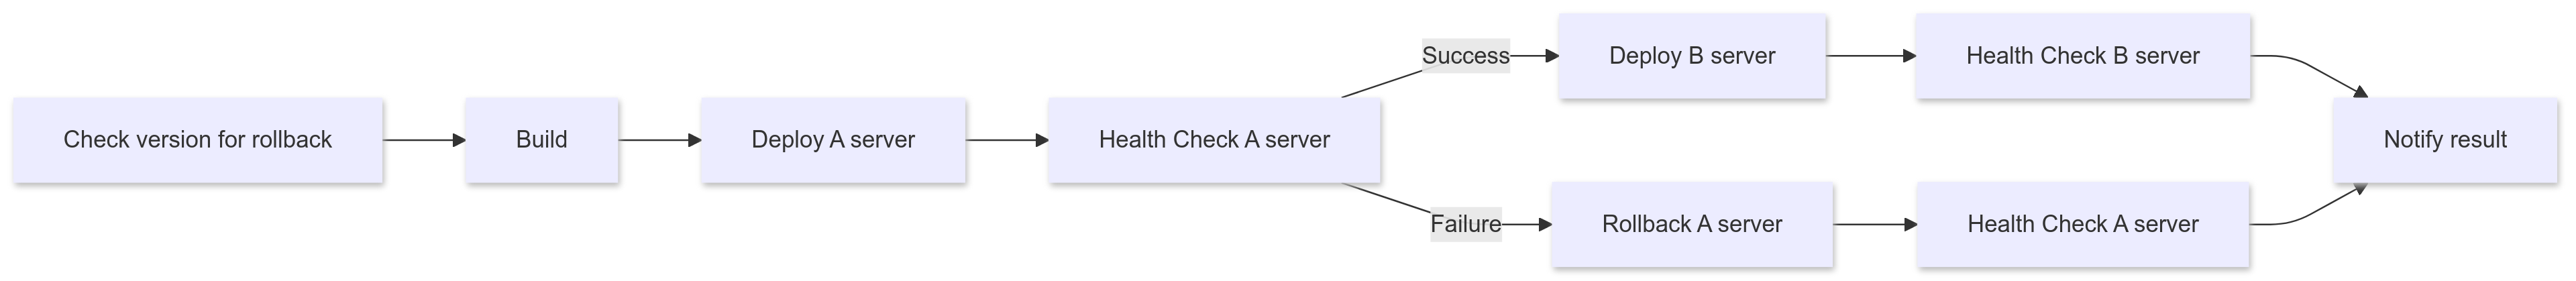
The GitHub Actions script implementing this process can be found here.
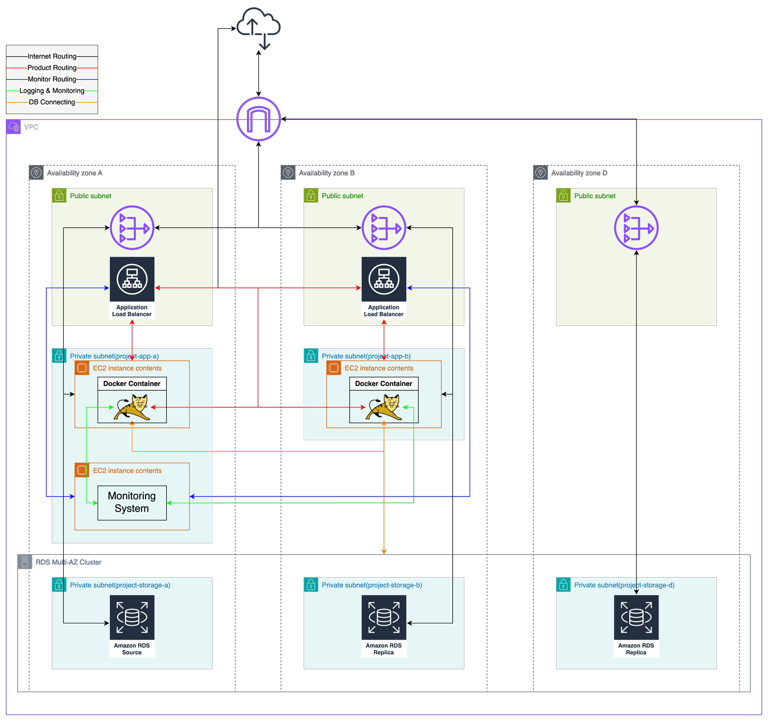
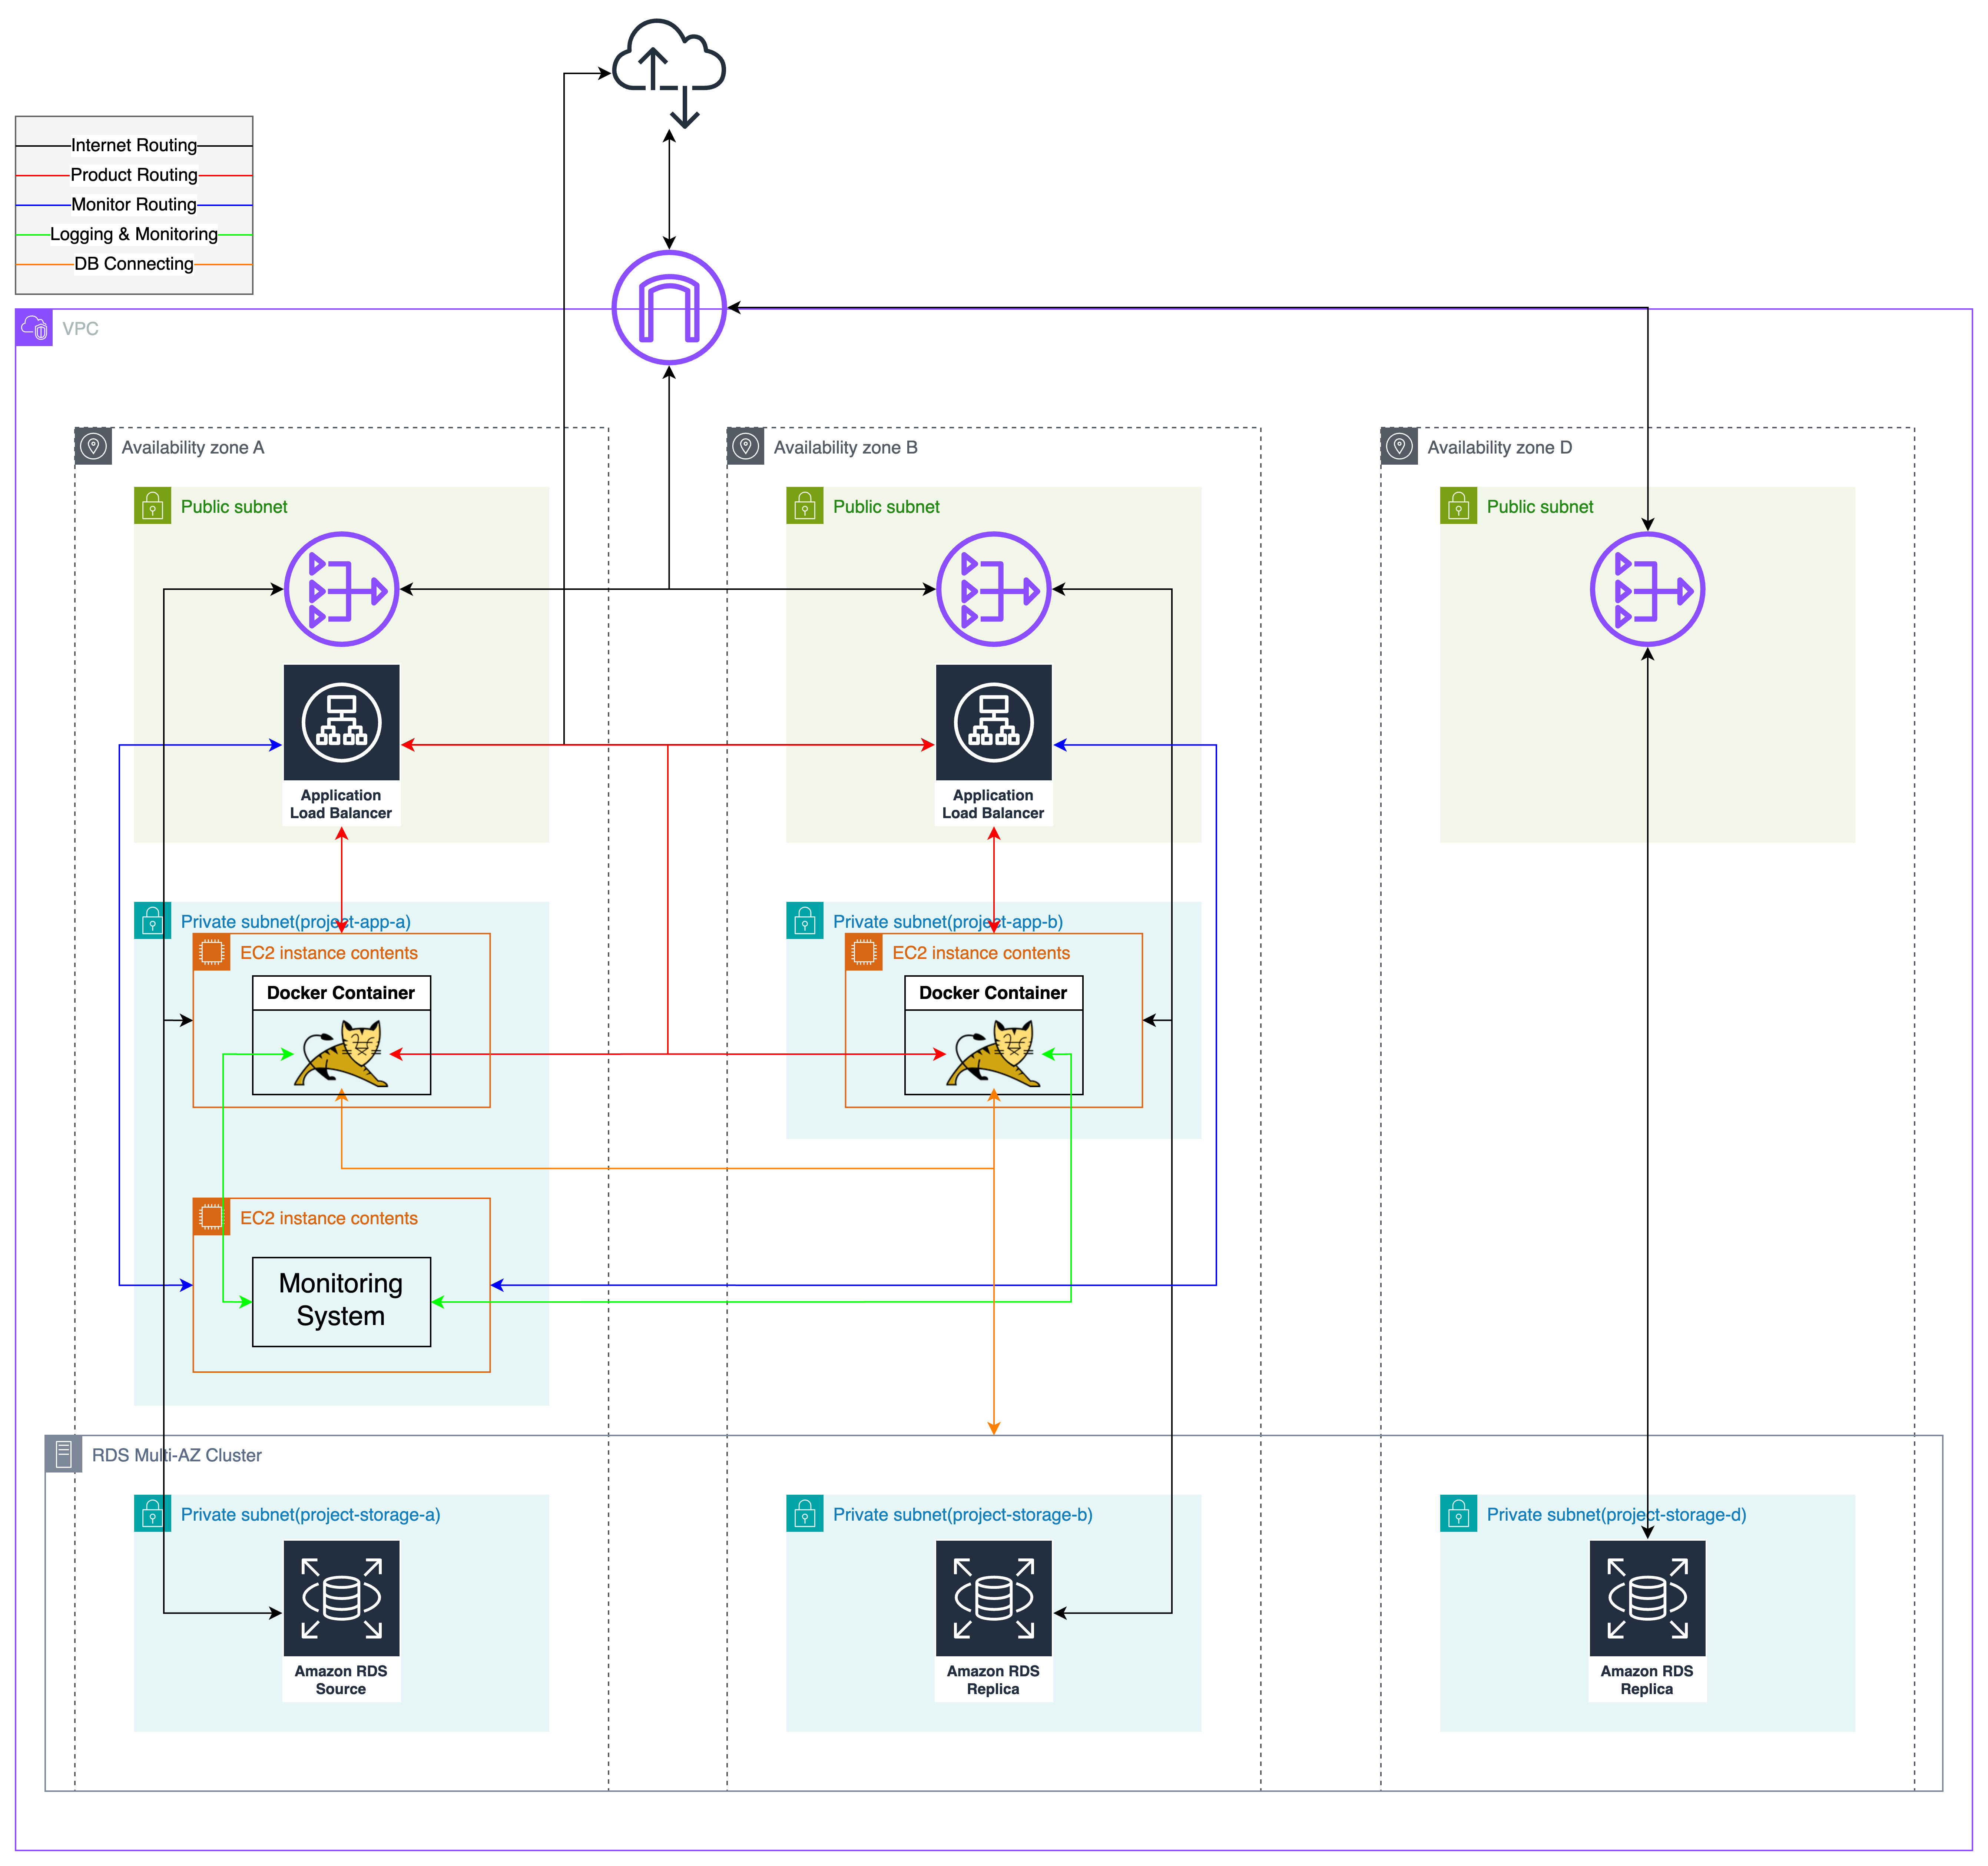
Monitoring & Logging System Integration
With the infrastructure expansion, the existing monitoring system needed to be updated to accommodate the new setup. The existing monitoring system is as follows:
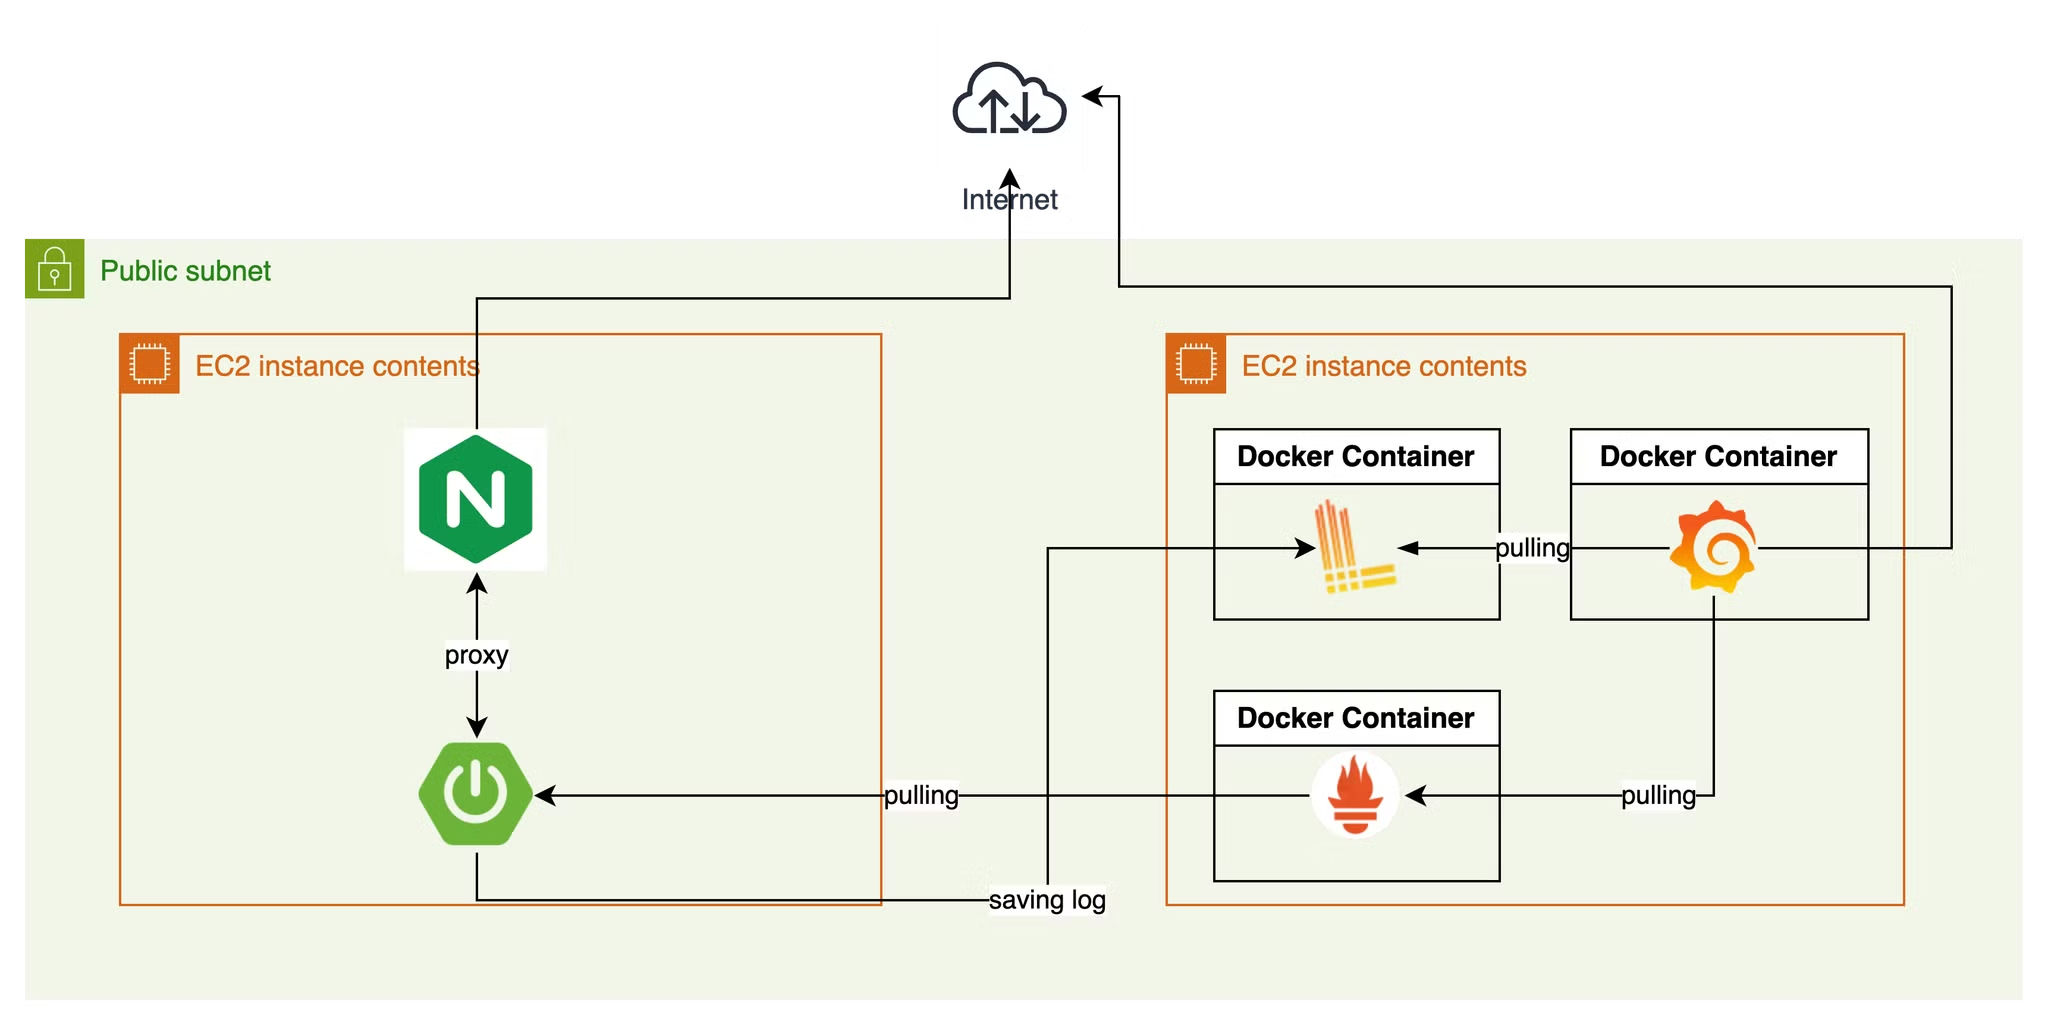
Prometheus can easily collect metrics from the new server by adding it as a target in the configuration file. Loki is already configured to store logs from Spring Boot using the predefined Appender settings, so no additional steps are required for log storage in Loki.
Distinguishing Logs from Multiple EC2 Instances
Since Prometheus is responsible for collecting metrics, it can easily differentiate between metrics from various instances. However, as logs are sent by Spring Boot, identifiers must be added within Spring Boot to distinguish logs from different EC2 instances.
<appender name="LOKI" class="com.github.loki4j.logback.Loki4jAppender">
    <http>
        <url>http://10.0.20.166:3100/loki/api/v1/push</url>
    </http>
    <format>
        <label>
            <pattern>
                app=${appName},host=${hostName},level=%level
            </pattern>
        </label>
        <message>
            <pattern>%d{yyyy-MM-dd HH:mm:ss.SSS} | %t | traceId=%X{traceId} | %highlight(%-5p) | %cyan(%logger{36}) | %m%n</pattern>
        </message>
        <sortByTime>true</sortByTime>
    </format>
</appender>
When configuring Loki4jAppender, you can use the label tag to add labels to logs. These labels allow specific logs to be filtered in Loki Query. In the configuration, app=${appName},host=${hostName},level=%level defines the labels. The text before the = represents the label's name, while the text after it represents the value.
In this code, values for labels are specified in ${} format, meaning they are injected from application.yml. To enable this injection, add the following code directly below the top <configuration> tag in the XML file.!
<springProperty scope="context" name="appName" source="spring.application.name"/>
<springProperty scope="context" name="hostName" source="logging.host"/>
The appName variable is sourced from spring.application.name, and hostName is sourced from logging.host.
When running the build file with the java -jar command, application settings in application.yml can be injected using the -D{property path}={value} option. For example, the -DLogging.host=${*HOSTNAME*} option injects the HOSTNAME environment variable set on the server into the logging.host property.
In DevelUp, we deploy using Docker. Therefore, we added the following command-line options in the Dockerfile:
FROM openjdk:21

ARG JAR_FILE=build/libs/*.jar
COPY ${JAR_FILE} app.jar

EXPOSE 8080

ENTRYPOINT ["java", "-Dspring.profiles.active=${SPRING_PROFILE}", "-DLogging.host=${HOSTNAME}", \
                "-jar", "/app.jar"]
In DevelUp, Docker Compose is used instead of Docker directly to simplify container execution. Therefore, we added the HOSTNAME environment variable in compose.yml. This value is injected from the server’s environment variable where the Docker Compose command is run, specifically from the GitHub Actions script environment.
services:
  application:
    image: ${BACKEND_APP_IMAGE_NAME}
    ports:
      - "80:8080"
      - "8082:8082"
    environment:
      TZ: "Asia/Seoul"
      SPRING_PROFILE: prod
      HOSTNAME: ${HOST_NAME}
    restart: always
    container_name: develup-app
The modified GitHub Actions script for setting the environment variable can be found on GitHub.
Collecting Nginx Logs on the Development Server
For the production server, HTTPS is handled by applying a certificate through the ALB. However, on the development server, HTTPS is managed directly through Nginx. Therefore, in addition to collecting Spring Boot logs, we also need to collect Nginx logs.
Unfortunately, unlike Spring Boot, Nginx cannot send logs with a straightforward configuration. To address this, we installed a separate log collector to send Nginx logs, stored on the server, to Loki. We chose Promtail, the official log collector for Loki.
To collect Nginx logs, three configurations are required:
- Setting the location for storing Nginx logs
- Configuring the log format for Nginx
- Setting up Promtail
Configuring the log storage location requires changes to both compose.dev.yml and Nginx configuration files.
volumes:
  **- /home/ubuntu/custom.conf:/etc/nginx/conf.d/default.conf
  - /home/ubuntu/nginx.conf:/etc/nginx/nginx.conf**
  - /etc/letsencrypt/live/{domain}/fullchain.pem:/etc/letsencrypt/live/{domain}/fullchain.pem
  - /etc/letsencrypt/live/{domain}/privkey.pem:/etc/letsencrypt/live/{domain}/privkey.pem
  **- /var/log/nginx:/var/log/nginx**
server {
listen 80;
listen [::]:80;
server_name {domain};
return 301 https://{domain}$request_uri;
}
server {
listen 443 ssl http2;
server_name {domain};
ssl_certificate /etc/letsencrypt/live/{domain}/fullchain.pem;
ssl_certificate_key /etc/letsencrypt/live/{domain}/privkey.pem;
location / {
proxy_pass http://develup-app:8080;
**proxy_set_header X-Request-ID $request_id;**
proxy_set_header Host $http_host;
proxy_set_header X-Real-IP $remote_addr;
proxy_set_header X-Forwarded-For $proxy_add_x_forwarded_for;
proxy_set_header X-Forwarded-Proto $scheme;
}
}user nginx;
worker_processes auto;
error_log /var/log/nginx/error.log notice;
pid /var/run/nginx.pid;
events {
worker_connections 1024;
}
http {
include /etc/nginx/mime.types;
default_type application/octet-stream;
**log_format main '$remote_addr - $remote_user [$time_local] "$request" '
'$status $body_bytes_sent "$http_referer" '
'"$http_user_agent" "$http_x_forwarded_for" "$request_id"';**
access_log /var/log/nginx/access.log main;
sendfile on;
#tcp_nopush on;
keepalive_timeout 65;
#gzip on;
include /etc/nginx/conf.d/*.conf;
}Nginx reads its configuration from nginx.conf, which imports additional configuration files. This hierarchical structure explains why the custom.conf configuration is applied. Due to this structure, log-related settings must be configured directly under the http component in nginx.conf.
Promtail can be configured using a .yml file, as shown below.
server:
  http_listen_port: 9080
  grpc_listen_port: 0

positions:
  filename: /tmp/positions.yaml

clients:
  - url: http://10.0.0.35:3100/loki/api/v1/push

scrape_configs:
  - job_name: nginx-logging
    static_configs:
      - targets:
          - localhost
        labels:
          **host: DEV_SERVER**
          job: nginx_log
          **__path__: /var/log/nginx/*.log**
          env: dev-nginx
To distinguish logs in Loki, we added a host: DEV_SERVER label. The log path has also been configured.