1. 공분산
a = np.random.randint(1, 100, size=20)
b = np.random.randint(5, 110, size=20)

np.cov(a,b)

# out
#
# array([[ 499.16842105, -214.73157895],
#        [-214.73157895,  924.34473684]])
출력 설명
[[Var(a), Cov(a,b)],
[Cov(a,b), Var(b)]]
2. 상관계수
a = np.random.randint(1, 100, size=20)
b = np.random.randint(5, 110, size=20)

np.corrcoef(a,b)

# out
# array([[ 1.        , -0.31612248],
#        [-0.31612248,  1.        ]])
출력 설명
[[corr(a,a), corr(a,b)],
[corr(a,b), corr(a,b)]]
-31% 정도의 음의상관관계가 있다고 볼 수 있다.
3. 계수 구하기
p = [[1, 2, 3],
    [2, 3, 1],
    [5, 6, 4]]

print("P의 랭크 : {}".format(np.linalg.matrix_rank(p)))

# out
# P의 랭크 : 3
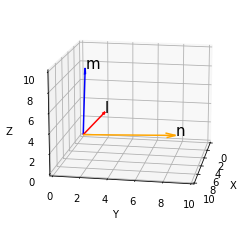
4. 3D 그래프
from mpl_toolkits.mplot3d import Axes3D

l = [1, 2, 3]
m = [-1, 0, 7]
n = [4, 8, 2]

# 3차원 표 그리기
fig = plt.figure()
ax = fig.add_subplot(1, 1, 1, projection = '3d')

# l 벡터 라인, 텍스트
ax.quiver(0, 0, 0, l[0], l[1], l[2], color ='red', arrow_length_ratio=0.1)
ax.text(l[0], l[1], l[2], 'l', size = 15)

# m 벡터 라인, 텍스트
ax.quiver(0, 0, 0, m[0], m[1], m[2], color ='blue', arrow_length_ratio=0.1)
ax.text(m[0], m[1], m[2], 'm', size = 15)

# n 벡터 라인, 텍스트
ax.quiver(0, 0, 0, n[0], n[1], n[2], color ='orange', arrow_length_ratio=0.1)
ax.text(n[0], n[1], n[2], 'n', size = 15)

# X,Y,Z 크기 설정
ax.set_xlim(0, 10)
ax.set_ylim(0, 10)
ax.set_zlim(0, 10)

# 축 라벨
ax.set_xlabel('X')
ax.set_ylabel('Y')
ax.set_zlabel('Z')

# 볼 각도 설정
ax.view_init(elev=15, azim=10)
# 격자 출력
ax.grid()

plt.show()
out:


