
PCA
import seaborn as sns
import pandas as pd

# 데이터 셋 불러오기
df = sns.load_dataset('penguins')

# 결측치 확인
df.isna().sum()

# out
# species               0
# island                0
# bill_length_mm        2
# bill_depth_mm         2
# flipper_length_mm     2
# body_mass_g           2
# sex                  11
# dtype: int64

# 결측치 제거
df.dropna(inplace=True)
df.isna().sum()


# out
# species              0
# island               0
# bill_length_mm       0
# bill_depth_mm        0
# flipper_length_mm    0
# body_mass_g          0
# sex                  0
# dtype: int64

# 숫자형 데이터만 df2에 복사
df2 = df.loc[:, "bill_length_mm" : "body_mass_g"].copy()
from sklearn.preprocessing import StandardScaler, Normalizer from sklearn.decomposition import PCA scaler = StandardScaler() # 정규화 X = scaler.fit_transform(df2) # PCA pca = PCA(2) pca.fit(X) Z = pca.transform(X) # 분산 비율 저장 ratio = pca.explained_variance_ratio_ print(Z[:3]) print(ratio) # out # pca # [[-1.85359302 0.03206938] # [-1.31625406 -0.44352677] # [-1.37660509 -0.16123048]] # explained_variance_ratio # [0.68633893 0.19452929]그래프 데이터 프레임 만들기
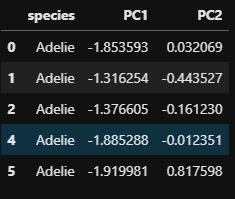
# 그래프 그릴 데이터프레임 만들기
df_plot = pd.DataFrame({'species' : df.species,
                       'PC1' : Z[:,0],
                       'PC2' : Z[:,1]})
df_plot.head()
out
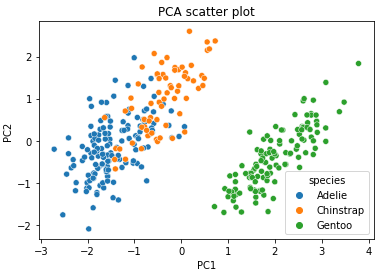
scatter plot 만들기
# 종 별로 나눈 PC1, PC2 값 출력
sns.scatterplot(data=df_plot, x='PC1', y='PC2', hue='species');
out

조금씩 천천히