
1. Pandas란
행과 열로 구성된 2차원 데이터 객체를 다루는 데이터 분석 라이브러리로, 대용량의 데이터들을 처리하는데 매우 편리한 도구이다.
Numpy를 기반으로 작성되지만 훨씬 더 유연하고 편리하게 데이터 핸들링을 할 수 있다.
또한 저수준 API를 제공하는 Numpy와 달리 Pandas는 고수준 API를 제공한다.
2. import pandas
Pandas를 사용하기위해 모듈을 import 해야하며 이 때 간결성을 위해 pd라는 축약된 이름으로 사용하는 것이 관례이다.
import pandas as pd3. Series
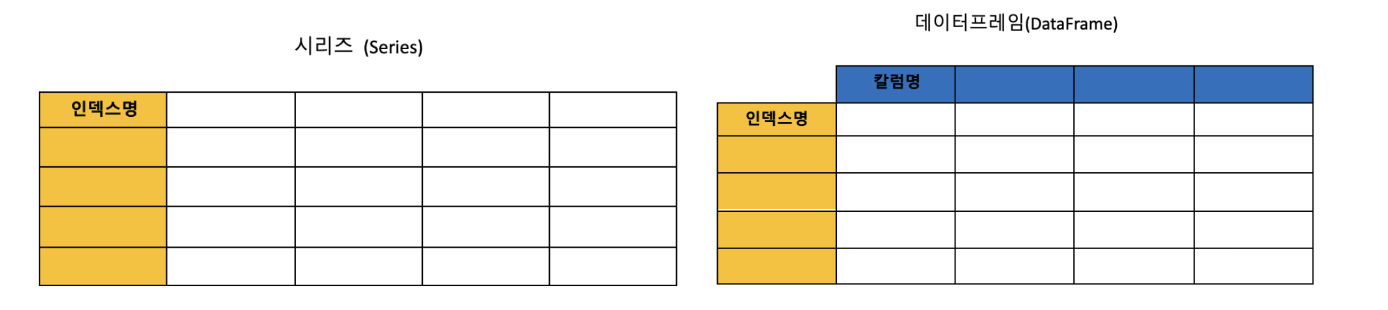
(1) Series : 1차원 배열의 형태를 가지며 인덱스라는 한 가지 기준(행)에 의해 데이터가 저장된다.
import pandas as pd
sr = pd.Series([1,2,-1,-2])
print(sr)
out[]:
0 1
1 2
2 -1
3 -2
dtype: int64
(2) Series에 있는 자료 확인하기
import pandas as pd
sr = pd.Series([1,2,-1,-2])

sr.values
sr.index
sr.dtype
out[]:
array([ 1, 2, -1, -2])
RangeIndex(start=0, stop=4, step=1)
dtype('int64')
(3) index 변경하기
Series의 index 이름은 원하는 숫자나 문자로 지정 및 변경할 수 있다.
import pandas as pd
sr = pd.Series([1,2,-1,-2], index = ['a', 'b', 'c', 'd'])
print(sr)
out[]:
a 1
b 2
c -1
d -2
dtype: int64
import pandas as pd
sr.index = ['f','i','h','k']
print(sr)
out[]:
f 1
i 2
h -1
k -2
dtype: int64
(4) index 대표 이름 설정
sr.index.name = 'sr_name'out[]:
sr_name
f 1
i 2
h -1
k -2
dtype: int64
(5) dictionary 자료형을 Series로 변경하기
dictionary 자료형을 Series로 정의한다.
dic = {'d': 22, 'a': 23, 'y': 24, 'th': 25, 'on' : 26}
sr = pd.Series(dic)
print(sr)
out[]:
d 22
a 23
y 24
th 25
on 26
dtype: int64
4. Dataframe
1. DataFrame 생성
(1) DataFrame: 2차원 배열의 형태를 가지며 인덱스와 칼럼이라는 두 가지 기준(행, 열)에 의해 표 형태로 데이터가 저장된다.
DataFrame을 생성하는 방법은 두 가지이다.
- numpy array 이용
np.array()로 리스트 자료구조를 nparray로 바꾼 후 pd.DataFrame(nparray, index, columns)로 생성한다
import pandas as pd
list1 = [[1, 2, 3], [11, 12, 13]]
array1 = np.array(list1)
df1 = pd.DataFrame(array1, index=['a', 'b'], columns=list('ABC'))
#df1 = pd.DataFrame(array1, index=['a', 'b'], columns=['A', 'B', 'C'])

print(df1)
out[]:
A B C
a 1 2 3
b 11 12 13
- dictionary 이용
Dictionary 자료형 데이터를 pd.Dataframe(dictionary)로 생성한다.
이 때는 column 명(열)만 명시할 수 있고 index 명(행)은 따로 명시할 수 없다.
import pandas as pd
dic2 = {'A':[1, 11], 'B':[2, 22], 'C':[3, 33]}
df_dic = pd.DataFrame(dic2)
print(df_dic)
out[]:
A B C
0 1 2 3
1 11 22 33
(2) 파일을 불러 DataFrame 생성하기
pd.read_csv() API를 사용하여 csv, tsv 등 필드 구분 문자 기반의 파일 포맷도 DataFrame으로 변환할 수 있다. 디폴트 필드 구분 문자는 콤마(csv파일)이다.
- pd.read_csv(파일경로/파일명, sep=‘ 필드 구분 문자 ’)
import pandas as pd
data = pd.read_csv('/content/한국환경공단_도로 재비산먼지 측정 정보_20231031.csv', encoding = 'CP949')
2. DataFrame 데이터 확인
(1) 데이터 출력
- .head(): 상위 5개의 자료 출력
- .tail(): 하위 5개의 자료 출력
- 출력하길 원하는 양을 괄호 안에 숫자로 지정할 수도 있다.
data.head()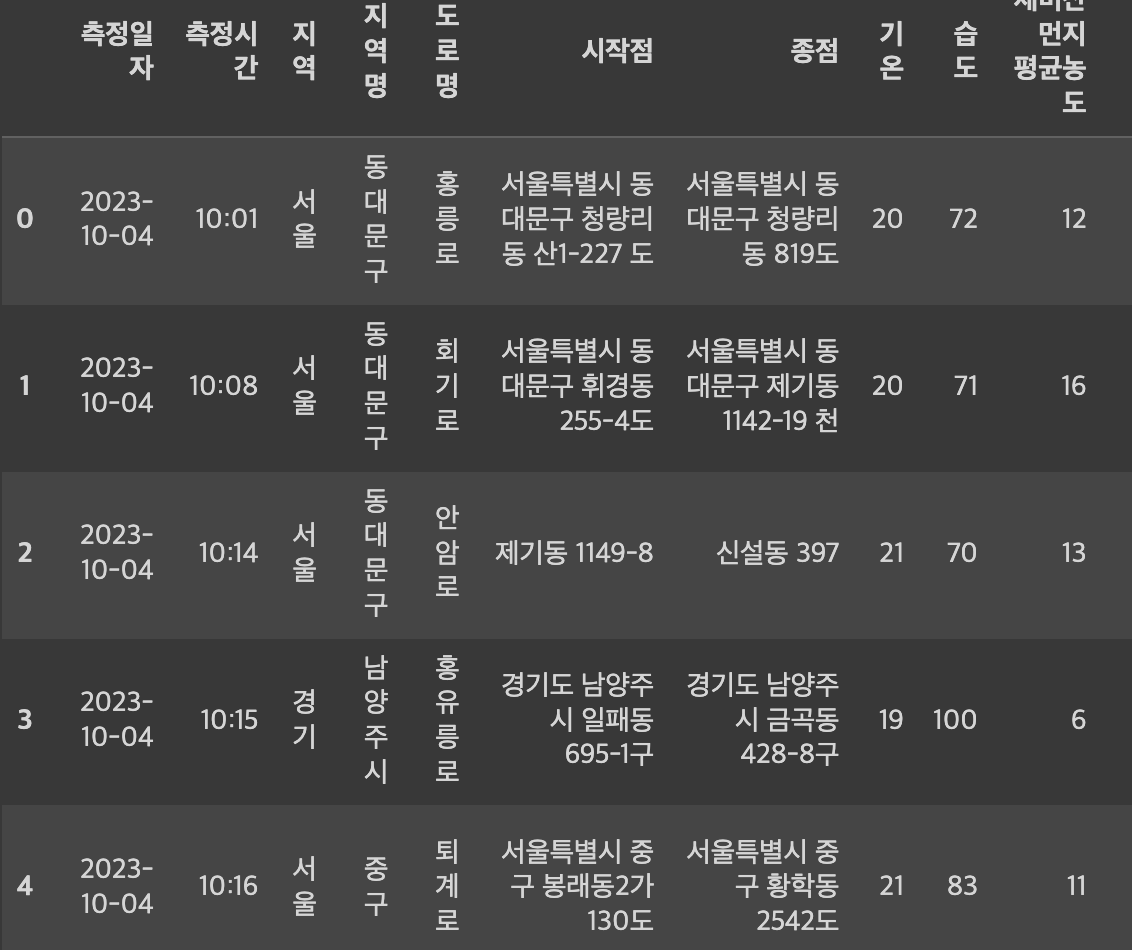
data.tail()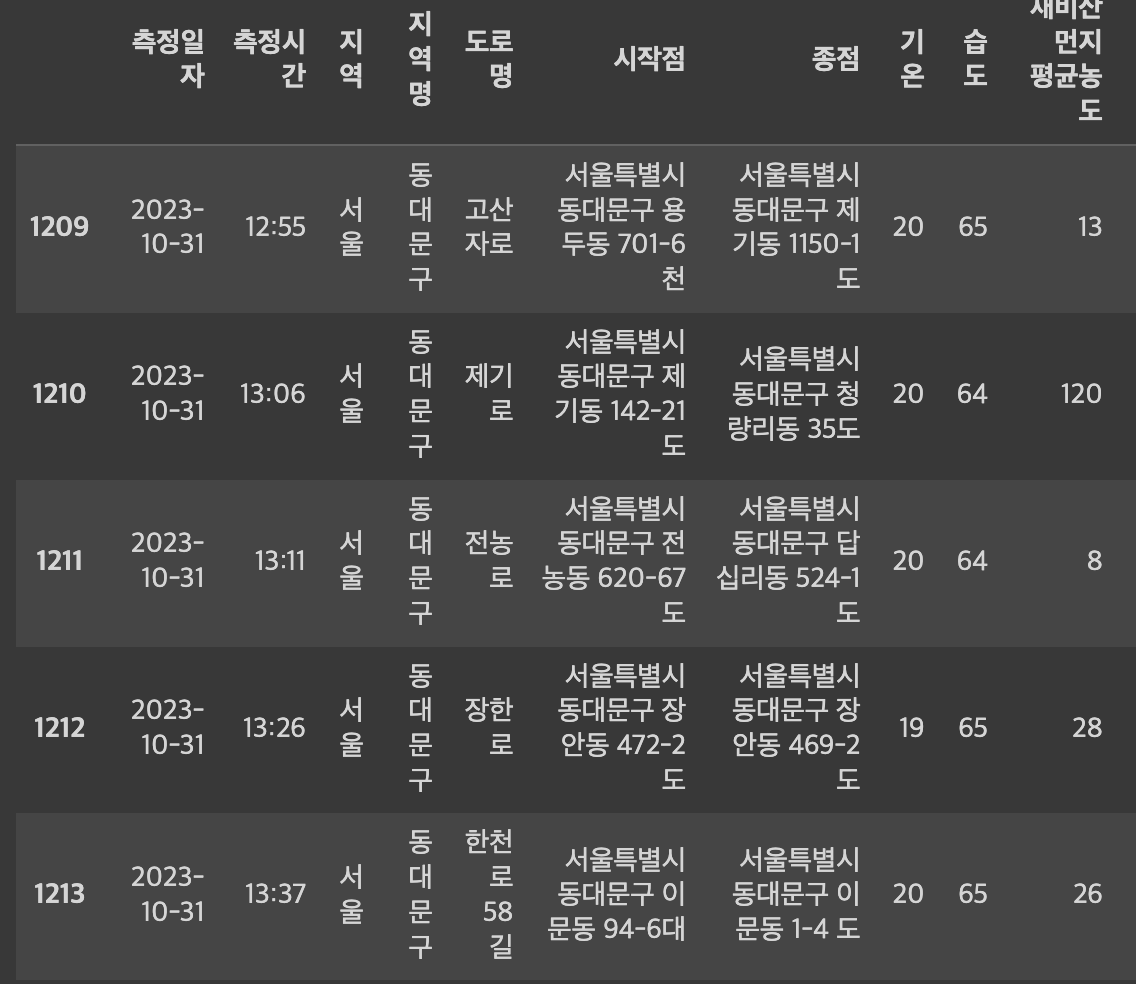
(2) 행과 열만 출력하기
- .index() : 행(index)출력
- .columns() : 열(columns)출력
print(data.index)
print(data.columns)
out[]:
RangeIndex(start=0, stop=1214, step=1)
out[]:
Index(['측정일자', '측정시간', '지역', '지역명', '도로명', '시작점', '종점', '기온', '습도','재비산먼지 평균농도', '오염범례'], dtype='object')
(3) 데이터 값 출력하기
- values : 자료의 모든 데이터 값을 array 형태로 출력
data.valuesout[]:
array([['2023-10-04', '10:01', '서울', ..., 72, 12, '매우좋음'],
['2023-10-04', '10:08', '서울', ..., 71, 16, '매우좋음'],
['2023-10-04', '10:14', '서울', ..., 70, 13, '매우좋음'],
...,
['2023-10-31', '13:11', '서울', ..., 64, 8, '매우좋음'],
['2023-10-31', '13:26', '서울', ..., 65, 28, '매우좋음'],
['2023-10-31', '13:37', '서울', ..., 65, 26, '매우좋음']], dtype=object)
(4) 데이터 특징 확인하기
- [칼럼명].unique() : 해당 칼럼에 할당한 데이터의 고유한 값의 종류를 파악
- [칼럼명].nunique() : 해당 칼럼에 할당된 데이터의 고유한 값의 수를 파악
- .value_counts() : 특정 칼럼 값의 유형과 데이터 값의 건수 반환
- .describe() : 컬럼 별로 간단한 통계적 요약을 제공
data['오염범례'].unique()out[]:
array(['매우좋음', '보통', '나쁨', '좋음', '매우나쁨'], dtype=object)
data['오염범례'].nunique()out[]: 5
data['오염범례'].value_counts()out[]:
매우좋음 1129
좋음 48
보통 18
나쁨 11
매우나쁨 8
Name: 오염범례, dtype: int64
data.describe()out[]:
기온 습도 재비산먼지 평균농도count 1214.000000 1214.000000 1214.000000
mean 19.556837 61.199341 19.863262
std 2.528254 18.515824 41.504053
min 12.000000 31.000000 1.000000
25% 18.000000 46.000000 5.000000
50% 20.000000 59.000000 10.000000
75% 21.000000 72.000000 19.000000
max 35.000000 100.000000 830.000000
data['오염범례'].describe()out[]:
count 1214 이 열에 있는 전체 데이터 수
unique 5 고유한 값의 갯수
top 매우좋음 이 열에서 가장 자주 등장하는 값
freq 1129 top값의 빈도수
Name: 오염범례, dtype: object
3. DataFrame 데이터 정렬
(1) sort_values()
- 데이터 값을 기준으로 행과 열을 정렬한다.
- 디폴트 값은 인덱스를 기준으로 오름차순 정렬이다.
- NaN(결측값)이 있다면 그 값은 맨 마지막에 위치한다.
list1 = [[11, 12, 3], [1, 2, 13]]
array1 = np.array(list1)
df1 = pd.DataFrame(array1, index=['b', 'a'], columns=['A', 'B', 'C'])
print(df1)
out[]:
A B C
b 11 12 3
a 1 2 13
print(df1['A'].sort_values())out[]:
a 1
b 11
Name: A, dtype: int64
(2) sort_values() 파라미터
- by : 정렬 기준으로 삼는 특정 column의 이름 또는 열의 리스트
- ascending : 정렬 방향 (True: 오름차순, False: 내림차순)
- axis :
- inplace : 기본값은 False로 정렬 후 새로운 데이터프레임을 반환한다. True로 설정하면 원래 데이터프레임이 정렬되도록 변경된다.
print(df1.sort_values(by = ['A']))out[]:
A B C
a 1 2 13
b 11 12 3
(3) sort_index()
- 인덱스 값을 기준으로 행과 열을 정렬한다
- 디폴트 값은 인덱스를 기준으로 오름차순 정렬이다.
df1 데이터프레임은 다음과 같다.
list1 = [[11, 12, 3], [1, 2, 13]]
array1 = np.array(list1)
df1 = pd.DataFrame(array1, index=['2', '1'], columns=['A', 'B', 'C'])
print(df1)
out[]:
A B C
2 11 12 3
1 1 2 13
df1 데이터프레임의 index는 [2,1]이기에 sort_index() 함수를 통해 정렬해주면 [1,2]가 된다.
df1.sort_index()out[]:
A B C
1 1 2 13
2 11 12 3
(4) sort_index()의 파라미터
- ascending: 정렬의 방향(True: 오름차순, False: 내림차순)
data.sort_index(ascending = False)out[]:
A B C
2 11 12 3
1 1 2 13
4. DataFrame 데이터 선택
- 슬라이싱
data['기온']out[]:
0 20
1 20
2 21
3 19
4 21
..
1209 20
1210 20
1211 20
1212 19
1213 20
Name: 기온, Length: 1214, dtype: int64
data[11]out[]:
측정일자 2023-10-04
측정시간 10:38
지역 경기
지역명 남양주시
도로명 양지로
시작점 경기도 남양주시 오남읍 오남리 468-6 도
종점 경기도 남양주시 오남읍 양지리 749-5 답
기온 20
습도 100
재비산먼지 평균농도 6
오염범례 매우좋음
Name: 11, dtype: object
- .loc[행, 열] : 라벨 이름을 이용하여 데이터 선택 (명칭 기반)
data.loc[11, '기온']
out[]: 20
- .iloc[인덱스 번호] : 인덱스 번호를 이용하여 데이터 선택 (위치 기반)
주의해야 할 점: 위치 기반은 첫 번째 순서를 0으로 취급한다.
data.iloc[11,7]out[]: 20
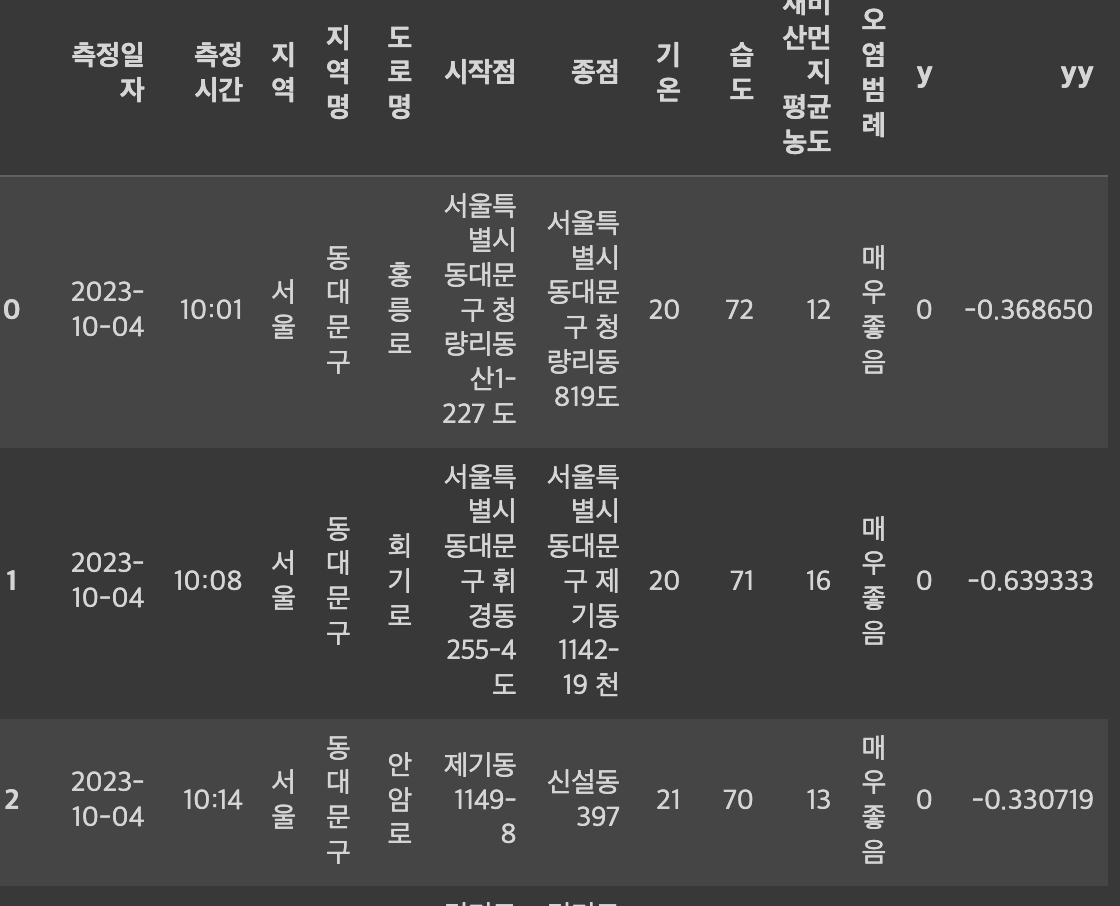
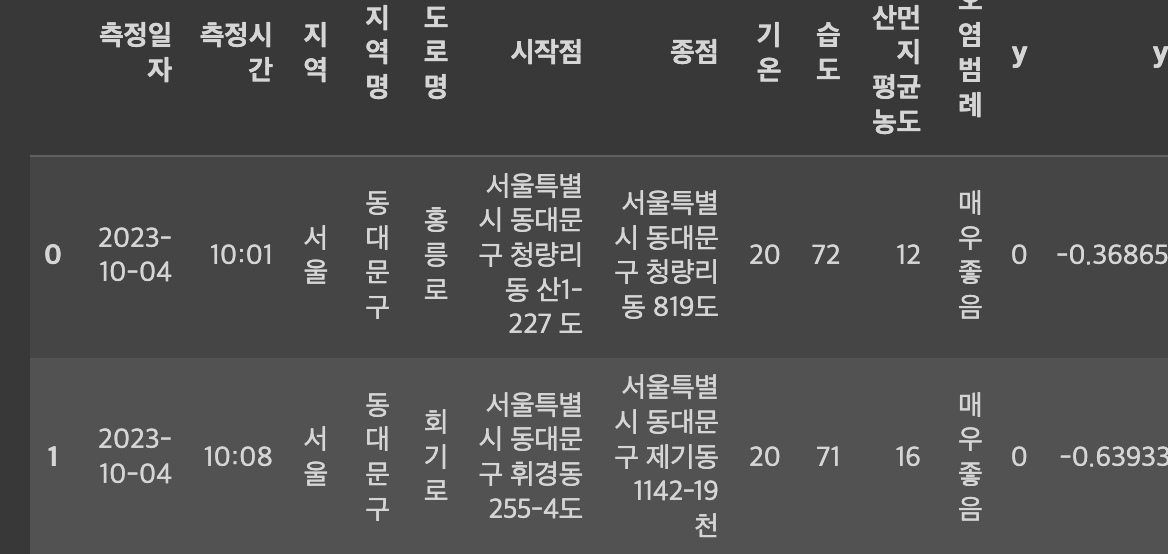
5. DataFrame 데이터 생성
기존에 존재하던 데이터프레임을 새로운 변수에 할당하여 생성한다. 또한 새로운 칼럼을 생성할 수 있고 이 때 np.random.randn()함수를 사용하여 난수로 생성된 칼럼을 추가할 수 있다.
data_df['y'] = 0
df1 =  pd.DataFrame(np.random.randn(1214,1))
data_df['yy'] = df1
print(data_df)
out[]:
6. DataFrame 데이터 변경
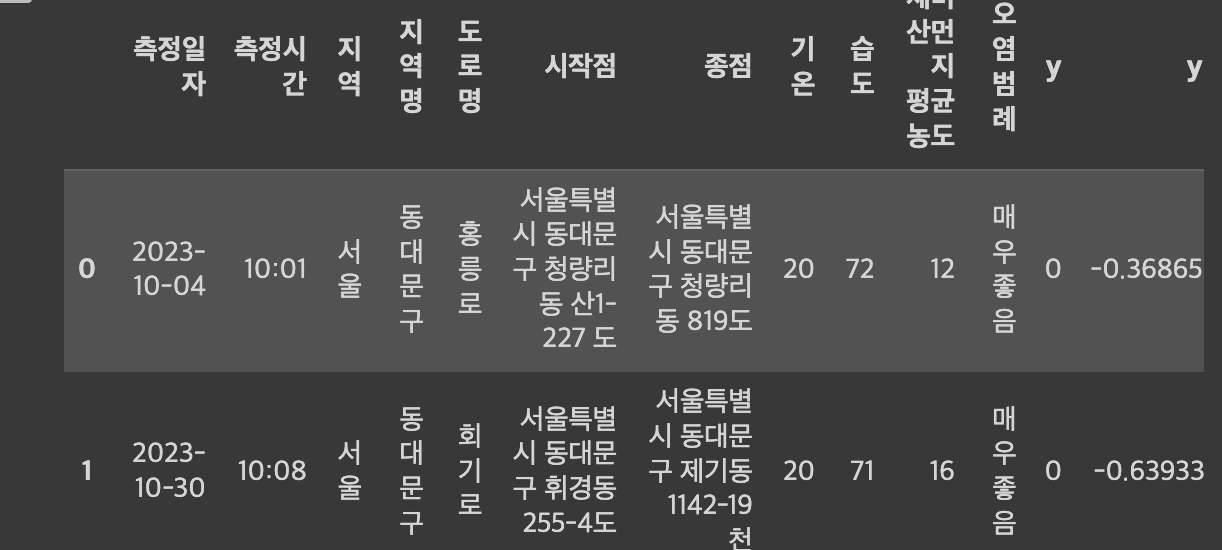
(1) 위치 변경
- .at[index, column]: 값 : 라벨의 이름을 이용하여 원하는 위치의 값을 변경
print(data[0:2])
out[]:
data.at[1, '측정일자'] = '2023-10-30'
print(data[0:2])
out[]:
- .iat[index] : 인덱스 번호를 이용하여 원하는 위치의 값을 변경
주의해야 할 점: iloc[]와 마찬가지로 위치 기반은 첫 번째 순서를 0으로 취급한다.
data.iat[3,6]
out[]: 경기도 남양주시 금곡동 428-8구
data.iat[3,6] = 0
print(data.iat[3,6]
out[]: 0
(2) 행과 열 교환
- .T: Transpose index and columns의 약자로, index(행)과 column(열)을 전치시킨다.
list1 = [[1, 2, 3], [11, 12, 13]]
array = np.array(list1)
df2 = pd.DataFrame(array, index=['a','b'], columns = list('ABC'))
print(df2)
out[]:
A B Ca 1 2 3
b 11 12 13
print(df2.T)out[]:
a bA 1 11
B 2 12
C 3 13
7. DataFrame 데이터 결합
(1) concat
concat()은 두 개 이상의 DataFrame을 결합할 때 사용한다.
- pd.concat([DataFrame1, DataFrame2])
- axis : 0(열) 디폴트, 1(행)
df11 = pd.DataFrame([1,2,3,4,5])
df22 = pd.DataFrame([6,7,8,9,10])
print(pd.concat([df11, df22]))
out[]:
0
0 1
1 2
2 3
3 4
4 5
0 6
1 7
2 8
3 9
4 10
df11 = pd.DataFrame([1,2,3,4,5])
df22 = pd.DataFrame([6,7,8,9,10])
print(pd.concat([df11, df22], axis = 1))
out[]:
0 0
0 1 6
1 2 7
2 3 8
3 4 9
4 5 10
concat()은 column, index를 기준으로 병합하는데 이 때 공통된 column혹은 index가 없다면 NaN을 포함하여 결합한다.
다음 코드에서 df11의 인덱스는 [1,2,3]이며 [4,5,6]은 존재하지 않는다.
df22의 인덱스는 [4,5,6]이며 [1,2,3]이 존재하지 않는다.
두 개의 DataFrame을 concat()함수를 사용하여 결합한다면 다음과 같은 결과가 나오게 된다.
df11 = pd.DataFrame({'A' : ['a', 'a', 'a'], 'B' : ['b', 'b', 'b']}, index = [1,2,3])
df22 = pd.DataFrame({'C' : ['c', 'c', 'c'], 'D' : ['d', 'd', 'd']}, index = [4,5,6])
print(pd.concat([df11, df22]))
out[]:
A B C D
1 a b NaN NaN
2 a b NaN NaN
3 a b NaN NaN
4 NaN NaN c d
5 NaN NaN c d
6 NaN NaN c d
(2) append
append()는 concat과 달리 행으로 결합이 가능하며 열로 결합이 불가능하다.
- DataFrame1.append(DataFrame2)
df11 = pd.DataFrame({'A' : ['a', 'a', 'a'], 'B' : ['b', 'b', 'b']}, index = [1,2,3])
df22 = pd.DataFrame({'C' : ['c', 'c', 'c'], 'D' : ['d', 'd', 'd']}, index = [4,5,6])
print(df11.append(df22))
out[]:
A B C D
1 a b NaN NaN
2 a b NaN NaN
3 a b NaN NaN
4 NaN NaN c d
5 NaN NaN c d
6 NaN NaN c d