모니터링 시스템 구축 with Grafana, Prometheus, Node Exporter, Postgres Exporter, Nginx Exporter, Django Exporter
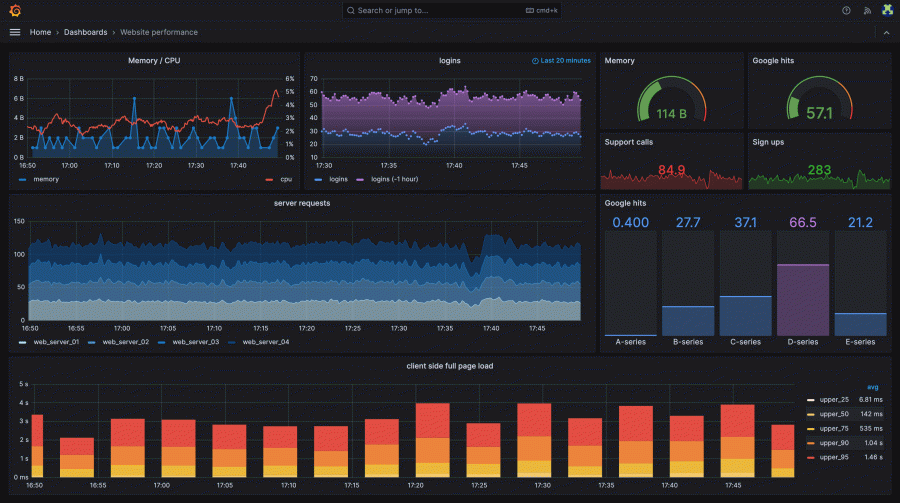
아래에서 부터 위로 보셔야 합니다.(죄송)
출처 : django-prometheus
출처 : Django Monitoring with Prometheus and Grafana
- is not valid in regex, use .* instead.
출처 : error parsing regexp: missing argument to repetition operator: * #330
그럼 nginx의 설정을 이용하여 stub_status를 활성화 시켜보자. 최대한 nginx.conf를 수정하지 않기 위해 /conf.d에 metrics.conf를 생성하여 아래와 같이 작성하였다.
server {
  listen 80;
  server_name localhost;
  location /metrics {
    stub_status on; # stub_status 활성화
    allow all; # allow 접근을 허용할 주소 설정
    # deny 접근을 허용하지 않을 주소 설정
  }
}
위와 같이 설정을 하고 Nginx를 재시작하면 http://localhost/metrics로 접근할 수 있으며 curl을 이용해 요청을 해보면 아래와 같이 응답이 오는 것을 확인할 수 있다.
$ curl localhost/metrics
# Result
Active connections: 2
server accepts  handled requests
39      39      366
Reading: 0 Writing: 1 Waiting: 1
prometheus-nginxlog-exporter의 역할은 쉽게 말해 Nginx에서 노출시킨 메트릭 정보를 Prometheus가 수집할 수 있도록 하는 역할을 한다.
# 설치 기준 v0.11.0
wget https://github.com/nginxinc/nginx-prometheus-exporter/releases/download/v0.11.0/nginx-prometheus-exporter_0.11.0_linux_386.tar.gz
tar -xvf nginx-prometheus-exporter_0.11.0_linux_386.tar.gz
# Result
exporter/
|-- CHANGELOG.md
|-- LICENSE
|-- README.md
`-- nginx-prometheus-exporter
압축을 해제하면 nginx-prometheus-exporter 실행파일이 생긴다. 해당 파일을 실행할 때 중요한 옵션이 2가지가 있다. (추가 적인 내용은 nginx-prometheus-exporter --help를 입력하면 확인할 수 있다.)
-nginx.scrape-uri: nginx의 메트릭 정보를 가져올 주소를 지정할 수 있다. 위에서 설정한 대로 http://localhost/metrics를 지정하면 된다.
-web.listen-address: nginx-prometheus-exporter를 외부로 노출시킬 주소를 지정할 수 있다. default는 :9113이다.
아래 명령어로 nginx를 띄워주지 않으면 Prometheus 에서는 Stat up 상태로 인식 하지만, Grafana에서는 Stat Down 상태로 인식한다.(이유는 좀 더 찾아 봐야.....)
nohup ./nginx-prometheus-exporter -nginx.scrape-uri http://localhost/metrics &출처 : 웹 서버 모니링하기 (1) nginx-prometheus-exporter
I met the same problem. And I try to fix it by replacing the sepecial characters with its %+ascii format. Because special characters in url (eg: postgresql://user:passwd@localhost:5432/postgres?sslmode=disable) mean specially and can not directly be parsed, eg:
! -> %21 , # -> %23
Prometheus
http://localhost:9090
Grafana
http://localhost:3000
기본 계정 ID/PW: admin/admin
출처 : Prometheus + Grafana + Docker Compose 설치
출처 : docker 를 이용한 gafana, promethous 사용법 (docker compose)
tar xvfz node_exporter-1.7.0.linux-amd64.tar.gz
출처 : [Infra] 서버 모니터링 구축기 [Docker, Prometheus, Grafana]
출처 : [과제] prometheus와 grafana를 이용한 MySQL 모니터링 구축
wget https://github.com/prometheus/node_exporter/releases/download/v1.7.0/node_exporter-1.7.0.linux-amd64.tar.gz
wget https://github.com/prometheus-community/postgres_exporter/releases/download/v0.15.0/postgres_exporter-0.15.0.linux-amd64.tar.gz
export DATA_SOURCE_NAME='postgresql://postgres:enter_password_here@postgres_hostname:5432/postgres?sslmode=disable'
./postgres_exporter
INFO[0000] Starting Server: :9187                        source="postgres_exporter.go:1850"
