보안그룹은 '모니터링 EC2'에서 'Spring 서버 EC2'의 9292포트를 볼 수 있도록 설정되어 있다.
Spring 서버 EC2		 모니터링 EC2
9292 포트 	-> | 9090포트   <-  3000포트 	|
				 프로메테우스		그라파나
				내부적(localhost)으로 사용
프로메테우스
파일 설치
다운로드 주소로 이동해서 리눅스에 해당하는 다운로드 링크 주소를 복사해주자.
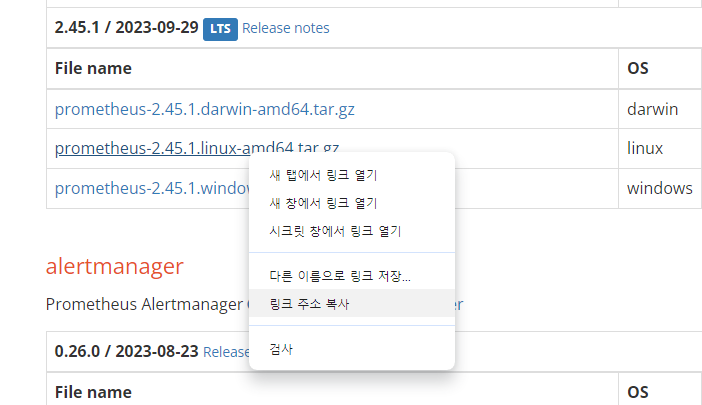
-- 다운로드
wget https://github.com/prometheus/prometheus/releases/download/v2.45.1/prometheus-2.45.1.linux-amd64.tar.gz

-- 압축해제
tar xzvf prometheus-2.45.1.linux-amd64.tar.gz
설정
yml 설정하기
-- 압축을 푼 폴더로 이동
cd prometheus-2.45.1.linux-amd64/

-- 해당 파일 수정
vim prometheus.ymlprometheus.yml의 마지막 줄에 다음 설정 코드를 환경에 따라 설정해서 붙혀넣어주자.
#### 데이터를 가져올 ec2 ####
  - job_name: "아무거나 적절한 이름 적으면 된다." # 그냥 job name 아무거나
    metrics_path: '/my-monitor/prometheus' # 데이터 가져올 경로. 우리는 spring에서 /my-monitor로 설정을 했다.
    scrape_interval: 15s # 15s 마다 데이터를 가져옴
    static_configs:
      - targets: ['IP-OR-도메인:9292'] # 이 경로에서 수집
###############################
서비스 등록하기
-- 1. 아까 압축을 푼 폴더로 이동
cd prometheus-2.45.1.linux-amd64/

-- 2. etc에 프로메테우스 폴더를 만들고 해당 폴더로 다운로드 받은 파일들 이동
sudo mkdir -p /etc/prometheus
sudo mv prometheus console_libraries prometheus.yml consoles /etc/prometheus

-- 3. prometheus의 유저 및 그룹을 시스템에 생성
sudo groupadd --system prometheus
sudo useradd --system -s /usr/sbin/nologin -g prometheus prometheus

-- 4. 2에서 생성한 폴더와 이동한 파일의 소유권을 prometheus의 소유로 변경
sudo chown prometheus:prometheus /etc/prometheus -R

-- 5. etc/prometheus 폴더로 이동해서 'll' 명령어를 통해 소유권이 변경됐는지 확인
cd /etc/prometheus
ll
-- 6. 프로메테우스가 시스템의 서비스로 운영될 수 있도록 systemd에 등록
-- system으로 이동
cd /etc/systemd/system
-- prometheus 서비스 파일 생성
sudo vim prometheus.service파일에 다음 설정을 붙혀넣는다.
[Unit]
Description=Prometheus
Wants=network-online.target
After=network-online.target

[Service]
User=prometheus
restart=on-failure
ExecStart=/etc/prometheus/prometheus \
		--config.file=/etc/prometheus/prometheus.yml \
        --storage.tsdb.path=/var/lib/prometheus \
        --web.console.templates=/etc/prometheus/console \
        --web.console.libraries=/etc/prometheus/console_libraries \
        --web.listen-address=0.0.0.0:9090 \
        --web.external-url=

[Install]
WantedBy=multi-user.target
-- storage파일로 설정된 /var/lib/prometheus 폴더를 생성 + 권한을 prometheus로 변경
sudo mkdir -p /var/lib/prometheus
sudo chown prometheus:prometheus /var/lib/prometheus
-- 서비스 재시작
sudo systemctl daemon-reload
sudo systemctl enable prometheus
sudo systemctl start prometheus
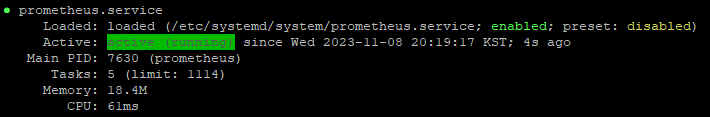
-- 프로메테우스 서비스 상태 확인
sudo systemctl status prometheus.servicerunning인지 확인하자.
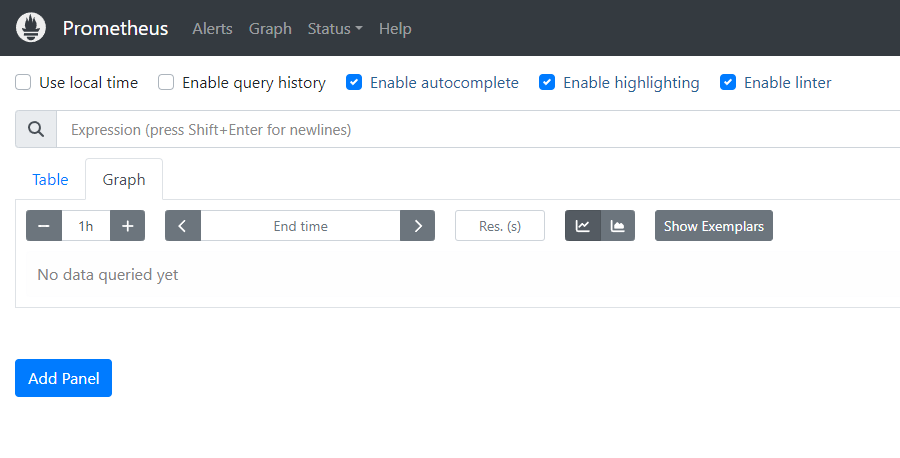
대시보드 확인
프로메테우스가 정상적으로 나오는 것을 확인할 수 있다.
그라파나
다운로드 및 실행
다운로드 링크로 들어가서 yum install을 복붙해서 설치하자.
sudo yum install -y https://dl.grafana.com/enterprise/release/grafana-enterprise-10.2.0-1.x86_64.rpm

sudo systemctl enable grafana-server.service
sudo systemctl start grafana-server.service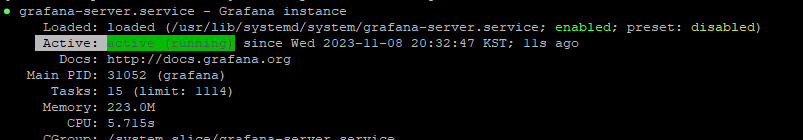
sudo systemctl status grafana-server.serviceactive(running)을 확인하자
대시보드 확인
그라파나가 정상적으로 나오는 것을 확인할 수 있다.
설정에 대한 자세한 사항들은 이전 글을 참고하자.
참고
영문-Amazon Linux에 프로메테우스 설치법
Velog - Prometheus, Grafana를 이용한 EC2 시각화

개발 기록 아카이브