
Evaluation Metrics for Classification
- Confusion matrix
- 정밀도, 재현율
- ROC curve, AUC 점수
1. Confusion matrix
그림1.
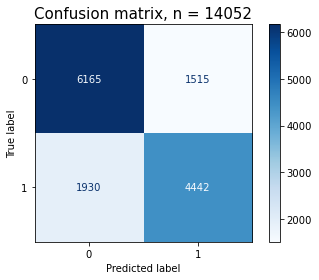
- Confusion Matrix : 분류 모델의 성능 평가 지표
- tp = [1,1] = 실제 양성 + 예측 양성
- tn = [0,0] = 실제 음성 + 예측 음성
- fp = [0,1] = 실제 음성 + 예측 양성
- fn = [1,0] = 실제 양성 + 에측 음성
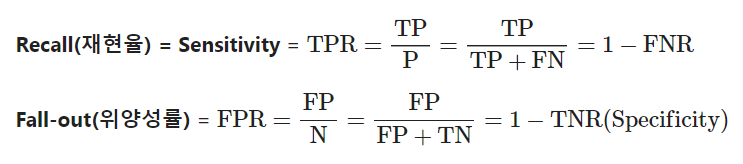
- precision(정밀도), recall(재현율)
- 정밀도 = tp/(tp+fp) = 전체 예측 양성 중 올바른 양성 비율
- 재현율 = tp/(tp+fn) = 전체 실제 양성 중 올바른 양성 비율
- 정밀도와 재현율이 쓰일 때의 상황은 다르다.
- 정밀도를 높여야 할 때 추천광고, 추천영화, OTT서비스 등
- 재현율를 높여야 할 때 암 판정 등
#정밀도, 재현율, f1
from sklearn.metrics import classification_report
classification_report(y_real, y_pred)

#시각화
#fig, ax = plt.subplots()
pcm = plot_confusion_matrix(pipe, X_val, y_val,
                            cmap=plt.cm.Blues,
                            ax=ax);
plt.title(f'Confusion matrix, n = {len(y_val)}', fontsize=15)
plt.show()
#결과 = 그림1과 비슷하게 나온다.

# confusion matrix(array)
cm = pcm.confusion_matrix
cm

# 양성 확률
y_pred_proba = pipe.predict_proba(x_train)[:, 1]
y_pred_proba

# 시각화
import seaborn as sns
sns.displot(y_pred_proba);- threshold(임계값)
랜덤 포레스트의 임계값 디폴트는 0.5이다.
임계값이 높아질수록 1을 더 힘들게 나온다.
임계값이 낮아질수록 1이 더 쉽게 나온다.
# 최적 threshold 값 찾기
optimal_idx = np.argmax(tpr - fpr)
optimal_threshold = thresholds[optimal_idx]

print('idx:', optimal_idx, ', threshold:', optimal_threshold)

#임계값 이상(true)
y_pred_optimal = y_pred_proba >= optimal_threshold

fig, ax = plt.subplots()
pcm = plot_confusion_matrix(pipe, x_train, y_pred_optimal,
                            cmap=plt.cm.Blues,
                            ax=ax);
plt.title(f'Confusion matrix, n = {len(y_train)}', fontsize=15)
plt.show()

y_train_pred = pipe.predict(x_train)
y_train_pred_proba = pipe.predict_proba(x_train)[:,1]

#auc_score(임계값 조정)
auc_score_opti = roc_auc_score(y_train, y_train_pred_proba)
print('auc_score_opti : ', auc_score_opti)

#auc_score(조정 x)
auc_score = roc_auc_score(y_train, y_train_pred)
print('auc_score : ', auc_score)

#학습
y_pred = pipe.predict(x_test)
#예측값 확률값으로 반환
y_pred_proba = pipe.predict_proba(x_test)[:,1]
#최적 임계값으로 조정
y_pred_optimal = y_pred_proba >= optimal_threshold
# True값 1로 변경, 그 외 0 으로 변경
y_pred_optimal = np.where(y_pred_optimal == True, 1, 0)

#결과 = 에측값이 임계값 조정으로 바뀜 스코어 점수 향상
3. Roc curve, Auc score
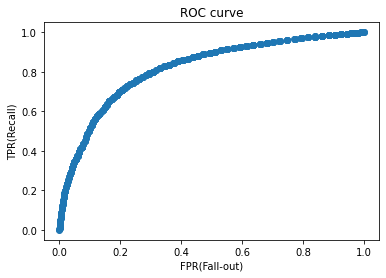
- AUC 는 ROC curve의 아래 면적을 말합니다.
4. 회고
이 파트 너무 힘들었다. 이해가 안된다보다는 헷갈린다가 더 맞는 말인거 같다. 들을 때 이해는 되는데 또 내가 생각할 때는 꼬여서 헷갈리게 된다. 계속 열심히 보면서 뇌에 좀 맞춰줘야겠다. 반복이 답이다.
힘들지만 그래도 괜찮은 점은 재밌다는 것이다. 그래서 계속 할 수 있다. 그리고 같이 하는 동기분들을 보면 저절로 해야한다는 생각이 든다. 또 주변에서 응원을 해줘서 더 열심히 할 수 있다.

미래의 데이터 분석가~@