map에 overlay를 추가하여 모달을 띄울 수 있다!
<div id="martInfo_pop" style="display:none;">
<table style="background-color:white;">
	<tbody id="featureInfoList">

	</tbody>
</table>
</div>

<script>
// overlay 선언하기
const overlay = new ol.Overlay({
	autoPan : true,
	element: document.getElementById('martInfo_pop'),
	autoPanAnimation : {
        duration : 250,
	}
});

let map = new ol.Map({
	target: 'map',
    layers: [
    	mapLayer
    ],
    overlays: [overlay], //overlay 추가
    view: view
});
</script>
그 전 게시글에서 했던 지도상 클릭한 정보 불러오기를 통해 overlay까지 호출할 수 있다.
<script>
map.addEventListener('singleclick', function(evt) {
const viewResolution = (view.getResolution());
const wmsSource = new ol.source.ImageWMS({
url: 'https://localhost:8080/geoserver/mart/wms?',
params: {
'layers':'mart:mart'
},
serverType: 'geoserver',
ratio: 1,
crossOrigin: 'anonymous'
});
const url = wmsSource.getFeatureInfoUrl(
evt.coordinate,
viewResolution,
'EPSG:3857',
{'INFO_FORMAT': 'application/json',
'QUERY_LAYERS' : 'mart:mart'
}
);
if (url) {
fetch(url, {
method: "POST",
mode: 'cors',
headers: {
"Content-Type": "application/json"
}
})
.then((response) => response.json())
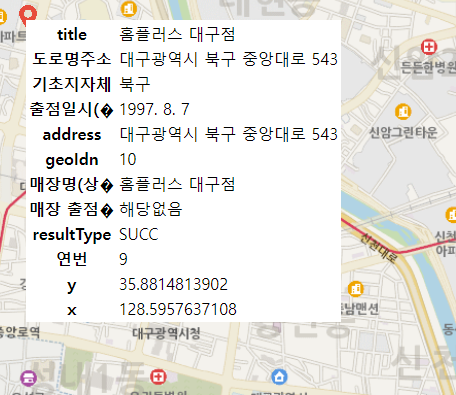
.then(html => {
// 받아온 정보로 모달 세팅
const featuresInfo = html.features[0].properties;
const tbody = document.getElementById('featureInfoList');
let appendHtml = '';
for (let key in featuresInfo) {
appendHtml += '<tr><th>'+key+'</th><td>'+featuresInfo[key]+'</td></tr>';
}
tbody.replaceChildren();
tbody.insertAdjacentHTML("beforeend",appendHtml);
document.getElementById('martInfo_pop').style.display = 'block';
// 클릭한 위치(evt.coordinate)에 오버레이 생성하기
overlay.setPosition(evt.coordinate);
})
}
})
</script>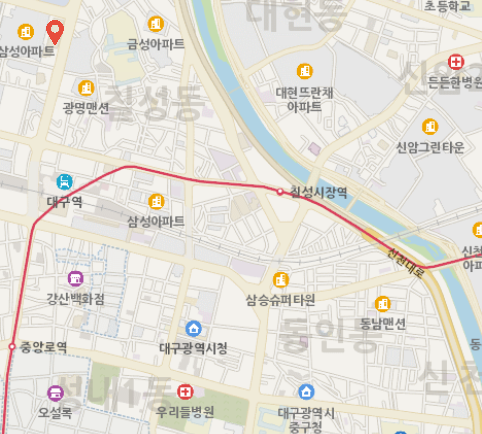
- 전체 코드
<div id="map" style="width:100%; height:1000px;"></div>

<div id="martInfo_pop" style="display:none;">
<table style="background-color:white;">
	<tbody id="featureInfoList">

	</tbody>
</table>
</div>
<script>
const view = new ol.View({
	projection: 'EPSG:3857',
 	center: [14210441.372369962, 4272332.772121915],
 	zoom: 8,
 	minZoom: 8,
	maxZoom: 20
});

const mapLayer = new ol.layer.Tile({
    source: new ol.source.XYZ({
		url : 'http://api.vworld.kr/req/wmts/1.0.0/[vworldApiKey]/Base/{z}/{y}/{x}.png',
		crossOrigin: "Anonymous",
		minZoom: 8,
		maxZoom: 20
    })
});

const overlay = new ol.Overlay({
	autoPan : true,
	element: document.getElementById('martInfo_pop'),
	autoPanAnimation : {
        duration : 250,
	}
});

let map = new ol.Map({
	target: 'map',
    layers: [
    	mapLayer
    ],
    overlays: [overlay],
    view: view
});

const wmsSource =  new ol.source.ImageWMS({
	url: 'http://localhost:8080/geoserver/mart/wms?',
	params: {
		'layers':'mart:mart'
	},
	serverType: 'geoserver',
	crossOrigin: 'anonymous'
});
const layer = new ol.layer.Image({
	source : wmsSource
});

map.addLayer(layer);

map.addEventListener('singleclick', function(evt) {
	const viewResolution = (view.getResolution());

	const wmsSource =  new ol.source.ImageWMS({
		url: 'http://localhost:8080/geoserver/mart/wms?',
		params: {
			'layers':'mart:mart'
		},
		serverType: 'geoserver',
		ratio: 1,
		crossOrigin: 'anonymous'
	});

	const url = wmsSource.getFeatureInfoUrl(
		evt.coordinate,
		viewResolution,
		'EPSG:3857',
		{'INFO_FORMAT': 'application/json',
		 'QUERY_LAYERS' : 'mart:mart'
		}
	);
	if (url) {
		fetch(url, {
			  method: "POST",
			  mode: 'cors',
			  headers: {
			    "Content-Type": "application/json"
			  }
			})
			  .then((response) => response.json())
			  .then(html => {
				  const featuresInfo = html.features[0].properties;
				  const tbody = document.getElementById('featureInfoList');
				  let appendHtml = '';
				  for (let key in featuresInfo) {
					  appendHtml += '<tr><th>'+key+'</th><td>'+featuresInfo[key]+'</td></tr>';
				  }

				  tbody.replaceChildren();
				  tbody.insertAdjacentHTML("beforeend",appendHtml);

				  document.getElementById('martInfo_pop').style.display = 'block';
				  overlay.setPosition(evt.coordinate);
			  })
	}
})
</script>
기록끼록끼룩